 15
15peptides
spectra
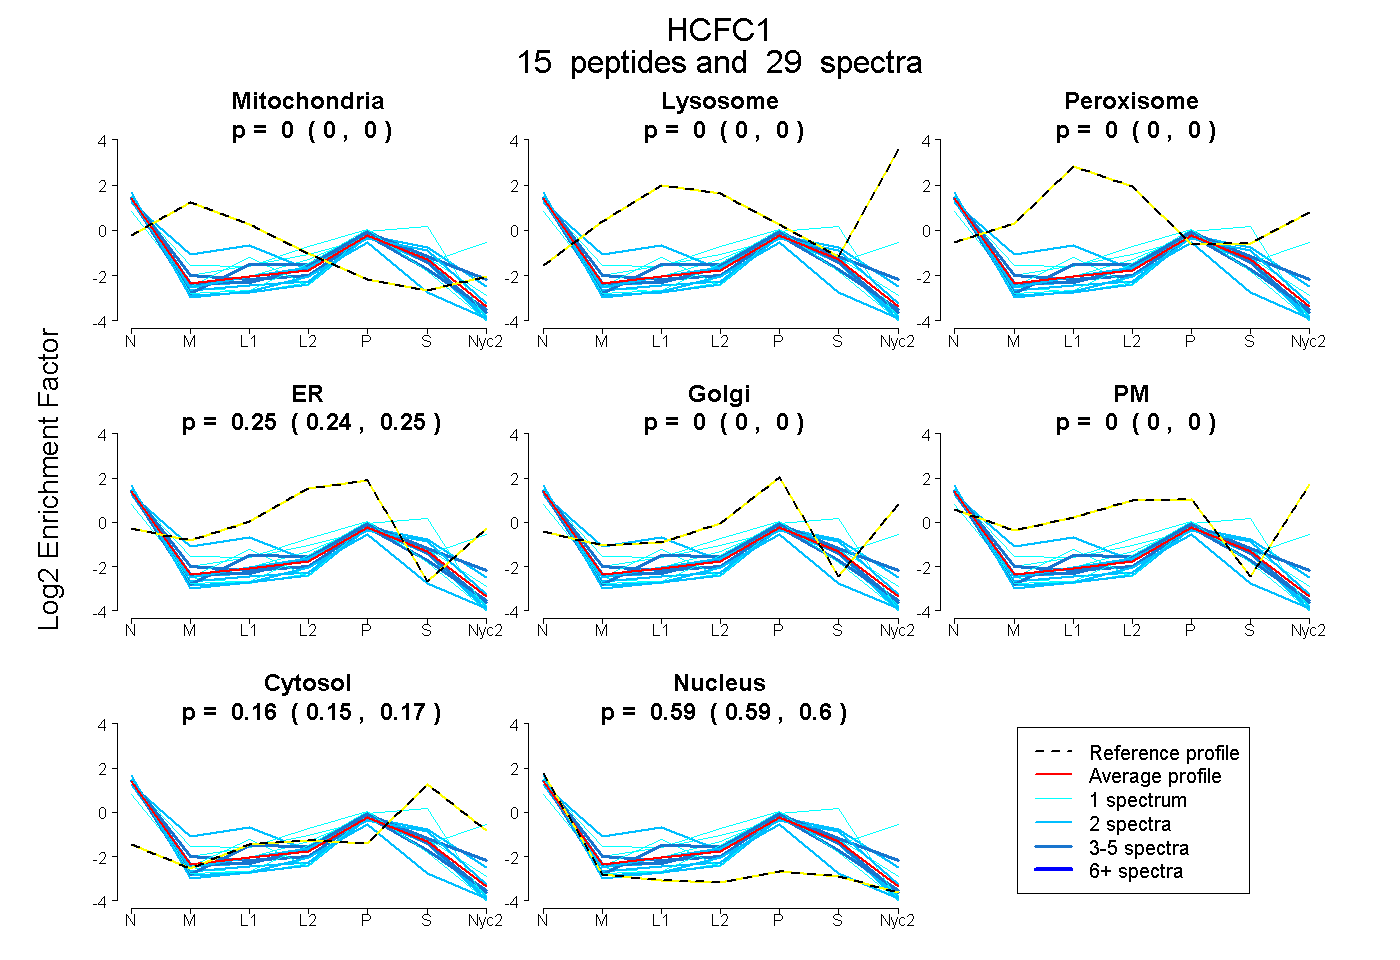
0.000 | 0.000
0.000 | 0.000
0.000 | 0.000
0.240 | 0.253
0.000 | 0.000
0.000 | 0.000
0.149 | 0.168
0.587 | 0.600
| Plot | Mito | Lyso | Perox | ER | Golgi | PM | Cytosol | Nucleus | |||||
| Expt A |
15 peptides |
29 spectra |
|
0.000 0.000 | 0.000 |
0.000 0.000 | 0.000 |
0.000 0.000 | 0.000 |
0.247 0.240 | 0.253 |
0.000 0.000 | 0.000 |
0.000 0.000 | 0.000 |
0.159 0.149 | 0.168 |
0.594 0.587 | 0.600 |
| 1 spectrum, AGHCAVAINTR | 0.000 | 0.000 | 0.004 | 0.323 | 0.000 | 0.000 | 0.175 | 0.498 | ||
| 2 spectra, VVGWSGPVPRPR | 0.000 | 0.000 | 0.000 | 0.207 | 0.000 | 0.000 | 0.000 | 0.793 | ||
| 2 spectra, ENQWFDVGVIK | 0.228 | 0.000 | 0.003 | 0.214 | 0.000 | 0.000 | 0.104 | 0.450 | ||
| 1 spectrum, VATHEK | 0.000 | 0.000 | 0.000 | 0.278 | 0.000 | 0.000 | 0.027 | 0.696 | ||
| 4 spectra, LYIWSGR | 0.000 | 0.000 | 0.000 | 0.276 | 0.000 | 0.000 | 0.067 | 0.657 | ||
| 1 spectrum, QELQPGTAYK | 0.000 | 0.000 | 0.000 | 0.272 | 0.000 | 0.000 | 0.135 | 0.592 | ||
| 1 spectrum, LGHSFSLVGNK | 0.000 | 0.000 | 0.000 | 0.000 | 0.106 | 0.418 | 0.152 | 0.324 | ||
| 2 spectra, GYGPATQVR | 0.000 | 0.000 | 0.000 | 0.141 | 0.000 | 0.000 | 0.133 | 0.726 | ||
| 3 spectra, VAGINACGR | 0.000 | 0.000 | 0.000 | 0.253 | 0.052 | 0.000 | 0.230 | 0.465 | ||
| 2 spectra, LVIYGGMSGCR | 0.000 | 0.000 | 0.000 | 0.179 | 0.000 | 0.000 | 0.132 | 0.689 | ||
| 2 spectra, GPFSEISAFK | 0.000 | 0.000 | 0.000 | 0.173 | 0.053 | 0.000 | 0.292 | 0.482 | ||
| 2 spectra, YSNDLYELQASR | 0.000 | 0.000 | 0.000 | 0.206 | 0.000 | 0.000 | 0.244 | 0.550 | ||
| 1 spectrum, DLWYLETEKPPPPAR | 0.000 | 0.000 | 0.000 | 0.148 | 0.000 | 0.000 | 0.145 | 0.707 | ||
| 4 spectra, SSTPAQLAFMR | 0.000 | 0.000 | 0.000 | 0.266 | 0.000 | 0.000 | 0.110 | 0.623 | ||
| 1 spectrum, TQGVPAVLK | 0.000 | 0.000 | 0.000 | 0.094 | 0.000 | 0.000 | 0.440 | 0.466 |
| Plot | Mito | Lyso or Perox | ER | Golgi | PM | Cytosol | Nucleus | ||||||
| Expt B |
3 peptides |
3 spectra |
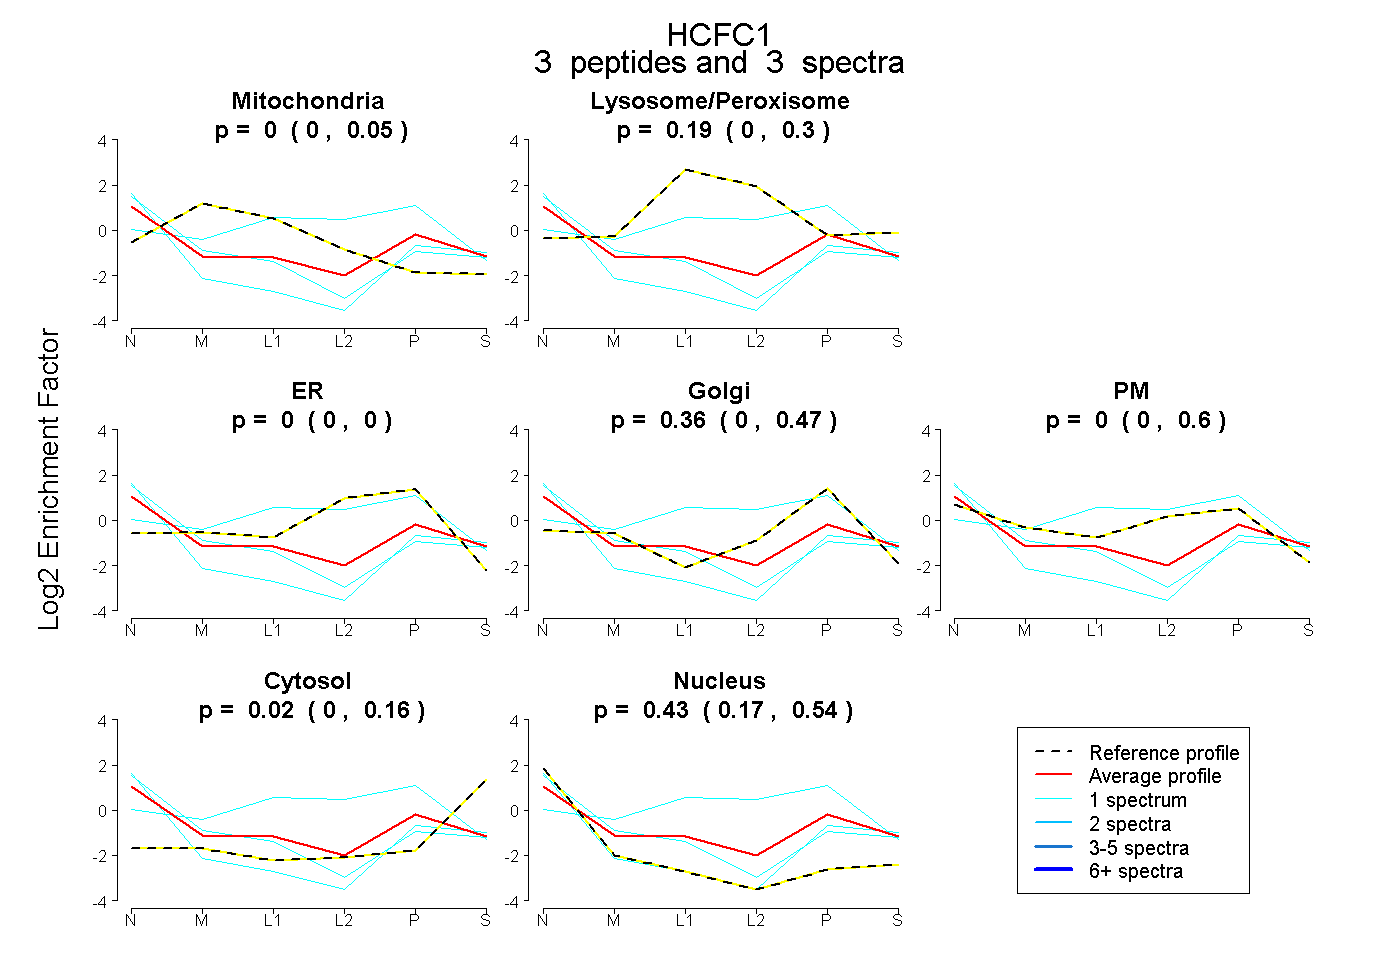 |
0.000 0.000 | 0.050 |
0.190 0.000 | 0.303 |
0.000 0.000 | 0.000 |
0.356 0.000 | 0.468 |
0.000 0.000 | 0.595 |
0.023 0.000 | 0.164 |
0.431 0.166 | 0.538 |
|||
| Plot | Lyso | Other | |||||||||||
| Expt C |
4 peptides |
5 spectra |
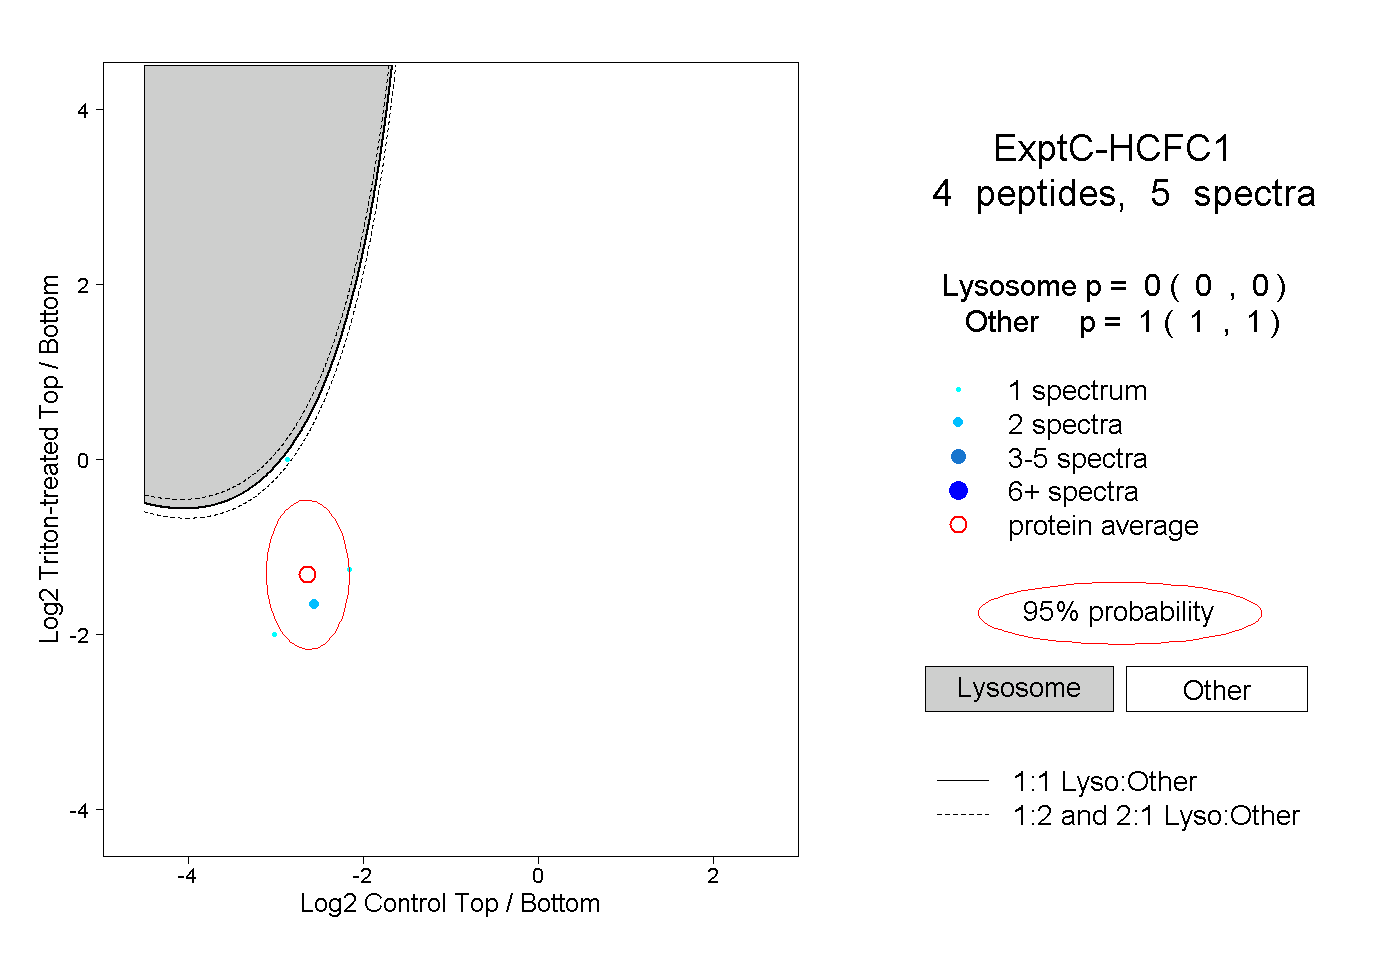 |
0.000 0.000 | 0.000 |
1.000 1.000 | 1.000 |