 7
7peptides
spectra
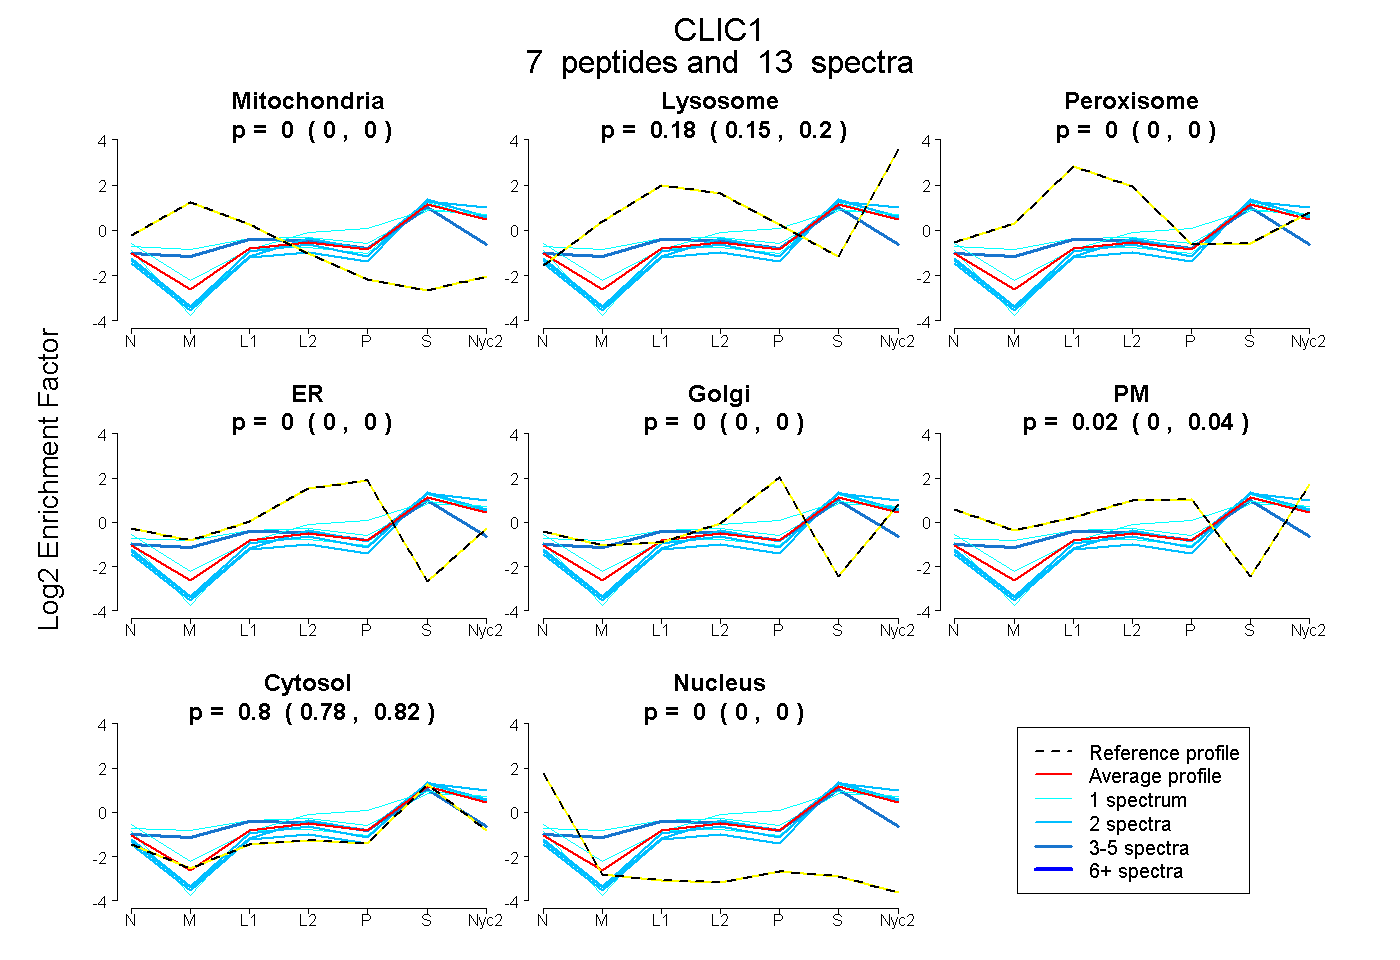
0.000 | 0.000
0.152 | 0.200
0.000 | 0.000
0.000 | 0.000
0.000 | 0.000
0.000 | 0.036
0.785 | 0.816
0.000 | 0.000
3peptides
spectra
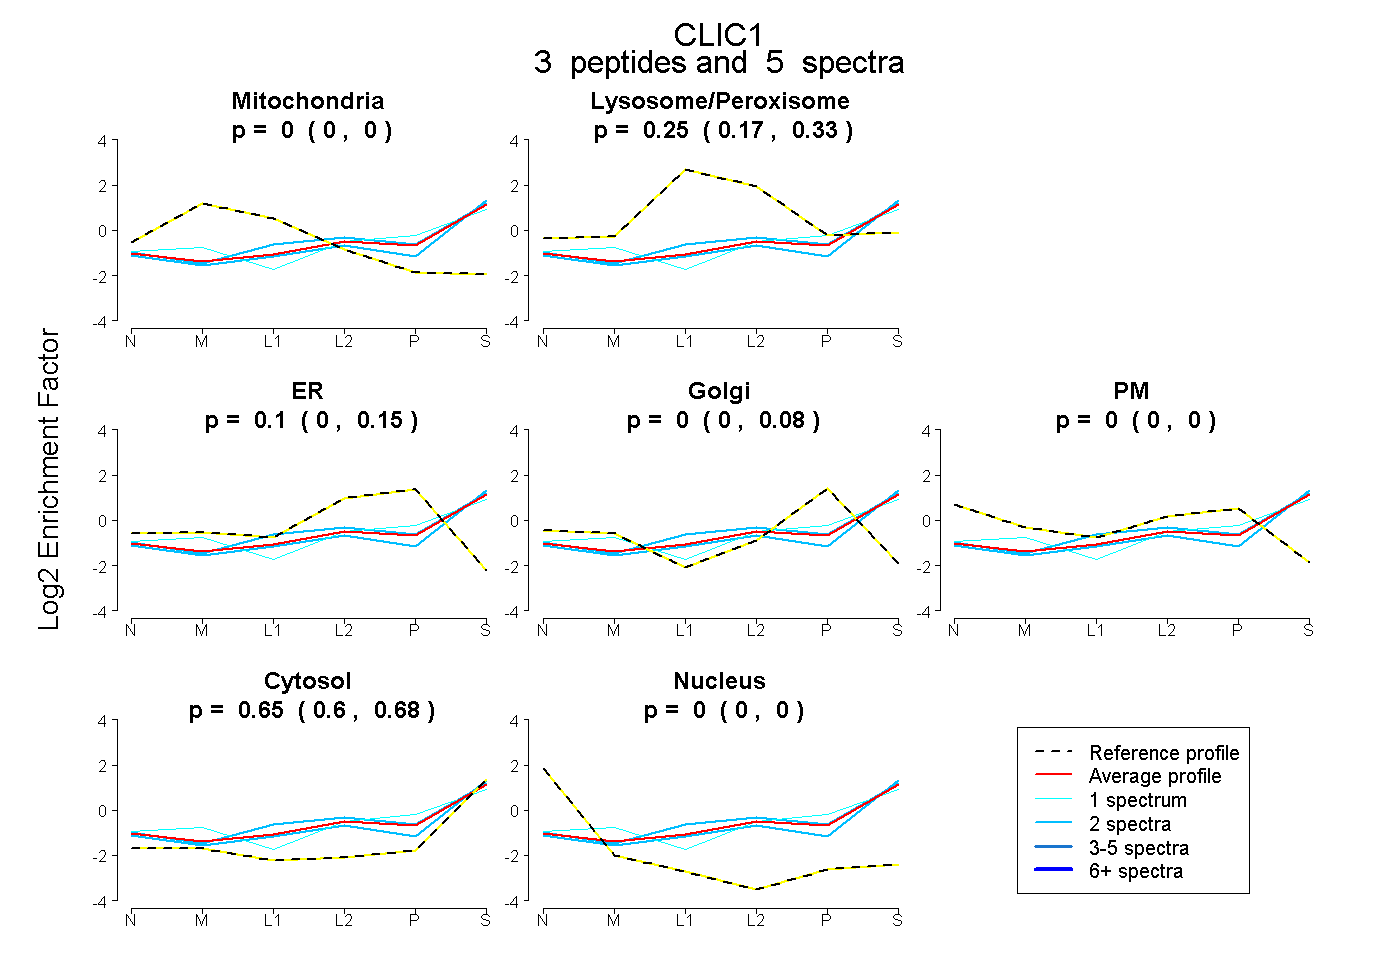
0.000 | 0.000
0.166 | 0.332
0.000 | 0.152
0.000 | 0.083
0.000 | 0.000
0.597 | 0.679
0.000 | 0.000
8peptides
spectra
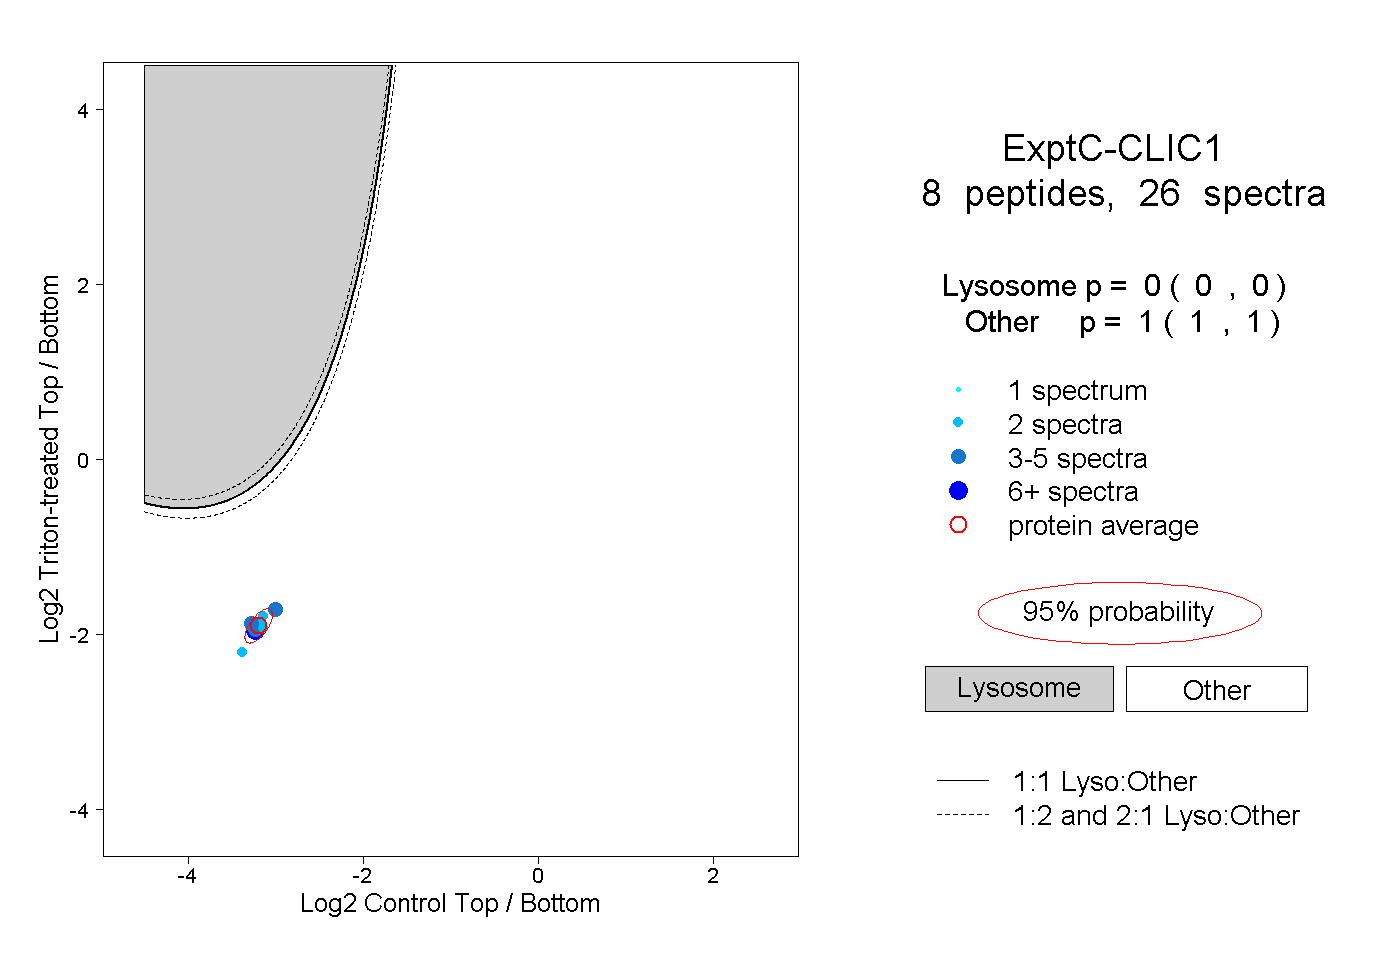
0.000 | 0.000
1.000 | 1.000
3peptides
spectra
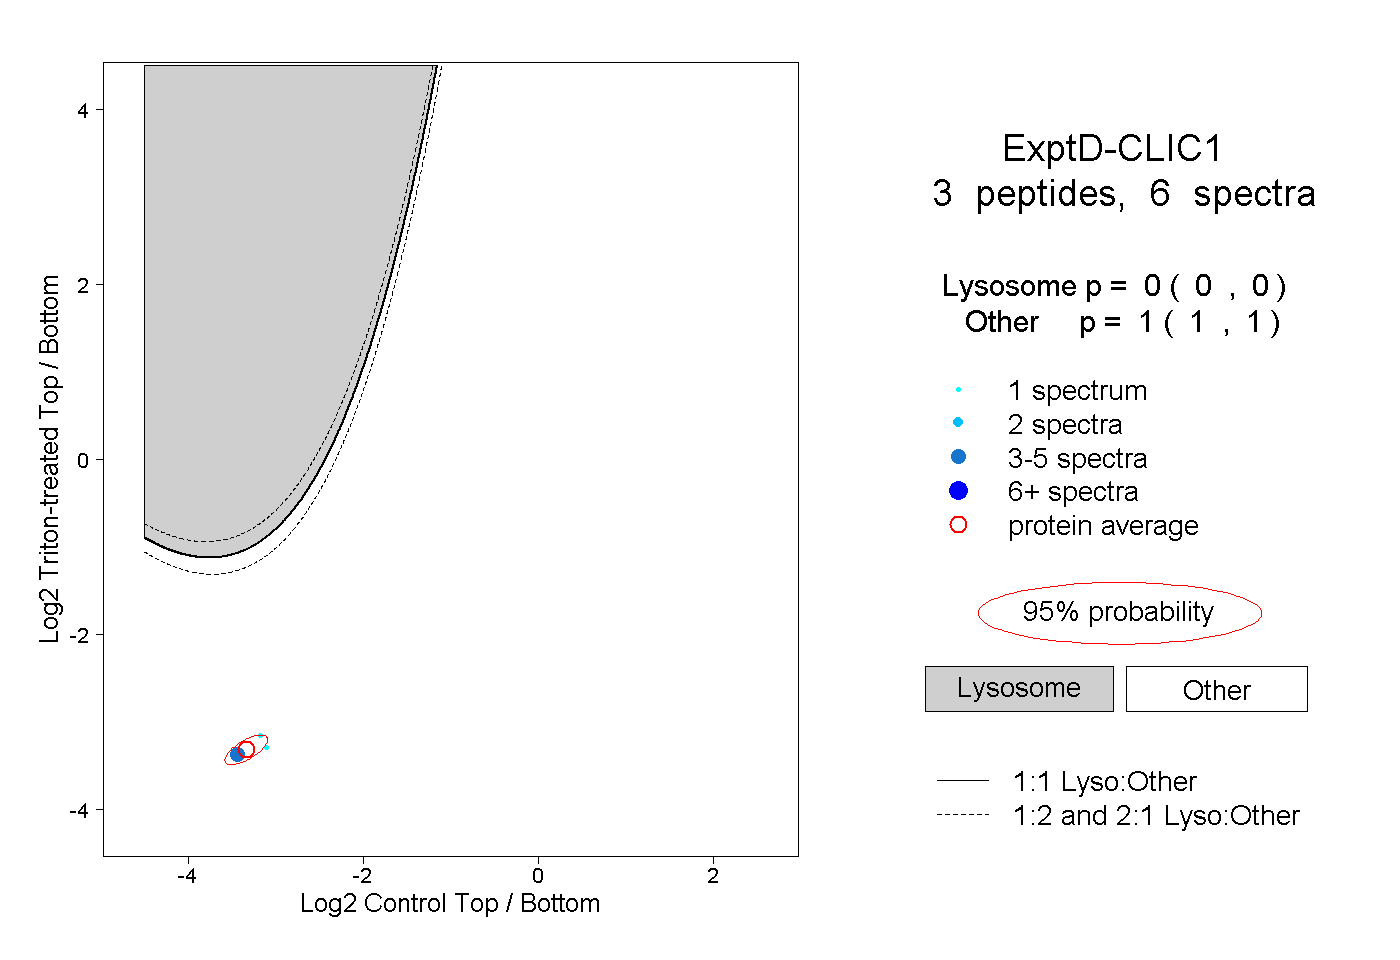
0.000 | 0.000
1.000 | 1.000