 7
7peptides
spectra
0.000 | 0.000
0.152 | 0.200
0.000 | 0.000
0.000 | 0.000
0.000 | 0.000
0.000 | 0.036
0.785 | 0.816
0.000 | 0.000
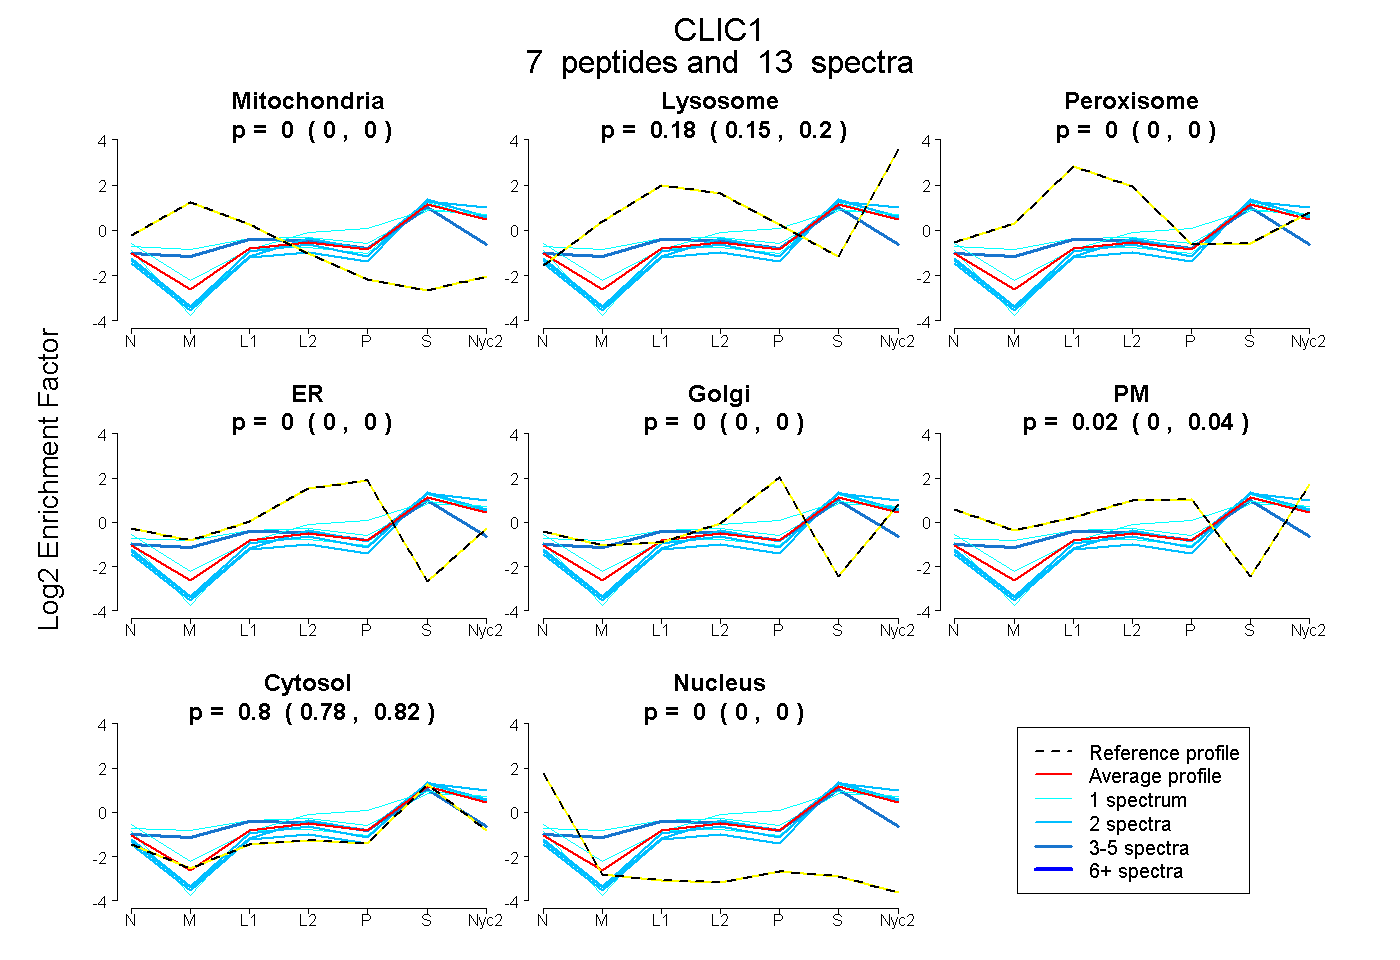
| Plot | Mito | Lyso | Perox | ER | Golgi | PM | Cytosol | Nucleus | |||||
| Expt A |
7 peptides |
13 spectra |
|
0.000 0.000 | 0.000 |
0.179 0.152 | 0.200 |
0.000 0.000 | 0.000 |
0.000 0.000 | 0.000 |
0.000 0.000 | 0.000 |
0.019 0.000 | 0.036 |
0.802 0.785 | 0.816 |
0.000 0.000 | 0.000 |
| 2 spectra, IGNCPFSQR | 0.000 | 0.080 | 0.000 | 0.000 | 0.000 | 0.000 | 0.920 | 0.000 | ||
| 1 spectrum, FLDGNELTLADCNLLPK | 0.000 | 0.105 | 0.000 | 0.000 | 0.000 | 0.010 | 0.885 | 0.000 | ||
| 1 spectrum, AGSDGAK | 0.000 | 0.238 | 0.079 | 0.000 | 0.000 | 0.084 | 0.599 | 0.000 | ||
| 4 spectra, LHIVQVVCK | 0.037 | 0.000 | 0.254 | 0.015 | 0.005 | 0.000 | 0.688 | 0.000 | ||
| 1 spectrum, TETVQK | 0.000 | 0.119 | 0.000 | 0.000 | 0.033 | 0.199 | 0.650 | 0.000 | ||
| 2 spectra, NSNPALNDNLEK | 0.000 | 0.175 | 0.000 | 0.000 | 0.000 | 0.000 | 0.825 | 0.000 | ||
| 2 spectra, GFTIPEAFR | 0.000 | 0.135 | 0.000 | 0.000 | 0.000 | 0.000 | 0.865 | 0.000 |
| Plot | Mito | Lyso or Perox | ER | Golgi | PM | Cytosol | Nucleus | ||||||
| Expt B |
3 peptides |
5 spectra |
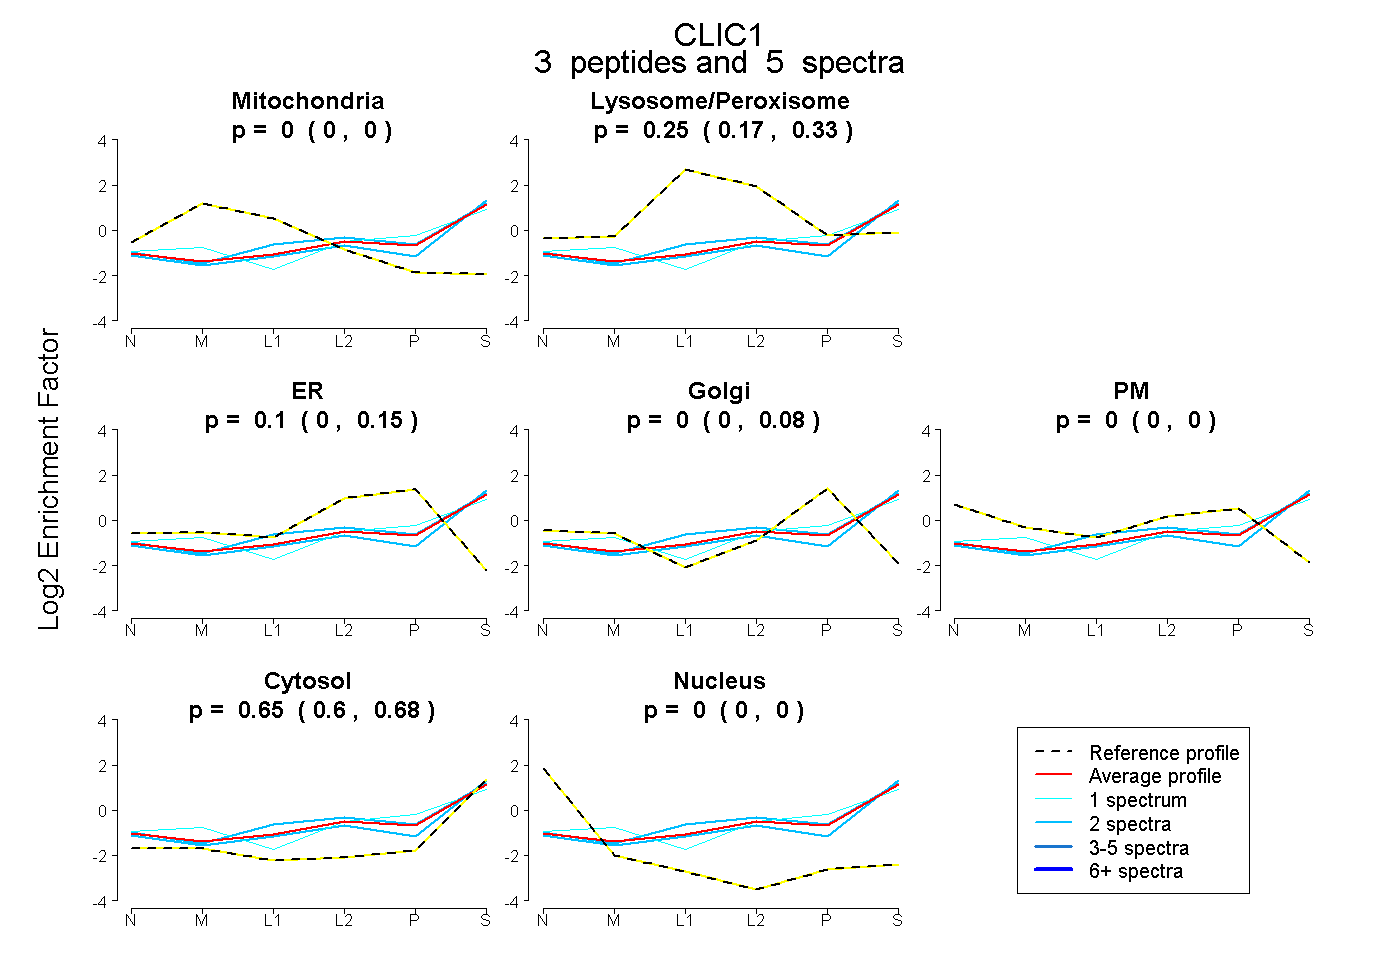 |
0.000 0.000 | 0.000 |
0.251 0.166 | 0.332 |
0.098 0.000 | 0.152 |
0.000 0.000 | 0.083 |
0.000 0.000 | 0.000 |
0.651 0.597 | 0.679 |
0.000 0.000 | 0.000 |
|||
| Plot | Lyso | Other | |||||||||||
| Expt C |
8 peptides |
26 spectra |
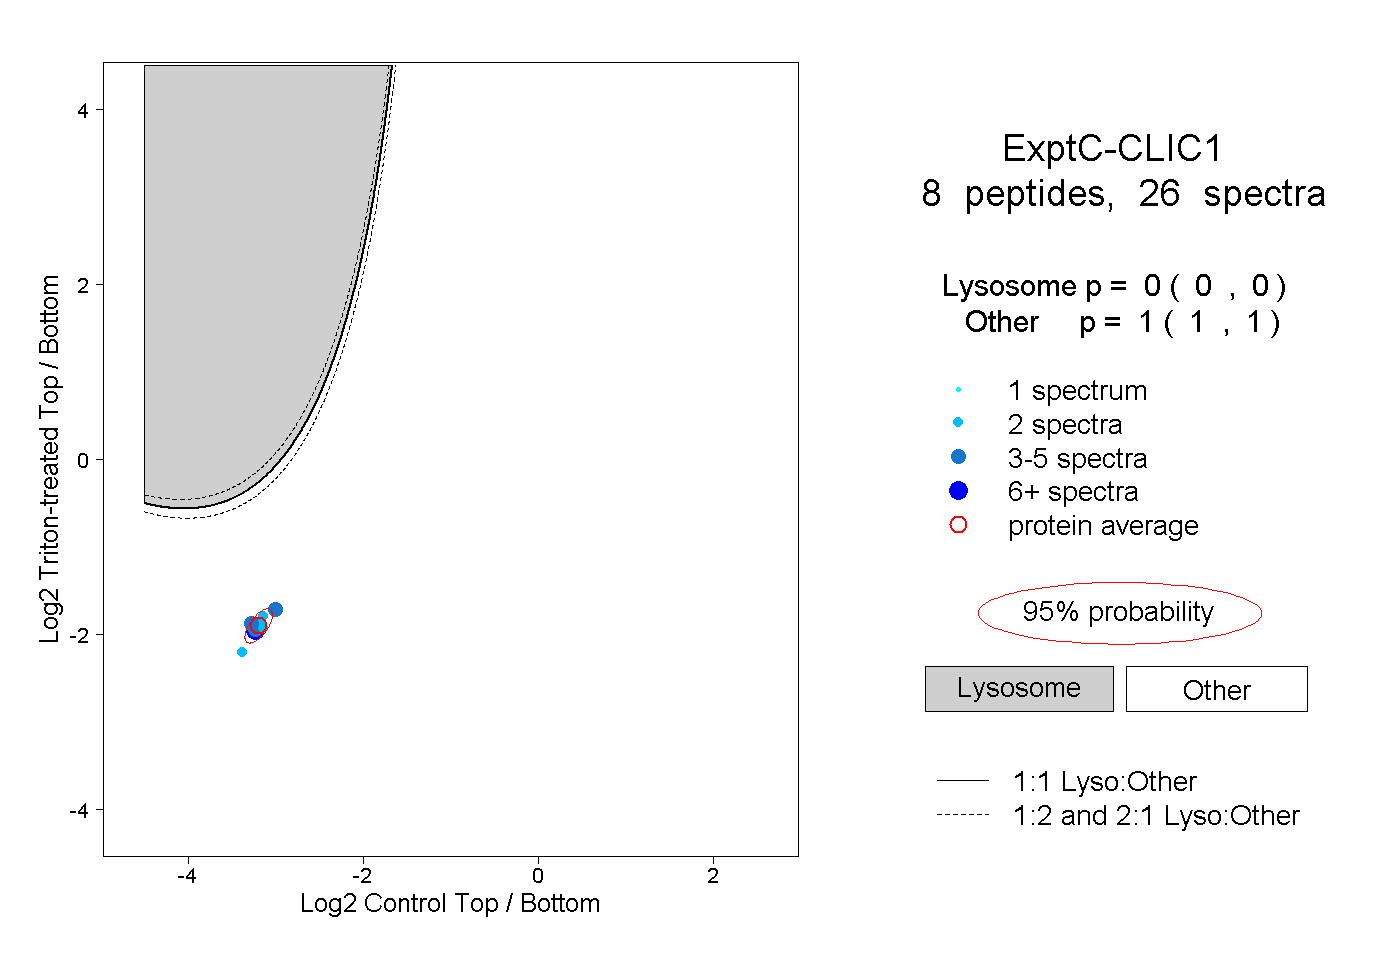 |
0.000 0.000 | 0.000 |
1.000 1.000 | 1.000 |
||||||||
| Plot | Lyso | Other | |||||||||||
| Expt D |
3 peptides |
6 spectra |
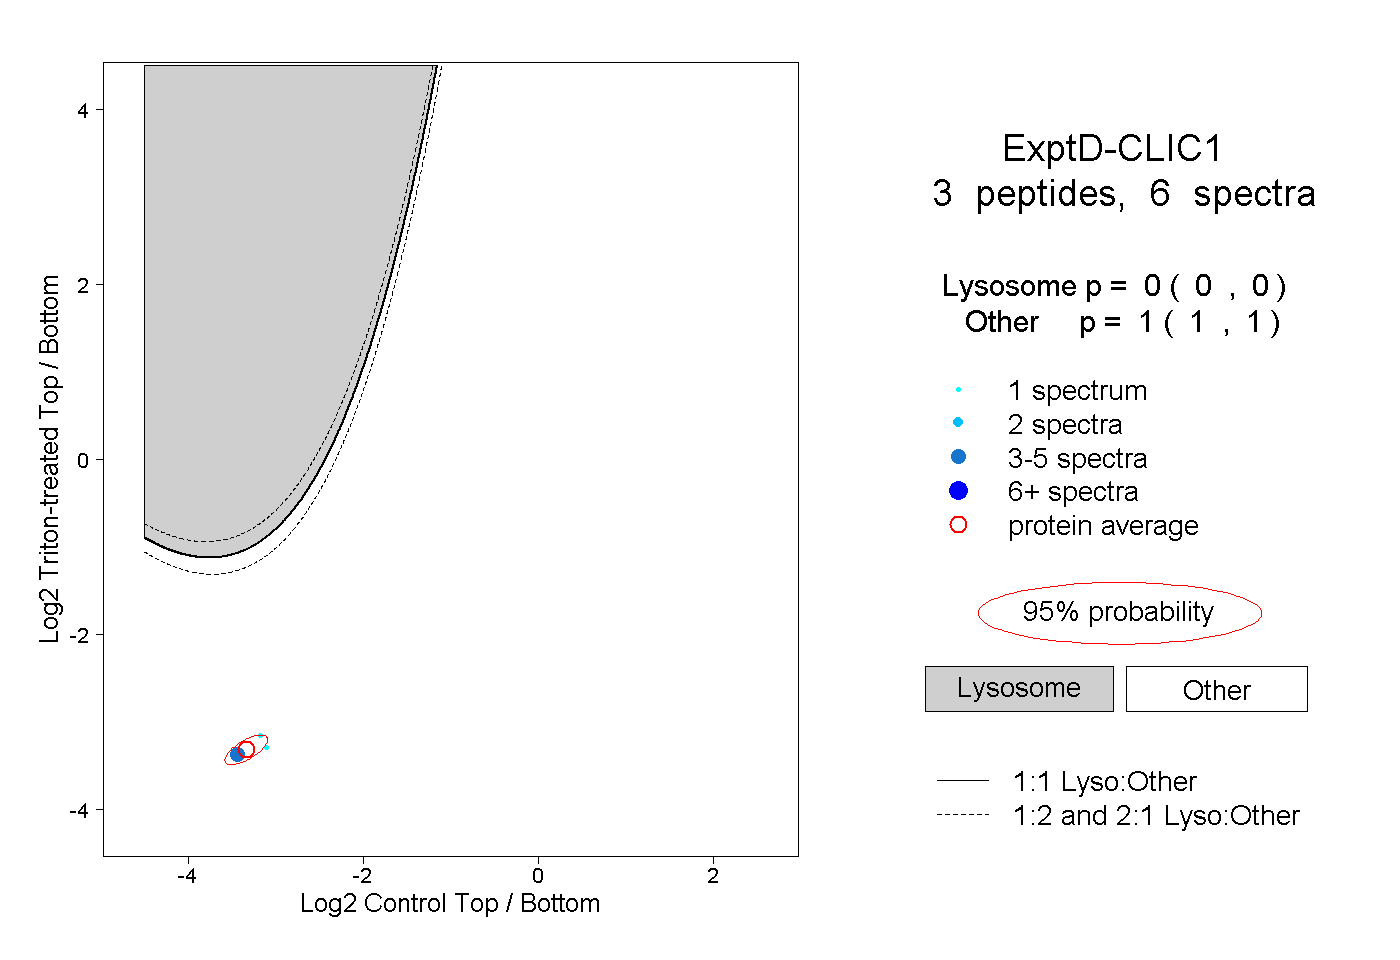 |
0.000 0.000 | 0.000 |
1.000 1.000 | 1.000 |