CLIC1
[ENSRNOP00000060240]
Main page
| | | Plot |
Mito |
Lyso |
|
Perox |
ER |
Golgi |
PM |
Cytosol |
Nucleus |
|
| Expt A |
 7
7
peptides |
13
spectra |
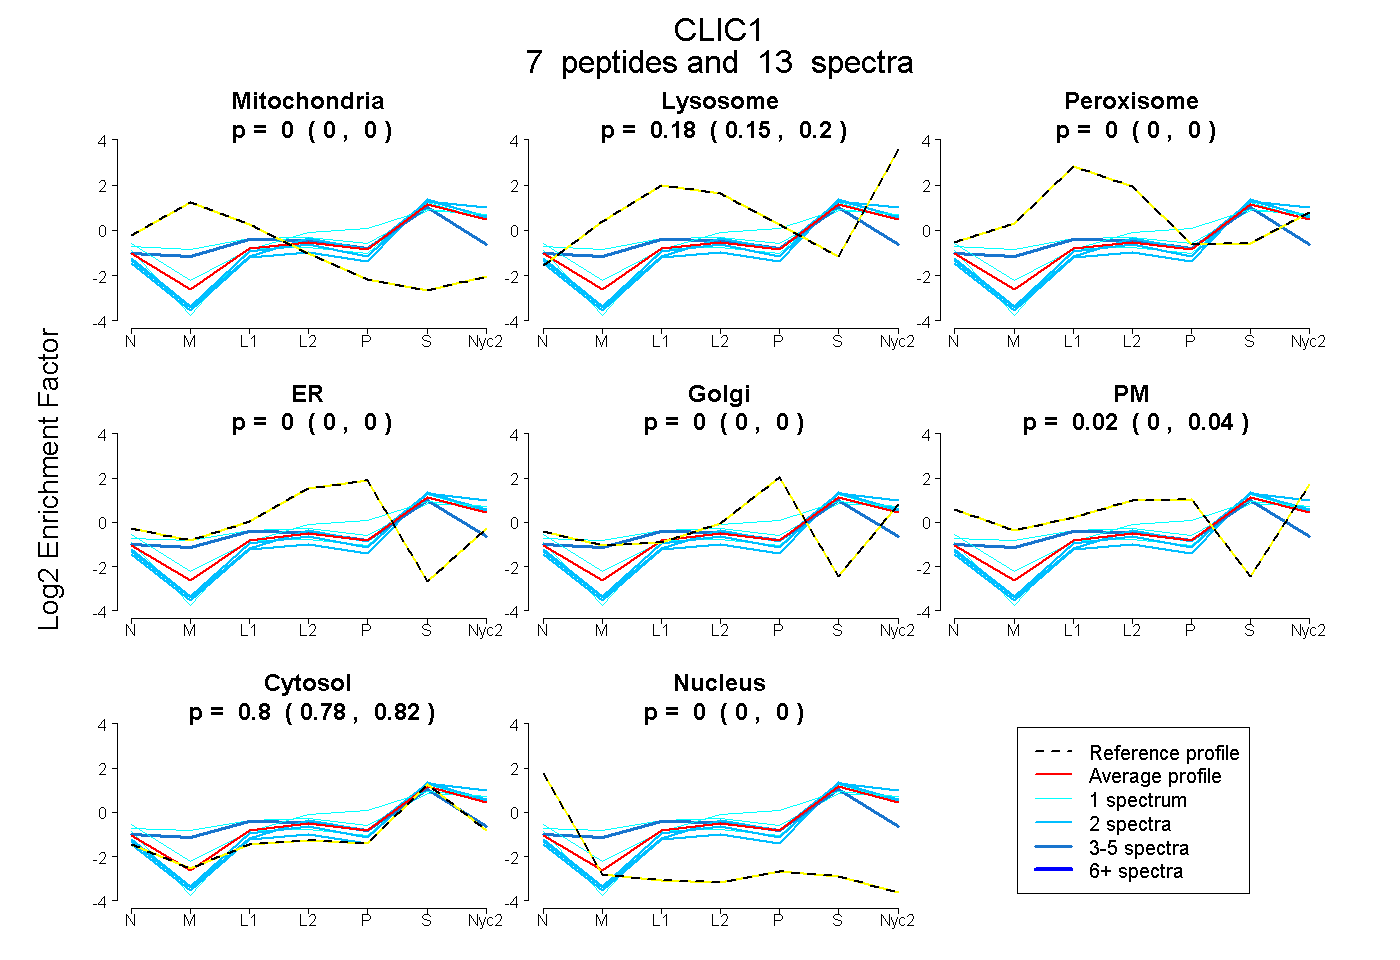 |
0.000
0.000 | 0.000 |
0.179
0.152 | 0.200 |
|
0.000
0.000 | 0.000 |
0.000
0.000 | 0.000 |
0.000
0.000 | 0.000 |
0.019
0.000 | 0.036 |
0.802
0.785 | 0.816 |
0.000
0.000 | 0.000 |
|
| | | Plot |
Mito |
|
Lyso or Perox |
|
ER |
Golgi |
PM |
Cytosol |
Nucleus |
|
| Expt B |
3
peptides |
5
spectra |
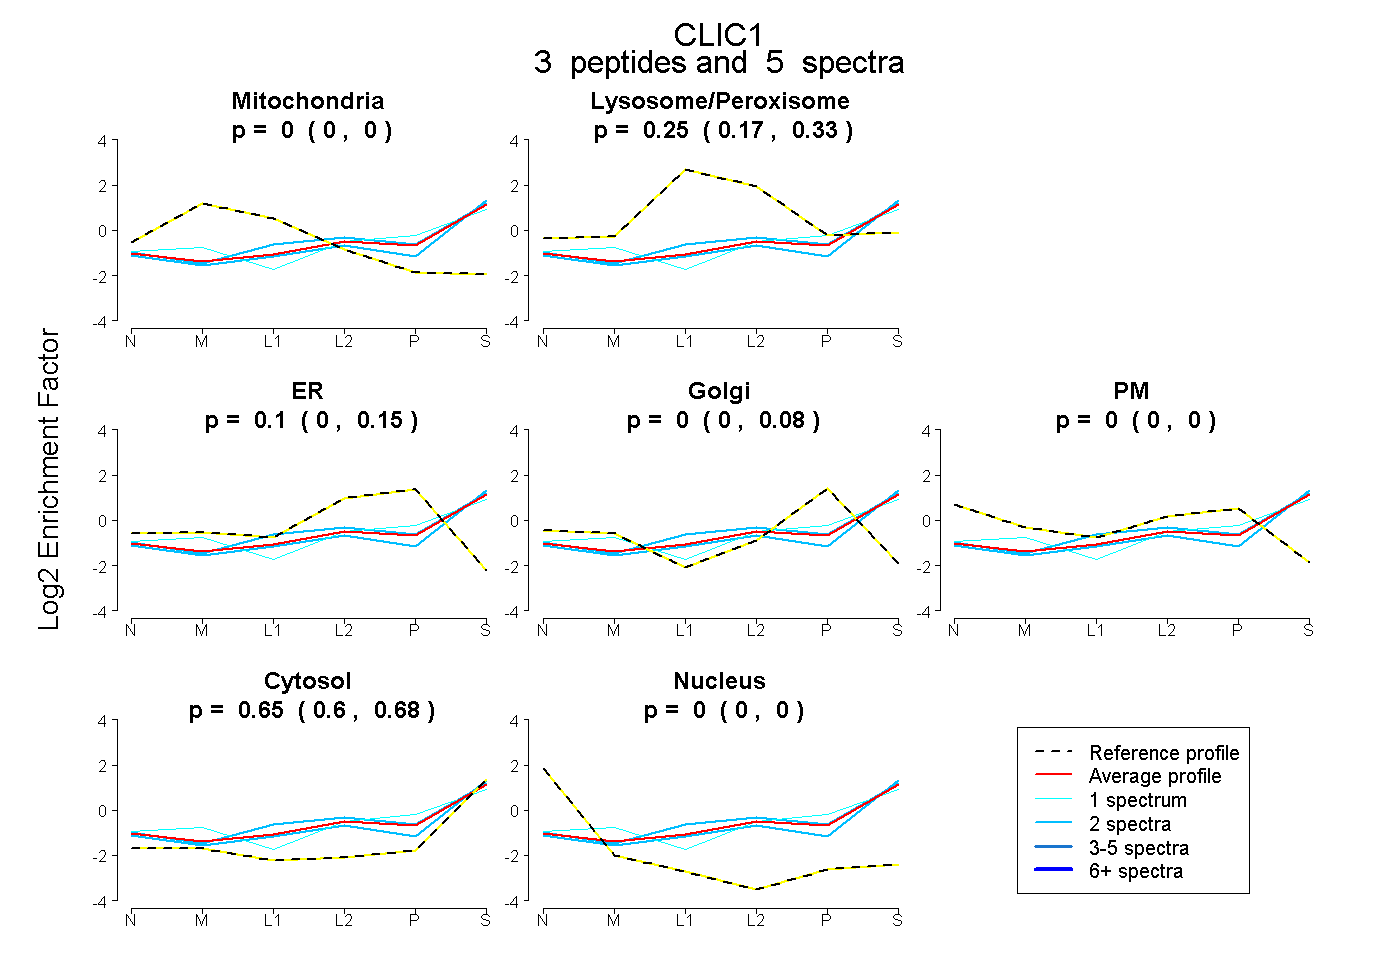 |
0.000
0.000 | 0.000 |
|
0.251
0.166 | 0.332 |
|
0.098
0.000 | 0.152 |
0.000
0.000 | 0.083 |
0.000
0.000 | 0.000 |
0.651
0.597 | 0.679 |
0.000
0.000 | 0.000 |
|
| 2 spectra, IGNCPFSQR |
0.000 |
|
0.259 |
|
0.007 |
0.000 |
0.000 |
0.734 |
0.000 |
|
| 1 spectrum, YLSNAYAR |
0.000 |
|
0.149 |
|
0.116 |
0.171 |
0.000 |
0.565 |
0.000 |
|
| 2 spectra, GFTIPEAFR |
0.000 |
|
0.341 |
|
0.051 |
0.000 |
0.000 |
0.608 |
0.000 |
|
| | | Plot |
|
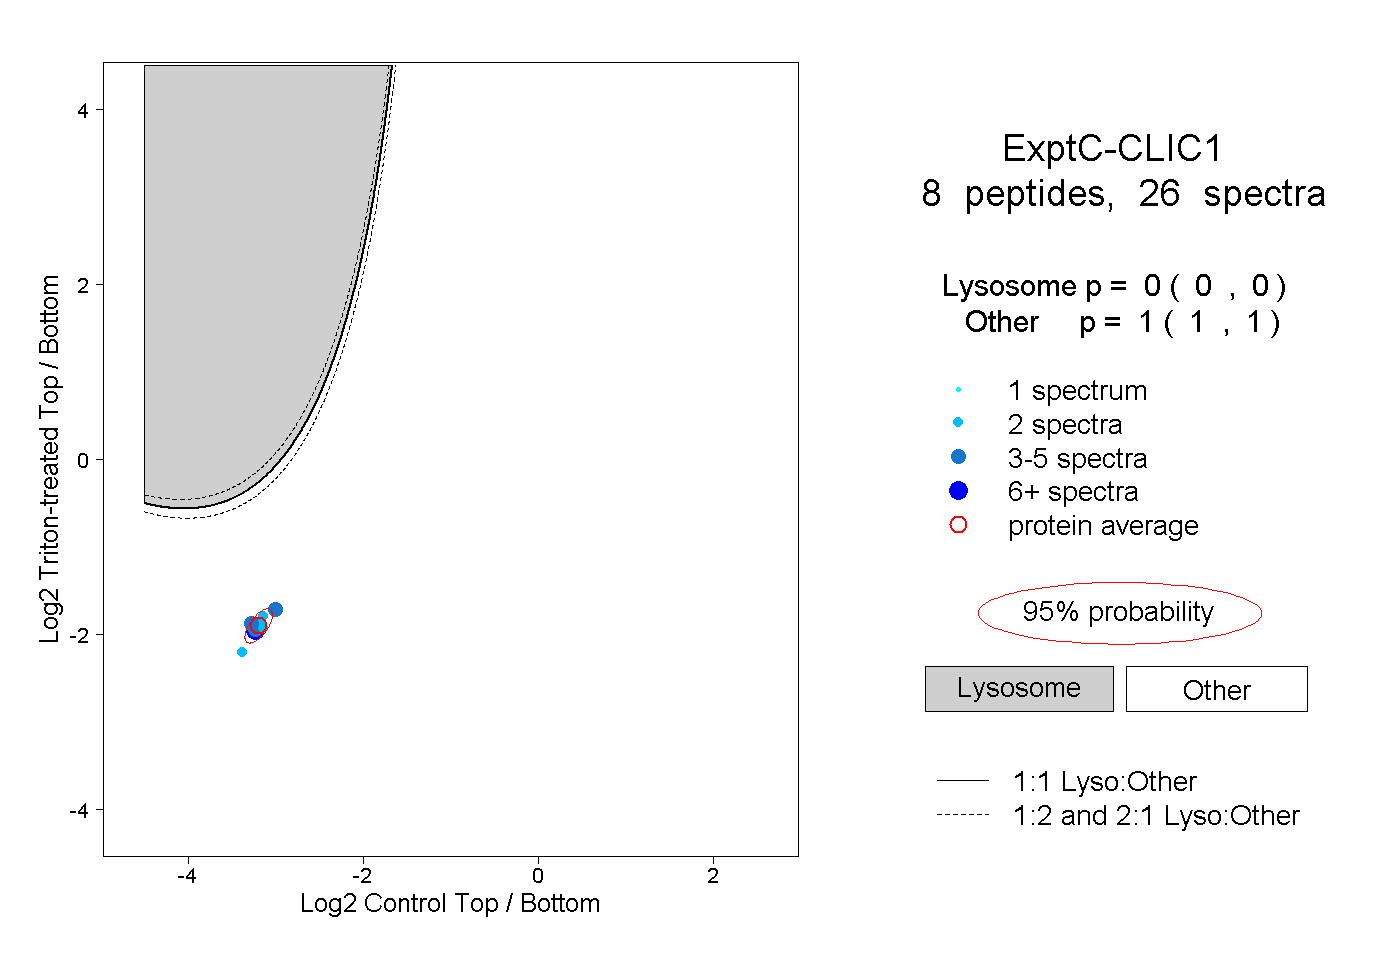
Lyso |
|
|
|
|
|
|
|
Other |
| Expt C |
8
peptides |
26
spectra |
 |
|
0.000
0.000 | 0.000 |
|
|
|
|
|
|
|
1.000
1.000 | 1.000 |
| | | Plot |
|
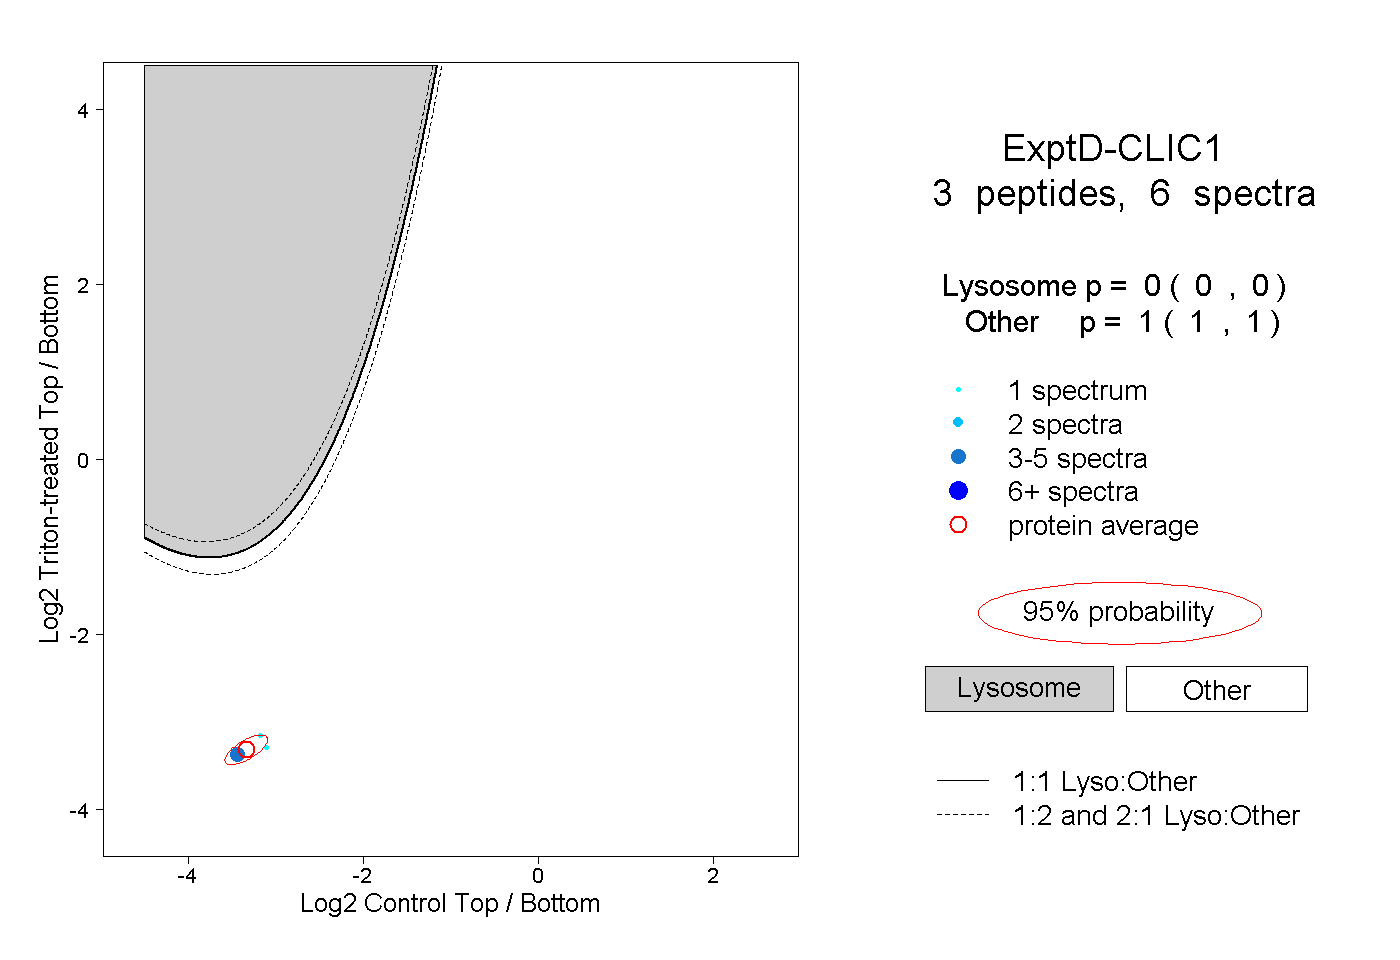
Lyso |
|
|
|
|
|
|
|
Other |
| Expt D |
3
peptides |
6
spectra |
 |
|
0.000
0.000 | 0.000 |
|
|
|
|
|
|
|
1.000
1.000 | 1.000 |