 9
9peptides
spectra
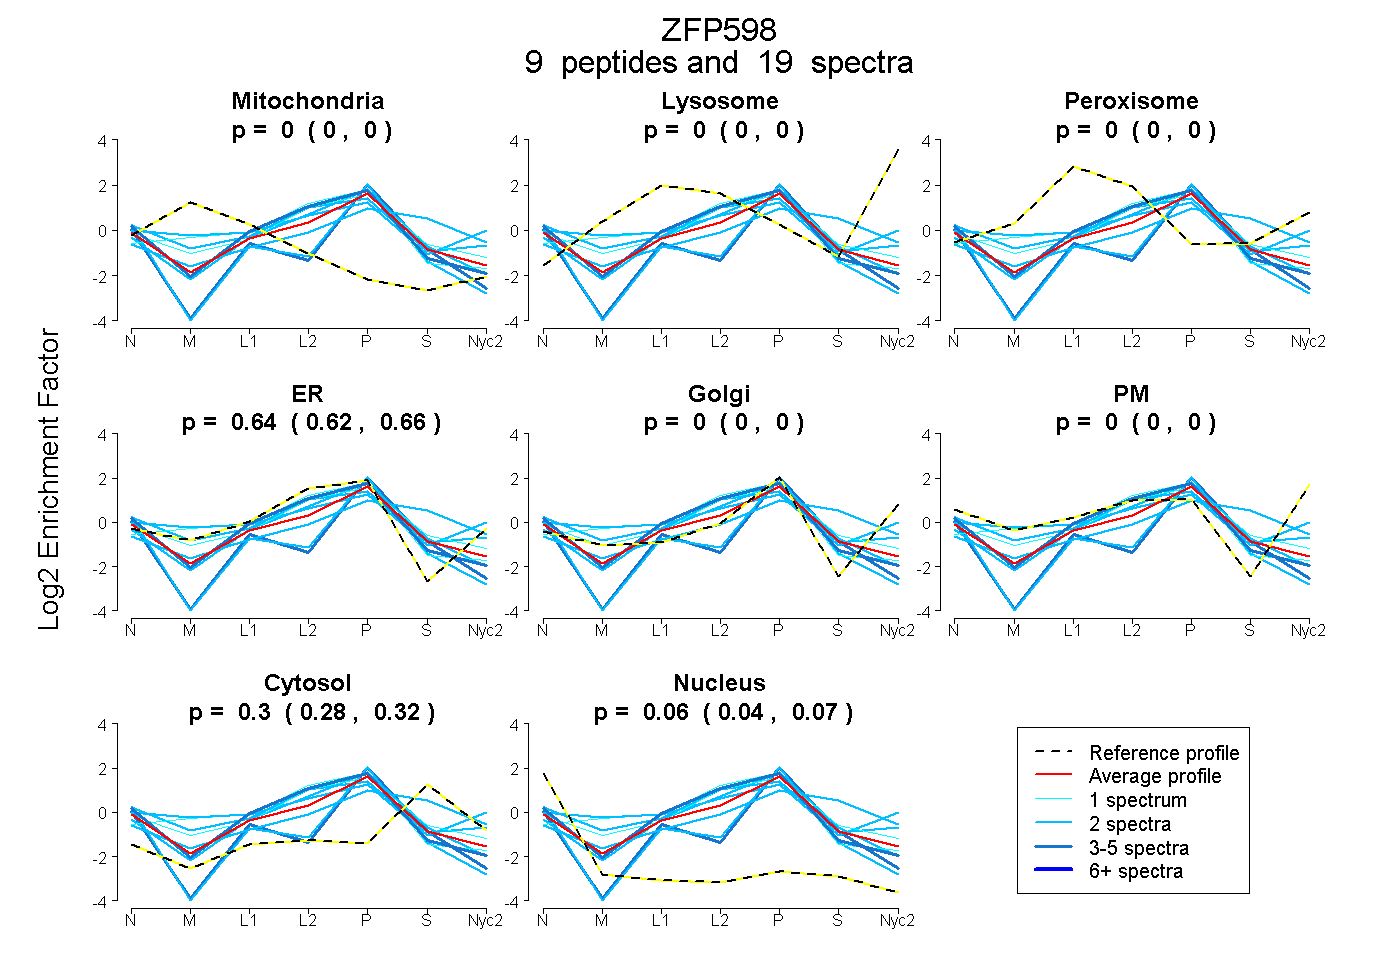
0.000 | 0.000
0.000 | 0.000
0.000 | 0.000
0.624 | 0.656
0.000 | 0.000
0.000 | 0.000
0.282 | 0.317
0.043 | 0.071
3peptides
spectra
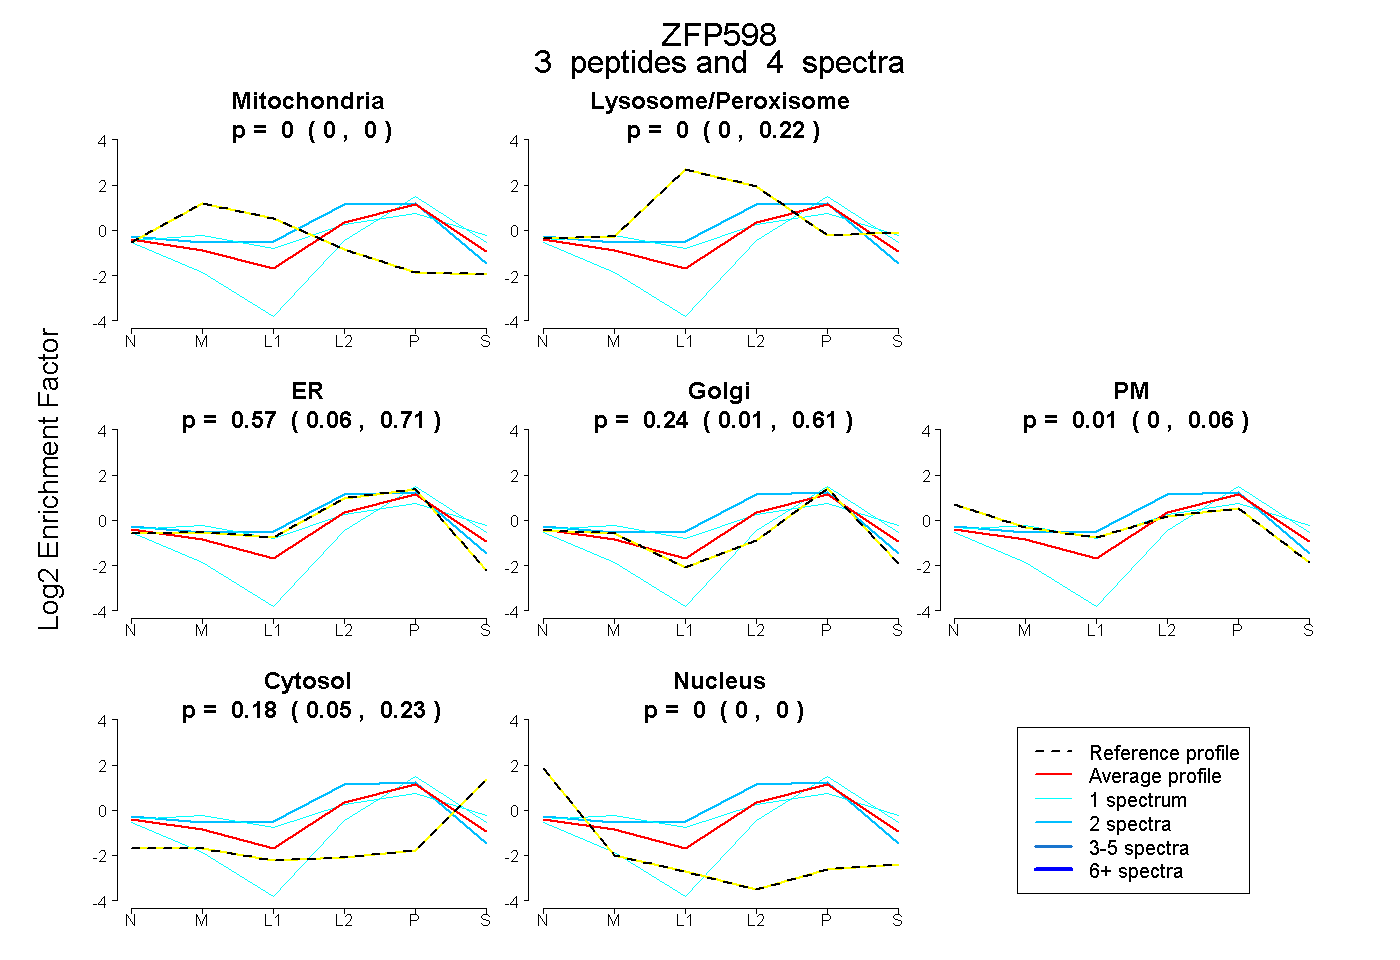
0.000 | 0.000
0.000 | 0.220
0.057 | 0.706
0.014 | 0.613
0.000 | 0.061
0.048 | 0.226
0.000 | 0.000
6peptides
spectra
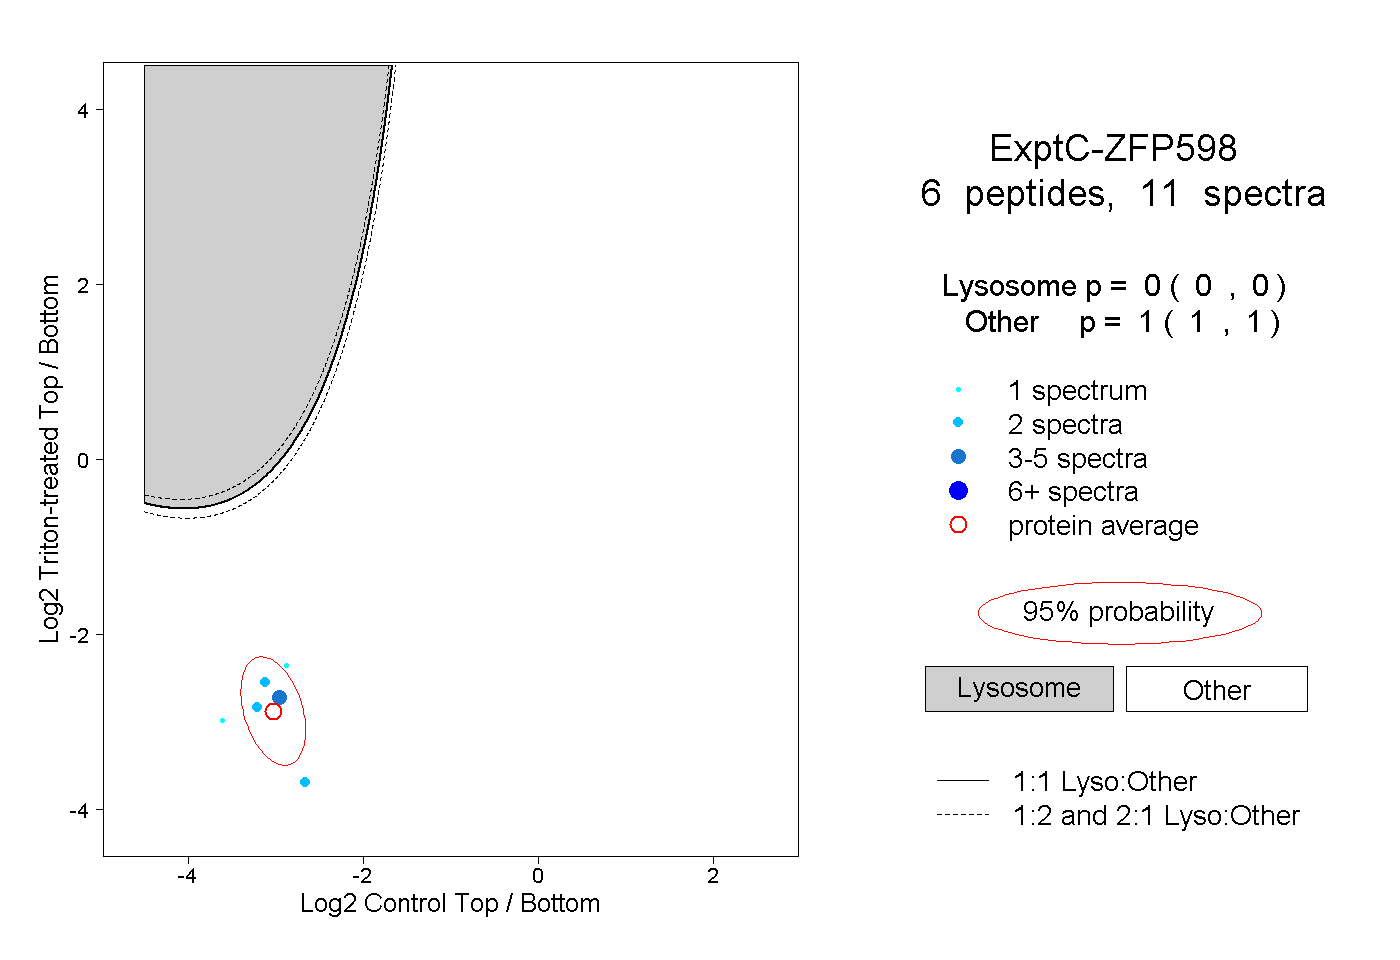
0.000 | 0.000
1.000 | 1.000