 9
9peptides
spectra
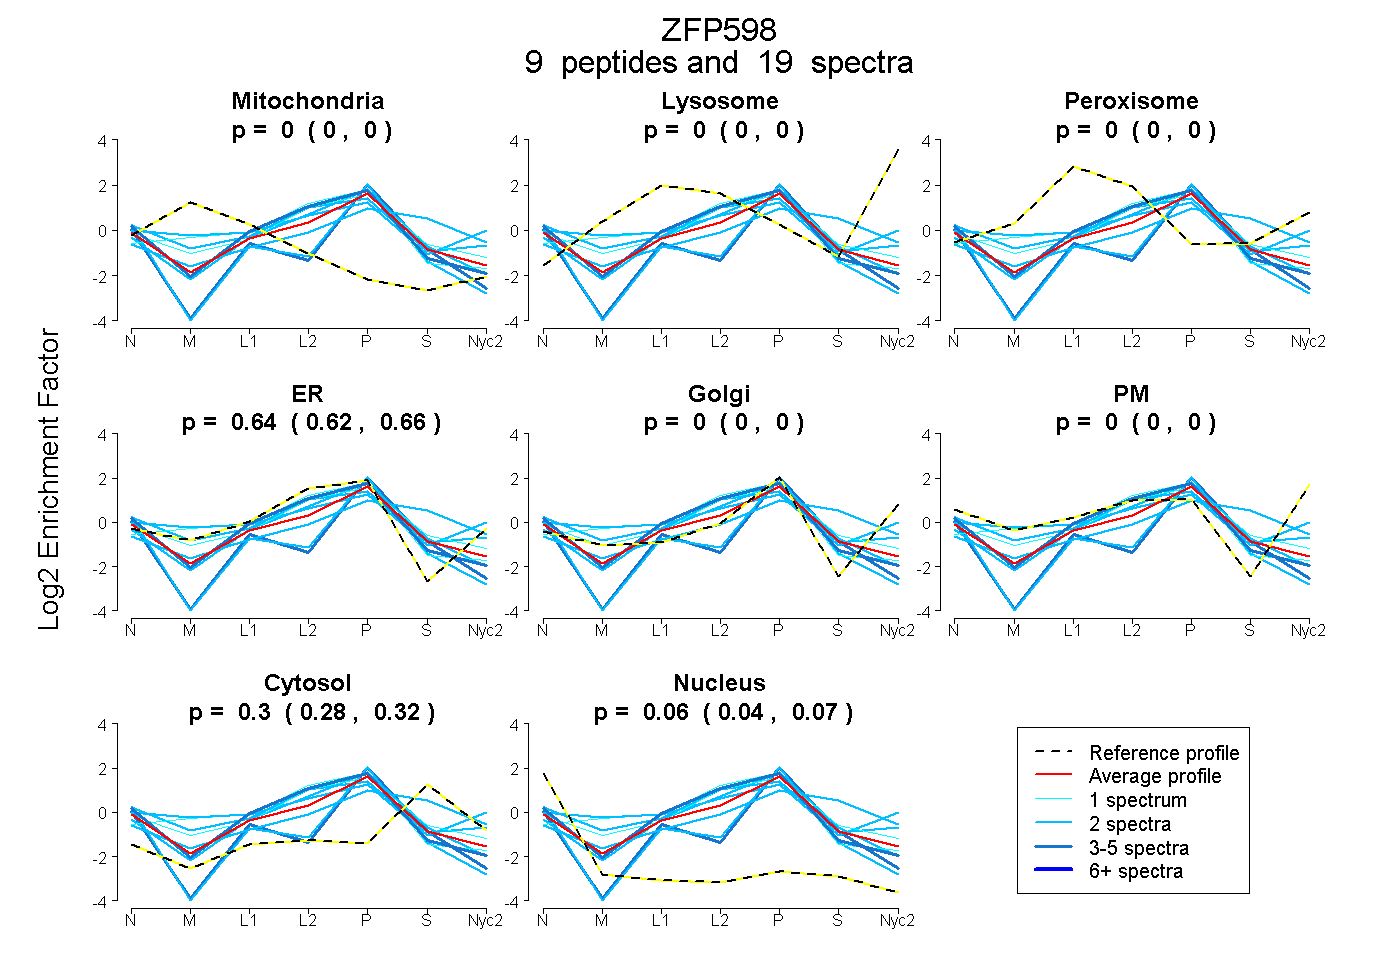
0.000 | 0.000
0.000 | 0.000
0.000 | 0.000
0.624 | 0.656
0.000 | 0.000
0.000 | 0.000
0.282 | 0.317
0.043 | 0.071
| Plot | Mito | Lyso | Perox | ER | Golgi | PM | Cytosol | Nucleus | |||||
| Expt A |
9 peptides |
19 spectra |
|
0.000 0.000 | 0.000 |
0.000 0.000 | 0.000 |
0.000 0.000 | 0.000 |
0.641 0.624 | 0.656 |
0.000 0.000 | 0.000 |
0.000 0.000 | 0.000 |
0.301 0.282 | 0.317 |
0.058 0.043 | 0.071 |
| 2 spectra, LPAFAMIPIHQLQHEK | 0.000 | 0.000 | 0.000 | 0.645 | 0.000 | 0.000 | 0.323 | 0.032 | ||
| 4 spectra, YLDNDELLK | 0.000 | 0.000 | 0.000 | 0.744 | 0.000 | 0.000 | 0.177 | 0.080 | ||
| 2 spectra, SHSGEFR | 0.000 | 0.000 | 0.014 | 0.331 | 0.106 | 0.000 | 0.550 | 0.000 | ||
| 2 spectra, IFTHER | 0.000 | 0.000 | 0.057 | 0.710 | 0.000 | 0.000 | 0.233 | 0.000 | ||
| 2 spectra, QLLQHECPR | 0.032 | 0.000 | 0.175 | 0.305 | 0.266 | 0.081 | 0.141 | 0.000 | ||
| 1 spectrum, VFALYR | 0.000 | 0.000 | 0.000 | 0.707 | 0.000 | 0.000 | 0.293 | 0.000 | ||
| 3 spectra, AALEAVAAPER | 0.000 | 0.000 | 0.000 | 0.380 | 0.056 | 0.000 | 0.323 | 0.242 | ||
| 2 spectra, ASVAAQQQEETQR | 0.000 | 0.000 | 0.000 | 0.477 | 0.000 | 0.000 | 0.206 | 0.317 | ||
| 1 spectrum, MQGDPDDTSHR | 0.093 | 0.000 | 0.000 | 0.790 | 0.000 | 0.000 | 0.117 | 0.000 |
| Plot | Mito | Lyso or Perox | ER | Golgi | PM | Cytosol | Nucleus | ||||||
| Expt B |
3 peptides |
4 spectra |
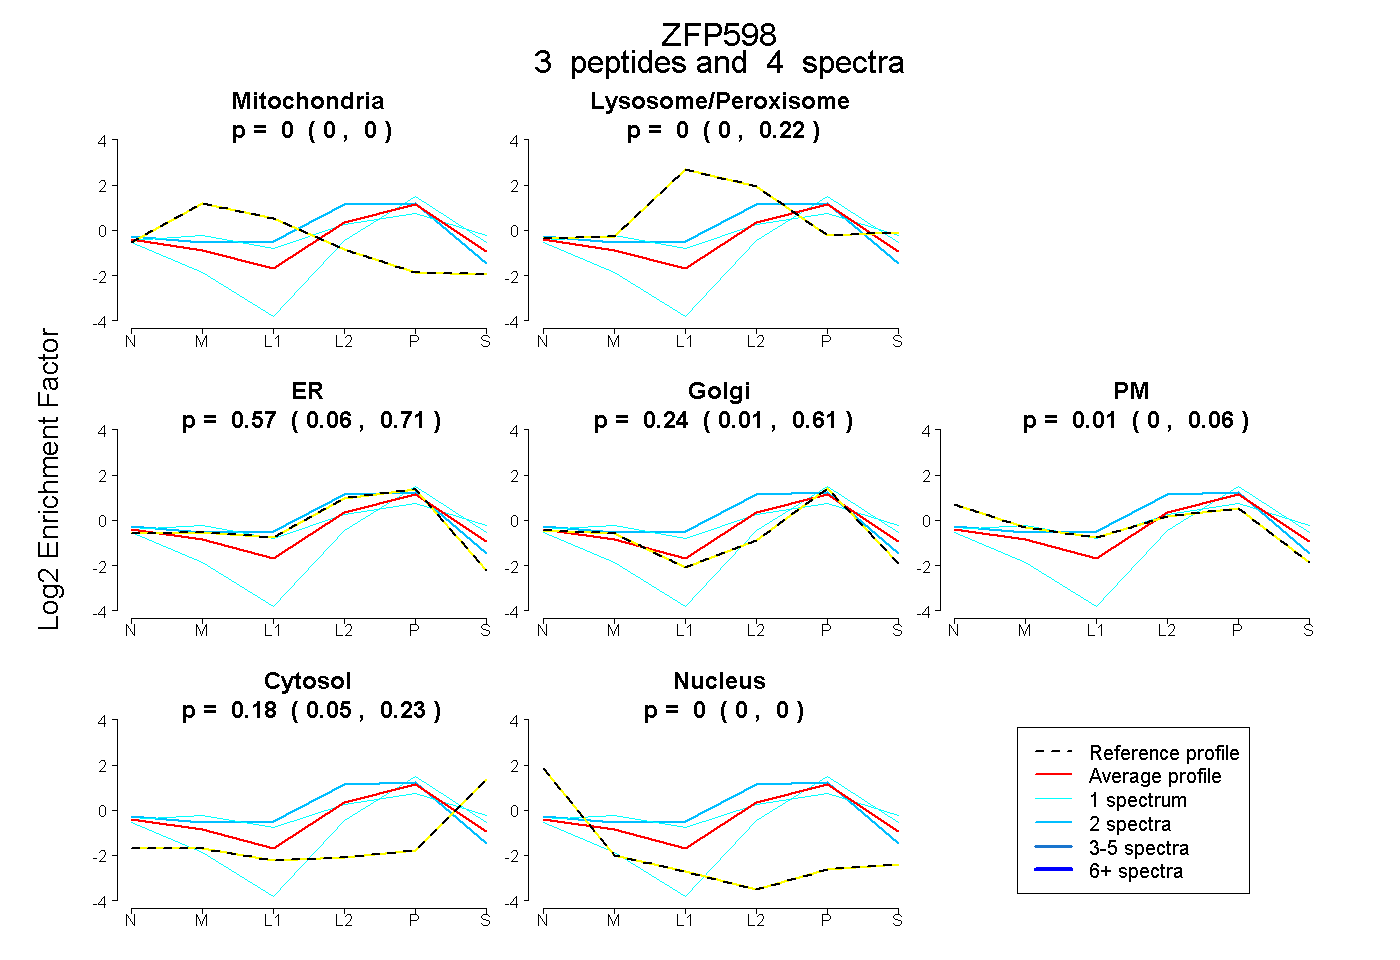 |
0.000 0.000 | 0.000 |
0.000 0.000 | 0.220 |
0.569 0.057 | 0.706 |
0.243 0.014 | 0.613 |
0.006 0.000 | 0.061 |
0.182 0.048 | 0.226 |
0.000 0.000 | 0.000 |
|||
| Plot | Lyso | Other | |||||||||||
| Expt C |
6 peptides |
11 spectra |
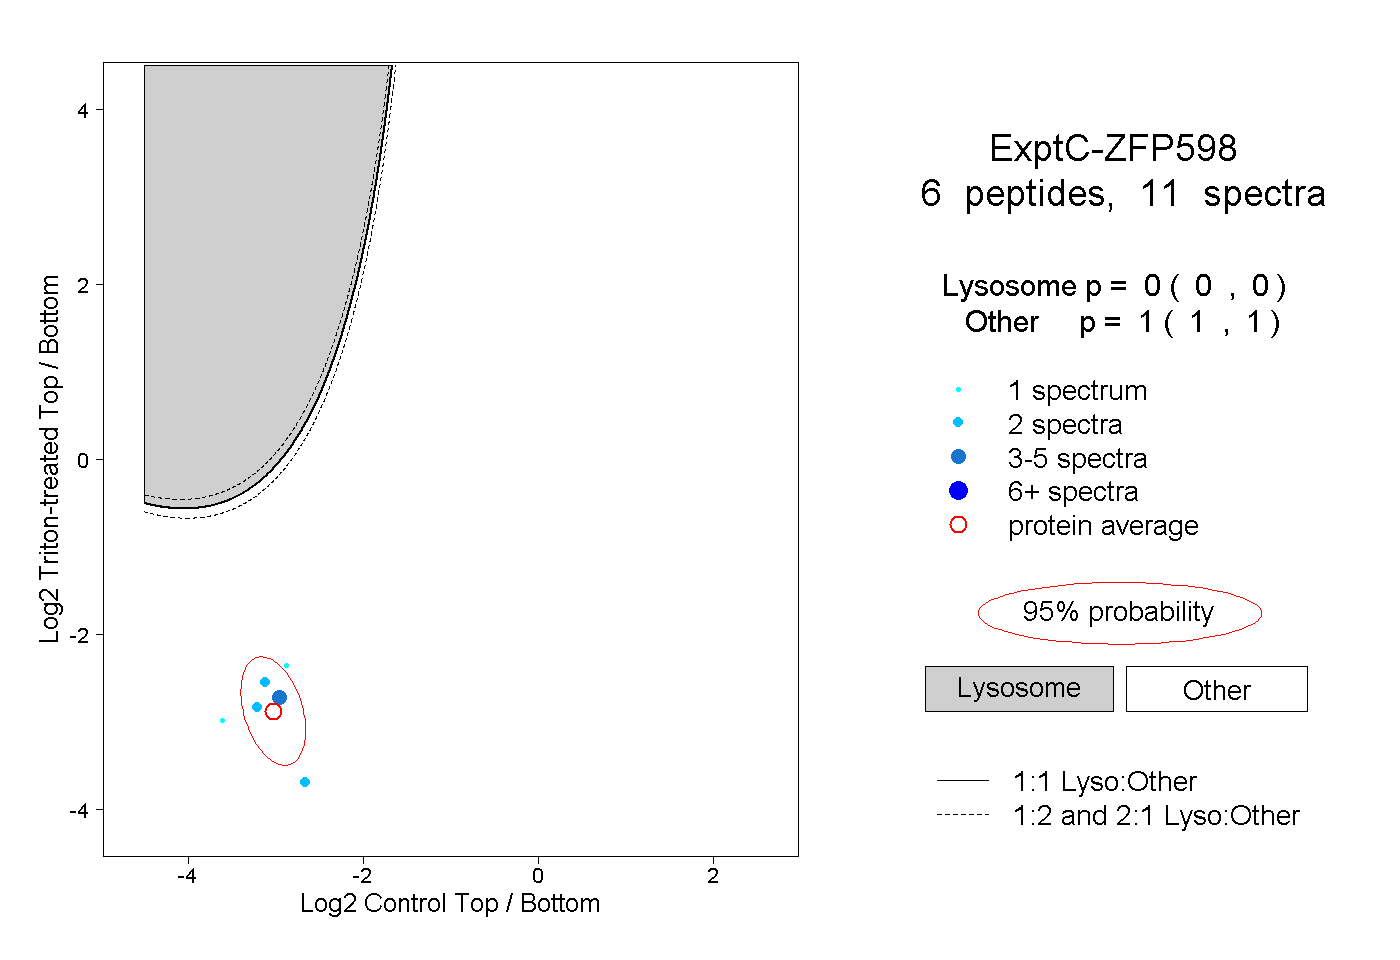 |
0.000 0.000 | 0.000 |
1.000 1.000 | 1.000 |