ZFP598
[ENSRNOP00000060223]
Main page
| | | Plot |
Mito |
Lyso |
|
Perox |
ER |
Golgi |
PM |
Cytosol |
Nucleus |
|
| Expt A |
 9
9
peptides |
19
spectra |
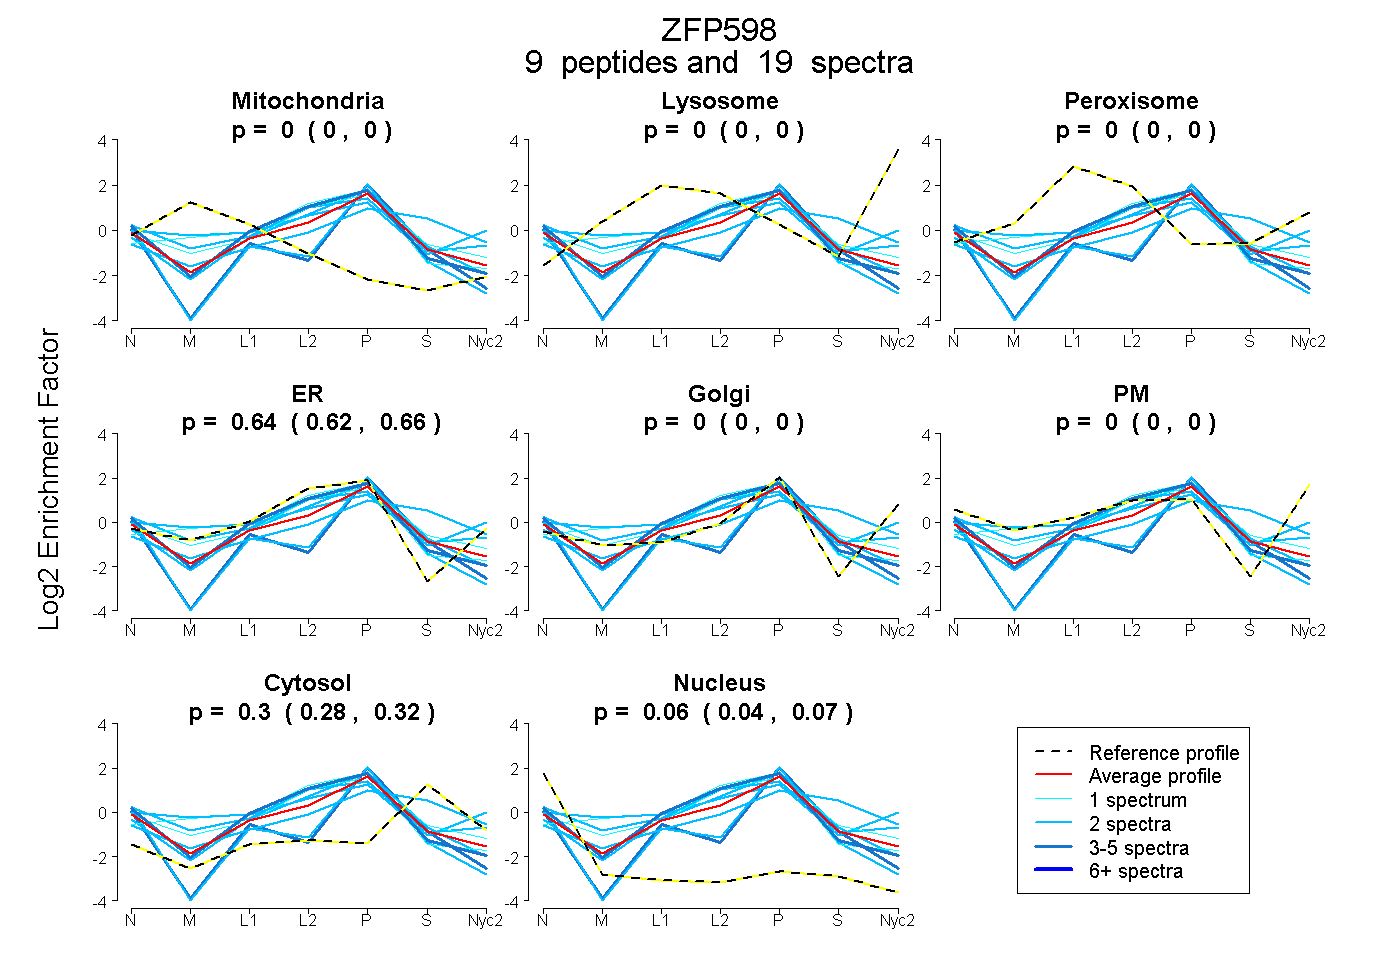 |
0.000
0.000 | 0.000 |
0.000
0.000 | 0.000 |
|
0.000
0.000 | 0.000 |
0.641
0.624 | 0.656 |
0.000
0.000 | 0.000 |
0.000
0.000 | 0.000 |
0.301
0.282 | 0.317 |
0.058
0.043 | 0.071 |
|
| | | Plot |
Mito |
|
Lyso or Perox |
|
ER |
Golgi |
PM |
Cytosol |
Nucleus |
|
| Expt B |
3
peptides |
4
spectra |
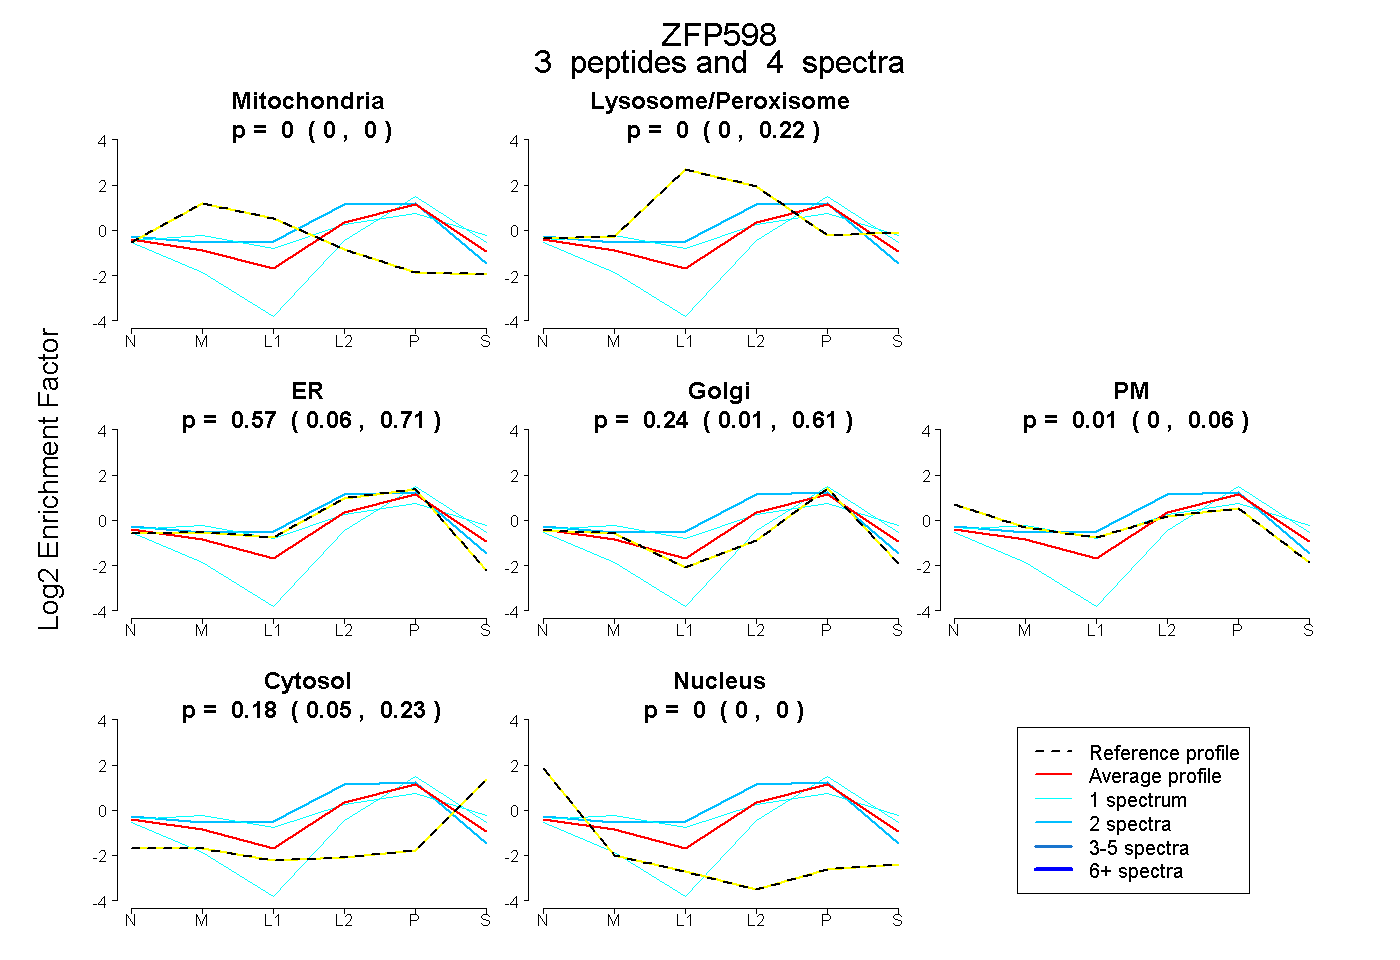 |
0.000
0.000 | 0.000 |
|
0.000
0.000 | 0.220 |
|
0.569
0.057 | 0.706 |
0.243
0.014 | 0.613 |
0.006
0.000 | 0.061 |
0.182
0.048 | 0.226 |
0.000
0.000 | 0.000 |
|
| 1 spectrum, YLDNDELLK |
0.000 |
|
0.347 |
|
0.000 |
0.514 |
0.000 |
0.138 |
0.000 |
|
| 2 spectra, VFALYR |
0.000 |
|
0.137 |
|
0.735 |
0.000 |
0.106 |
0.022 |
0.000 |
|
| 1 spectrum, DDDFPSLQAIAR |
0.000 |
|
0.000 |
|
0.000 |
0.782 |
0.000 |
0.218 |
0.000 |
|
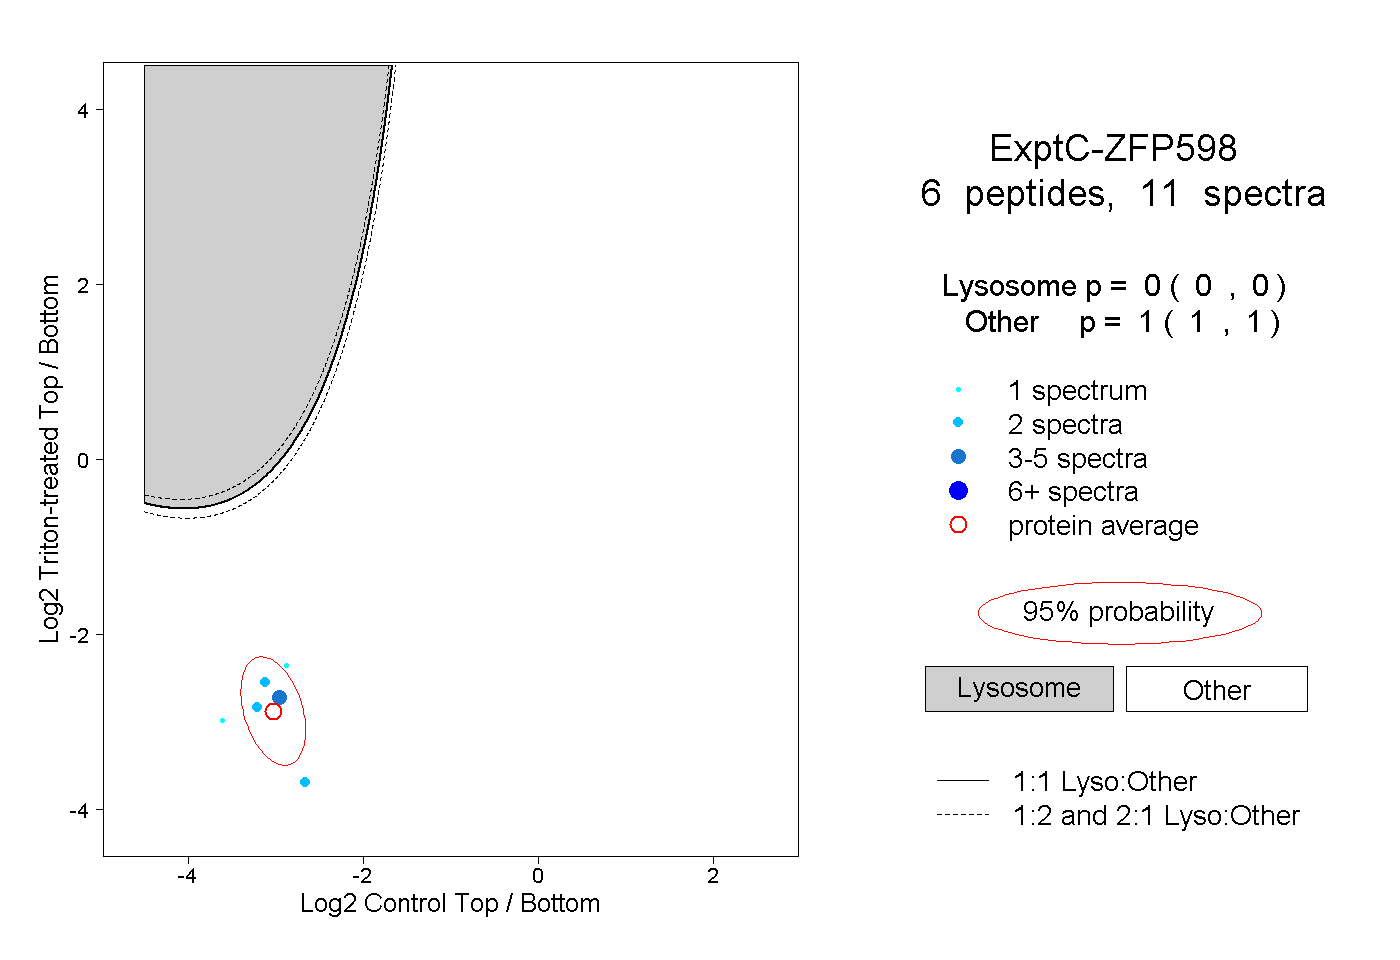
| | | Plot |
|
Lyso |
|
|
|
|
|
|
|
Other |
| Expt C |
6
peptides |
11
spectra |
 |
|
0.000
0.000 | 0.000 |
|
|
|
|
|
|
|
1.000
1.000 | 1.000 |