 10
10peptides
spectra
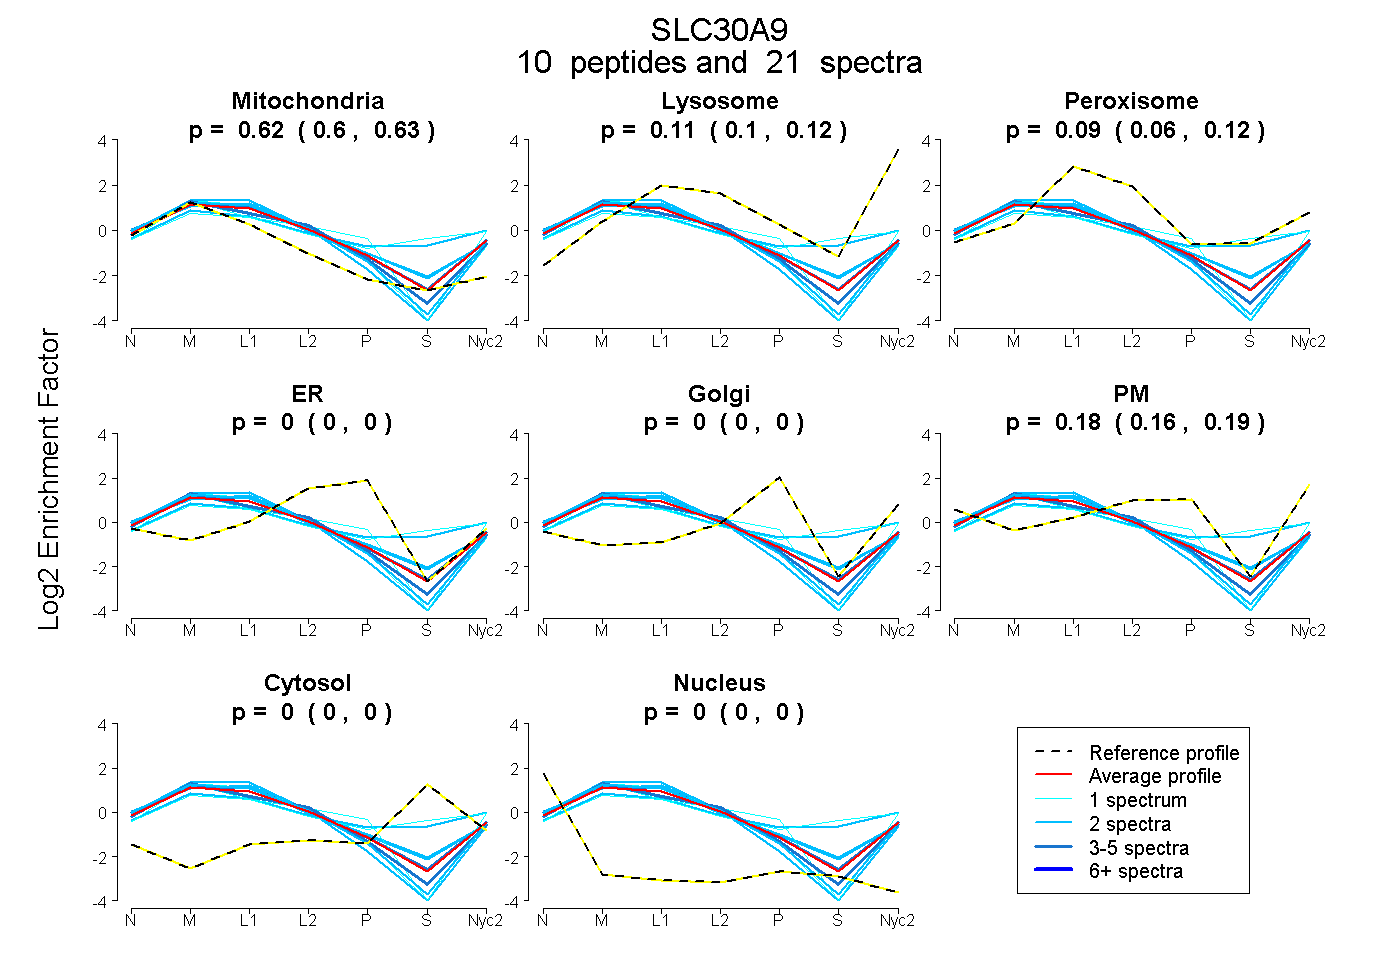
0.604 | 0.626
0.101 | 0.125
0.062 | 0.122
0.000 | 0.000
0.000 | 0.000
0.157 | 0.190
0.000 | 0.000
0.000 | 0.000
5peptides
spectra
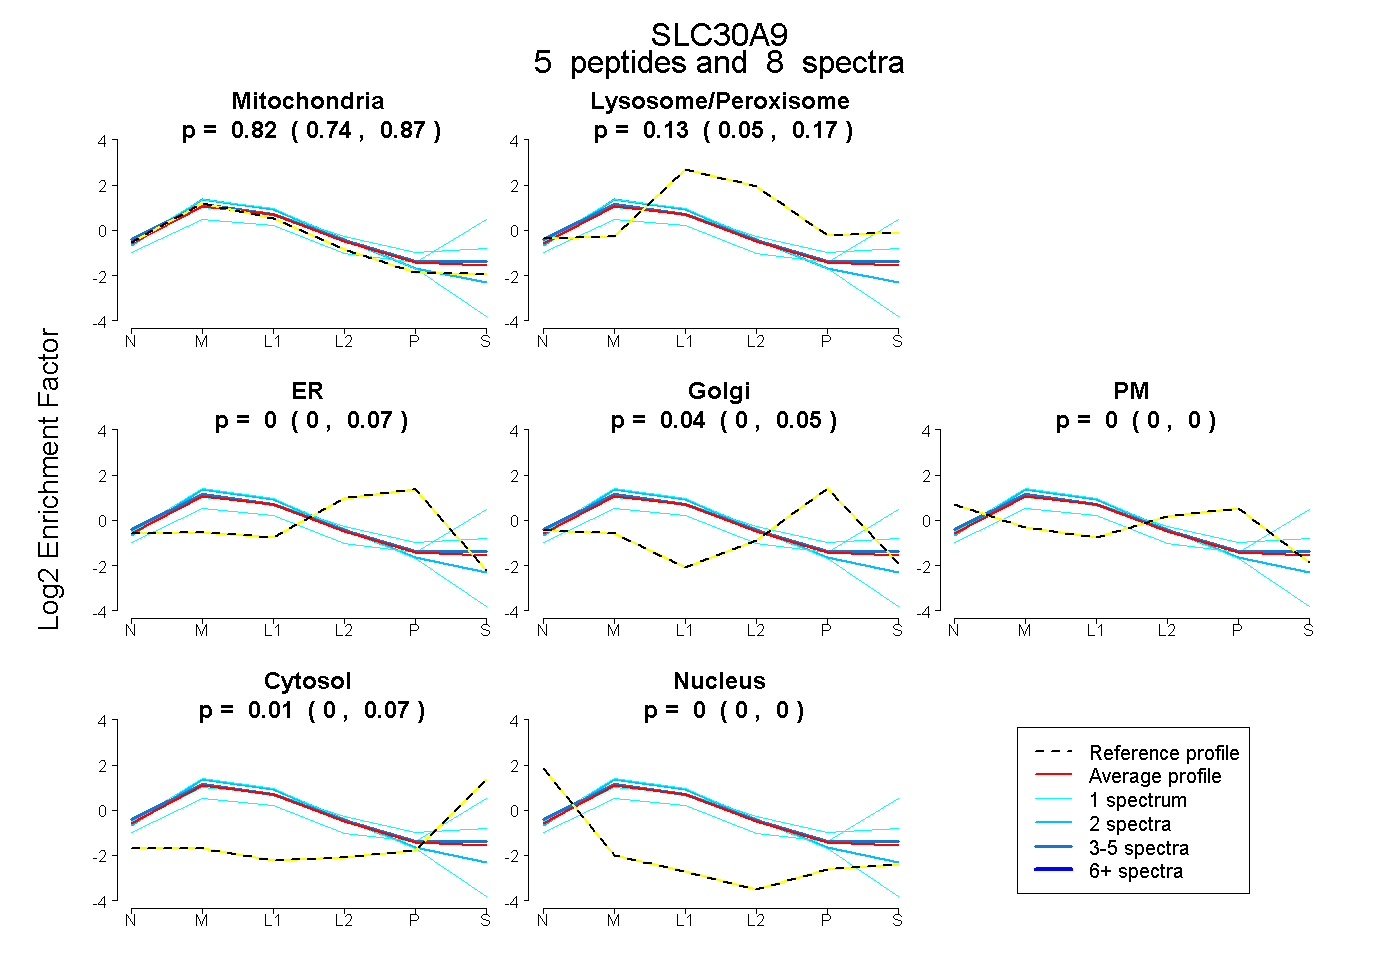
0.740 | 0.868
0.055 | 0.173
0.000 | 0.075
0.000 | 0.048
0.000 | 0.000
0.000 | 0.067
0.000 | 0.000
17peptides
spectra
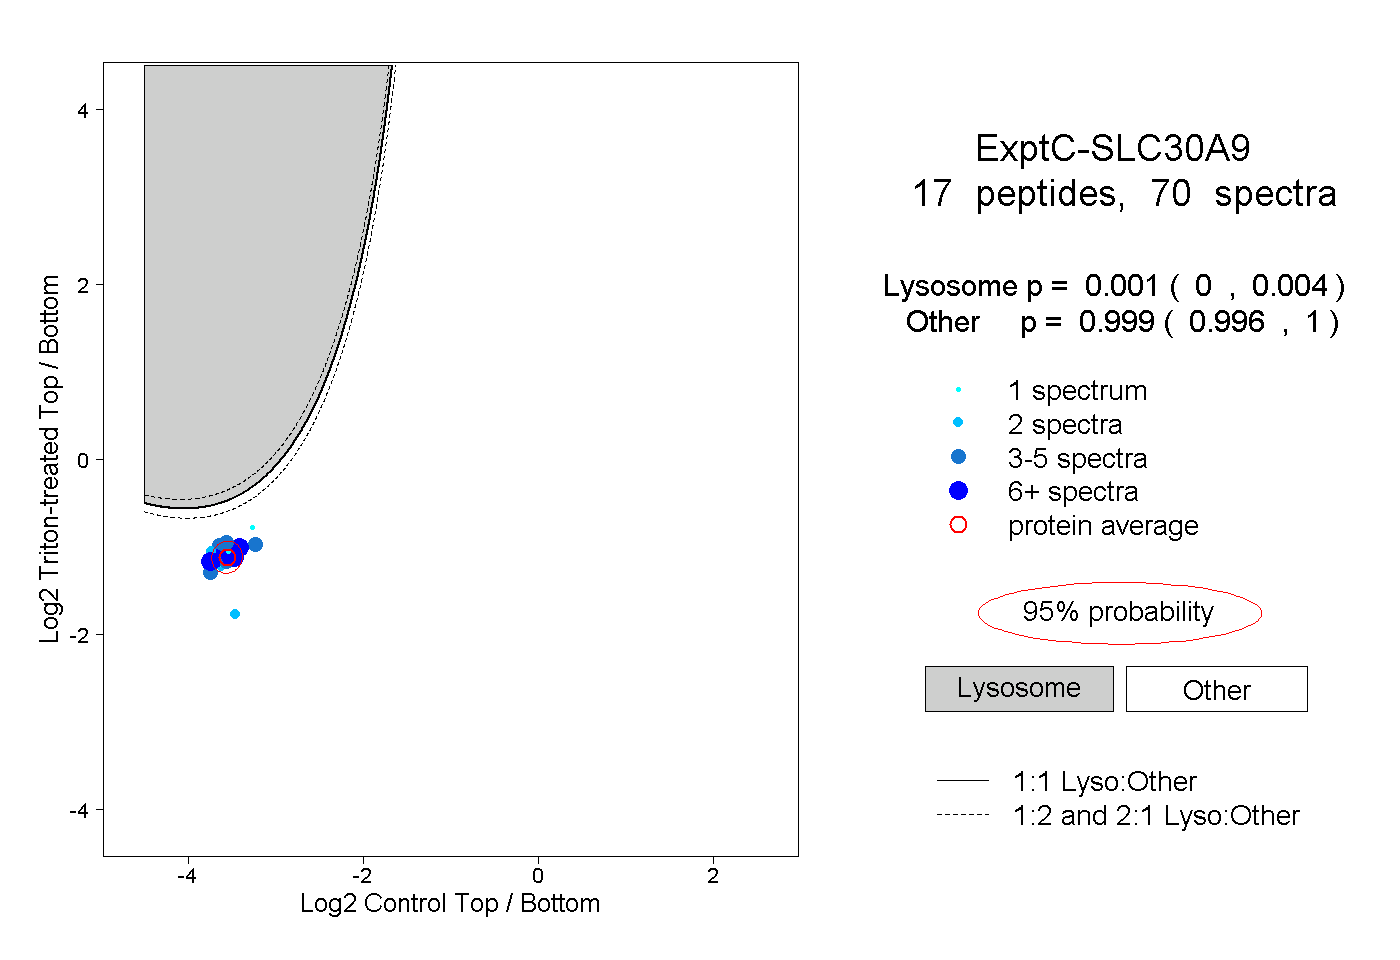
0.000 | 0.004
0.996 | 1.000
4peptides
spectra
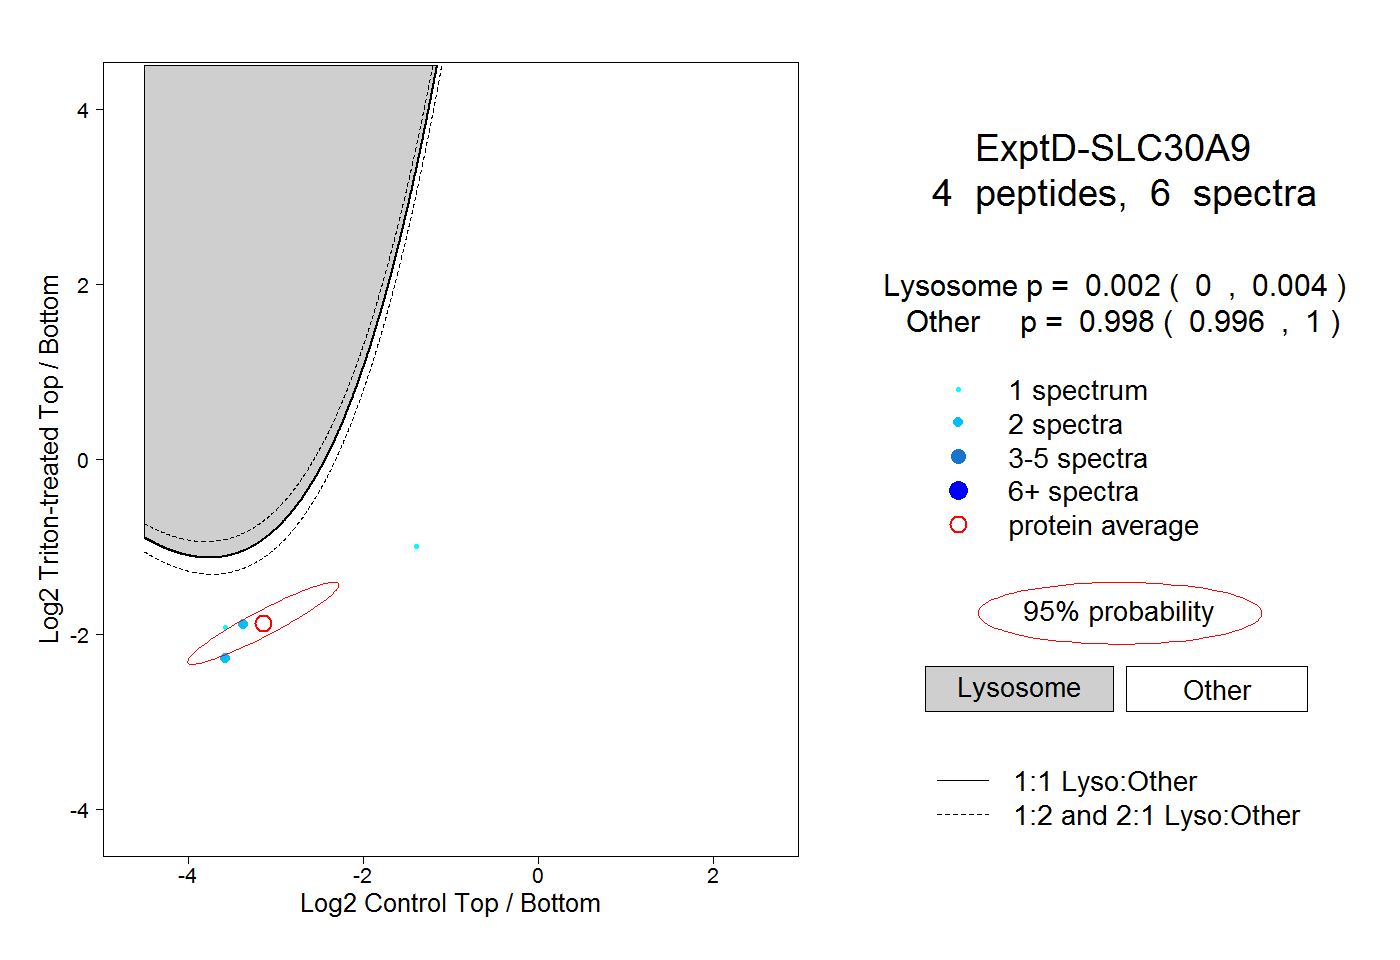
0.000 | 0.004
0.996 | 1.000