 10
10peptides
spectra
0.604 | 0.626
0.101 | 0.125
0.062 | 0.122
0.000 | 0.000
0.000 | 0.000
0.157 | 0.190
0.000 | 0.000
0.000 | 0.000
| Plot | Mito | Lyso | Perox | ER | Golgi | PM | Cytosol | Nucleus | |||||
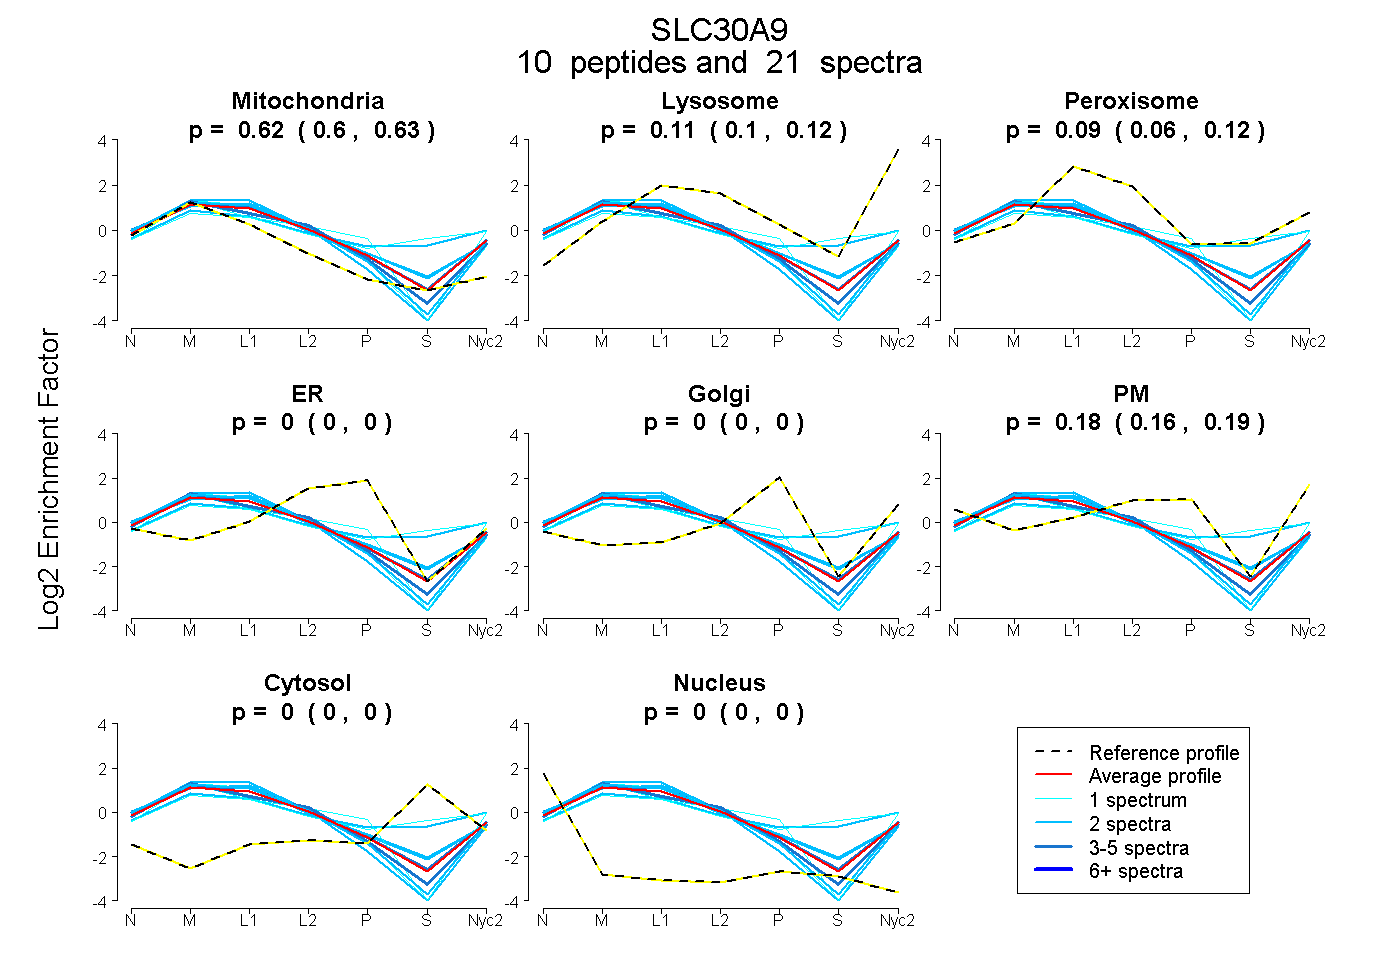
| Expt A |
10 peptides |
21 spectra |
|
0.616 0.604 | 0.626 |
0.114 0.101 | 0.125 |
0.094 0.062 | 0.122 |
0.000 0.000 | 0.000 |
0.000 0.000 | 0.000 |
0.176 0.157 | 0.190 |
0.000 0.000 | 0.000 |
0.000 0.000 | 0.000 |
| 4 spectra, EAEIEYR | 0.600 | 0.079 | 0.149 | 0.000 | 0.000 | 0.172 | 0.000 | 0.000 | ||
| 2 spectra, GGQGSQTPR | 0.743 | 0.138 | 0.000 | 0.000 | 0.000 | 0.119 | 0.000 | 0.000 | ||
| 2 spectra, EYGDFLGNTKPR | 0.574 | 0.049 | 0.248 | 0.000 | 0.000 | 0.129 | 0.000 | 0.000 | ||
| 2 spectra, AEVDFDGR | 0.383 | 0.173 | 0.205 | 0.000 | 0.011 | 0.055 | 0.173 | 0.000 | ||
| 4 spectra, LTELLESDPSVR | 0.675 | 0.128 | 0.000 | 0.010 | 0.000 | 0.186 | 0.000 | 0.000 | ||
| 2 spectra, AINEFCLK | 0.543 | 0.000 | 0.290 | 0.000 | 0.000 | 0.167 | 0.000 | 0.000 | ||
| 1 spectrum, QDPLQVR | 0.350 | 0.164 | 0.232 | 0.000 | 0.000 | 0.027 | 0.228 | 0.000 | ||
| 1 spectrum, ALEVWGSLEALAR | 0.706 | 0.078 | 0.000 | 0.000 | 0.000 | 0.217 | 0.000 | 0.000 | ||
| 1 spectrum, HGENIIDTLGAEVDR | 0.517 | 0.078 | 0.000 | 0.107 | 0.000 | 0.298 | 0.000 | 0.000 | ||
| 2 spectra, SIQPEQVQR | 0.683 | 0.114 | 0.000 | 0.000 | 0.000 | 0.203 | 0.000 | 0.000 |
| Plot | Mito | Lyso or Perox | ER | Golgi | PM | Cytosol | Nucleus | ||||||
| Expt B |
5 peptides |
8 spectra |
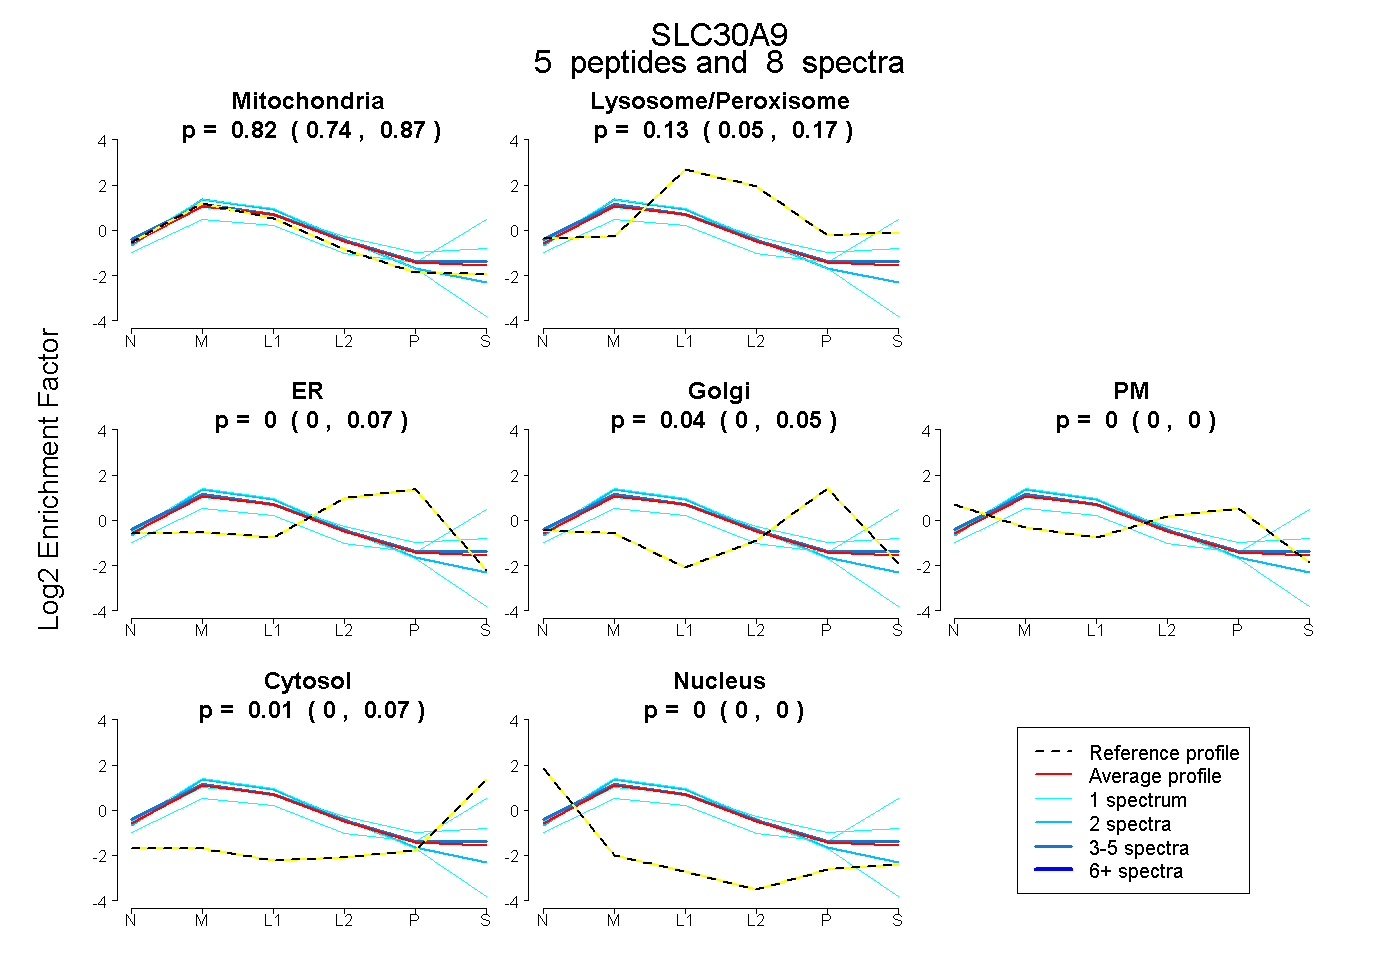 |
0.822 0.740 | 0.868 |
0.133 0.055 | 0.173 |
0.000 0.000 | 0.075 |
0.037 0.000 | 0.048 |
0.000 0.000 | 0.000 |
0.008 0.000 | 0.067 |
0.000 0.000 | 0.000 |
|||
| Plot | Lyso | Other | |||||||||||
| Expt C |
17 peptides |
70 spectra |
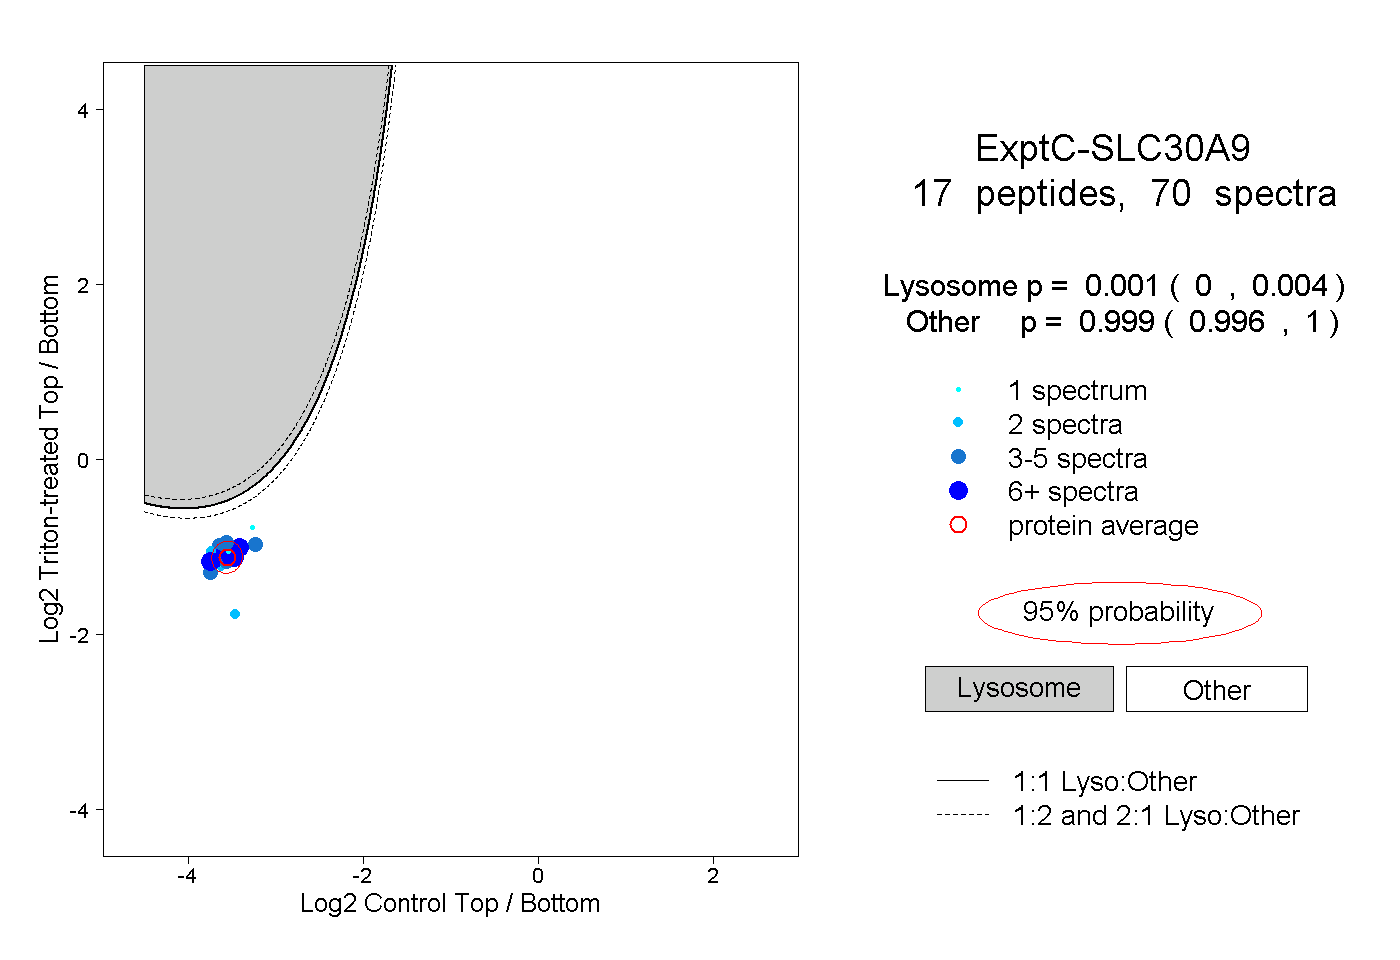 |
0.001 0.000 | 0.004 |
0.999 0.996 | 1.000 |
||||||||
| Plot | Lyso | Other | |||||||||||
| Expt D |
4 peptides |
6 spectra |
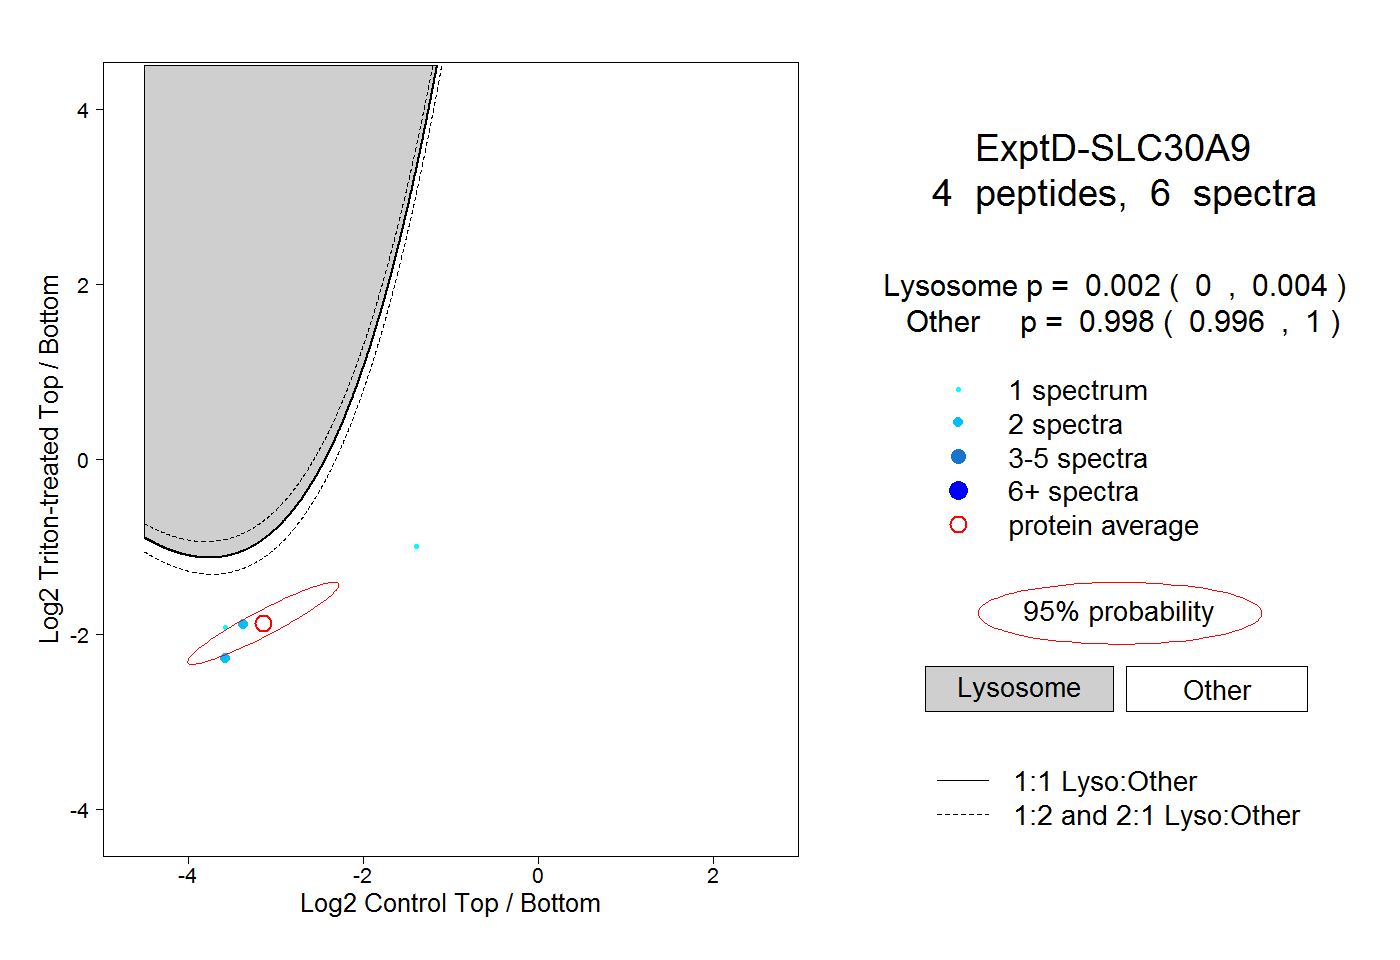 |
0.002 0.000 | 0.004 |
0.998 0.996 | 1.000 |