SLC30A9
[ENSRNOP00000059961]
Main page
| | | Plot |
Mito |
Lyso |
|
Perox |
ER |
Golgi |
PM |
Cytosol |
Nucleus |
|
| Expt A |
 10
10
peptides |
21
spectra |
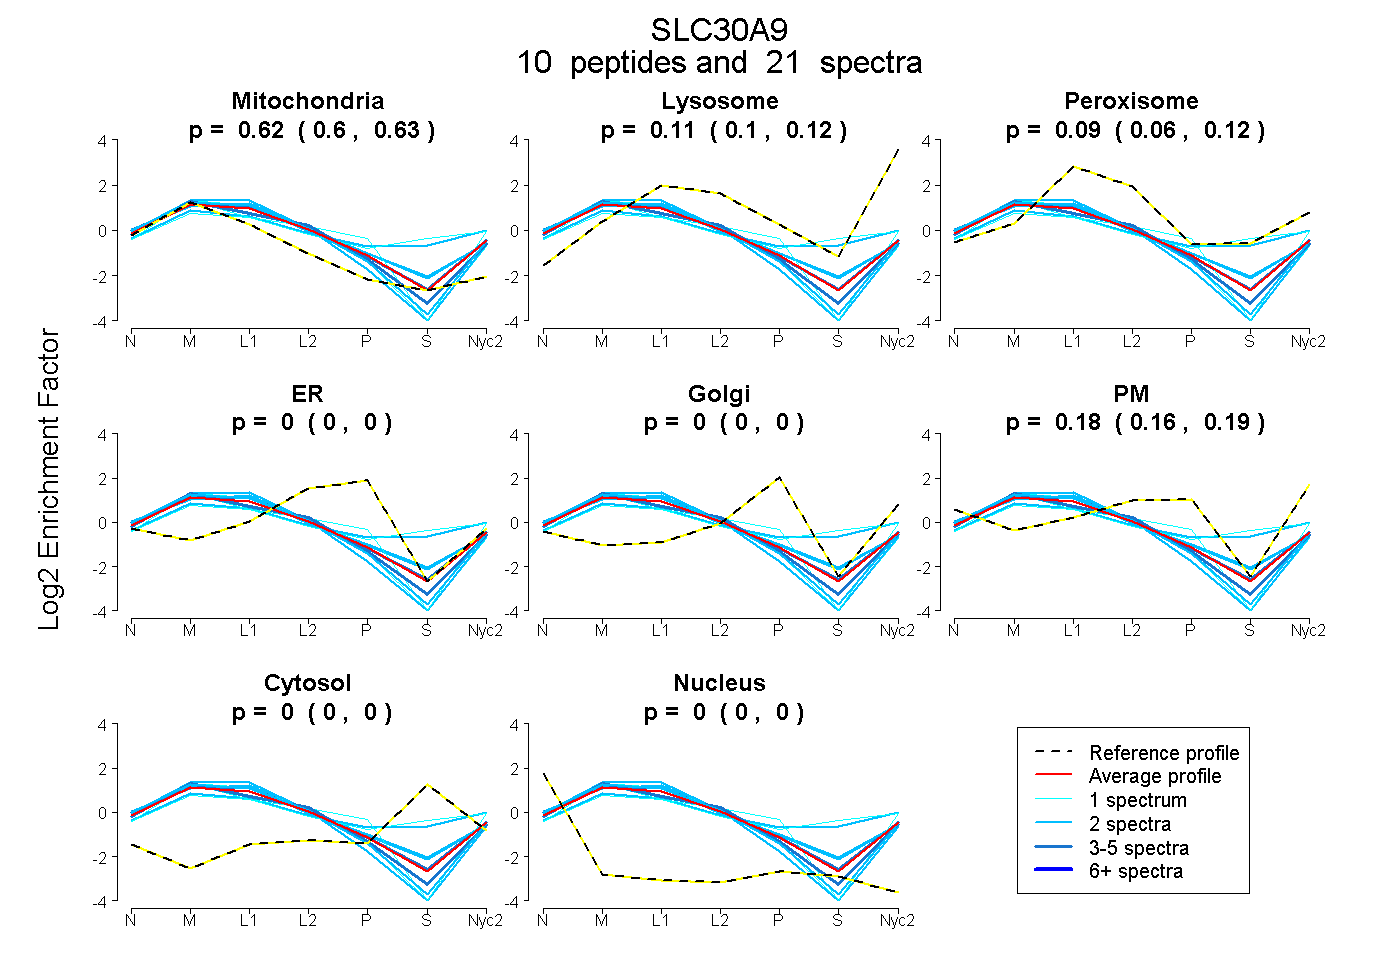 |
0.616
0.604 | 0.626 |
0.114
0.101 | 0.125 |
|
0.094
0.062 | 0.122 |
0.000
0.000 | 0.000 |
0.000
0.000 | 0.000 |
0.176
0.157 | 0.190 |
0.000
0.000 | 0.000 |
0.000
0.000 | 0.000 |
|
| | | Plot |
Mito |
|
Lyso or Perox |
|
ER |
Golgi |
PM |
Cytosol |
Nucleus |
|
| Expt B |
5
peptides |
8
spectra |
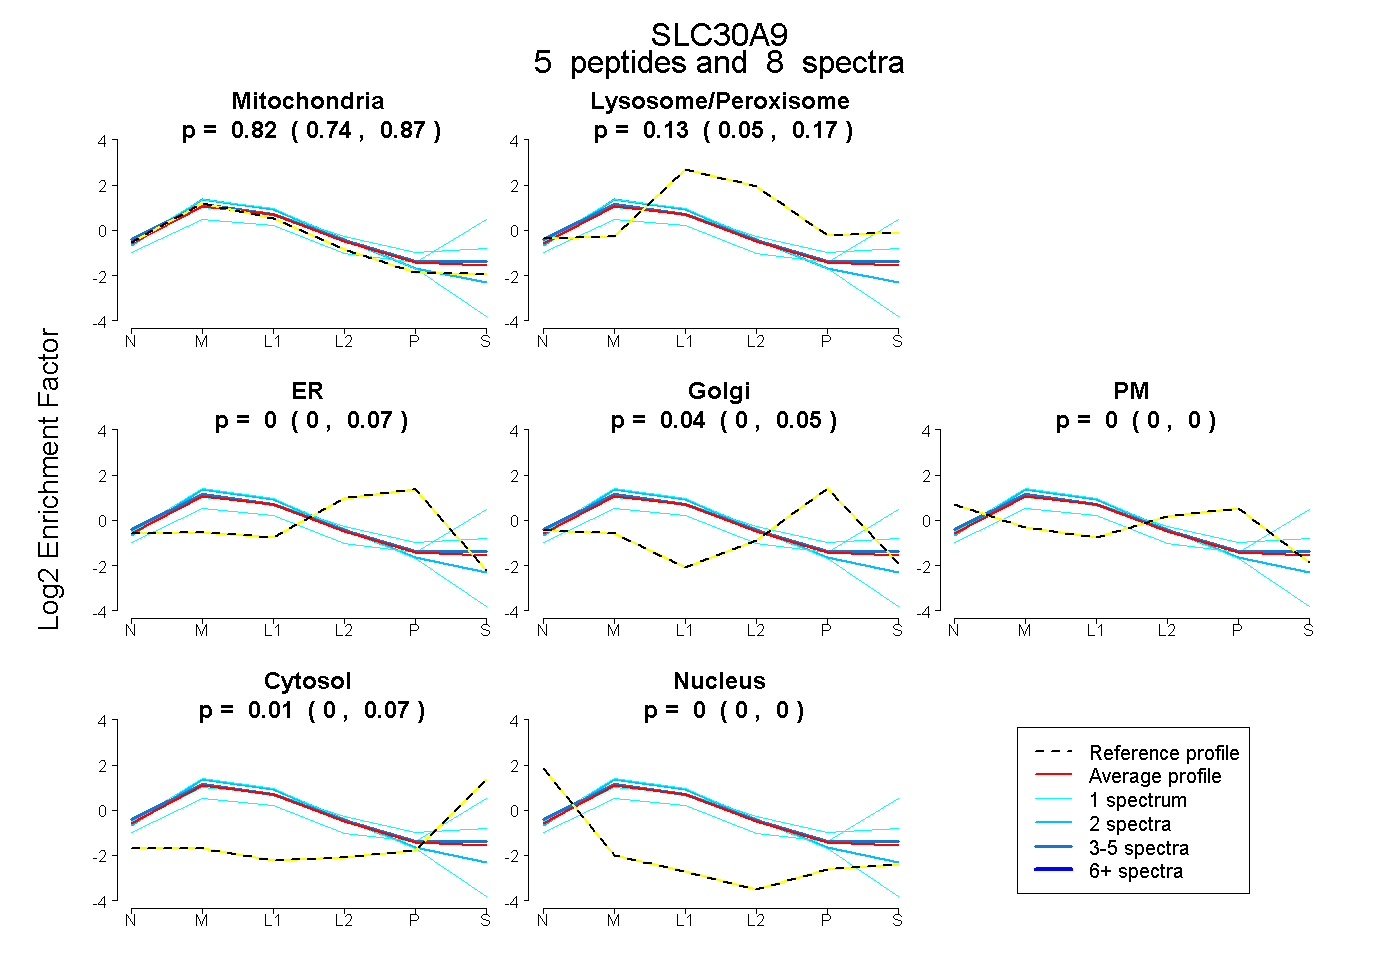 |
0.822
0.740 | 0.868 |
|
0.133
0.055 | 0.173 |
|
0.000
0.000 | 0.075 |
0.037
0.000 | 0.048 |
0.000
0.000 | 0.000 |
0.008
0.000 | 0.067 |
0.000
0.000 | 0.000 |
|
| 2 spectra, HVDLEIL |
0.925 |
|
0.064 |
|
0.011 |
0.000 |
0.000 |
0.000 |
0.000 |
|
| 1 spectrum, EAEIEYR |
0.600 |
|
0.271 |
|
0.000 |
0.055 |
0.000 |
0.074 |
0.000 |
|
| 1 spectrum, NNFITGVR |
0.389 |
|
0.222 |
|
0.000 |
0.000 |
0.000 |
0.390 |
0.000 |
|
| 3 spectra, SIQPEQVQR |
0.788 |
|
0.155 |
|
0.000 |
0.014 |
0.028 |
0.015 |
0.000 |
|
| 1 spectrum, LTELLESDPSVR |
0.945 |
|
0.000 |
|
0.055 |
0.000 |
0.000 |
0.000 |
0.000 |
|
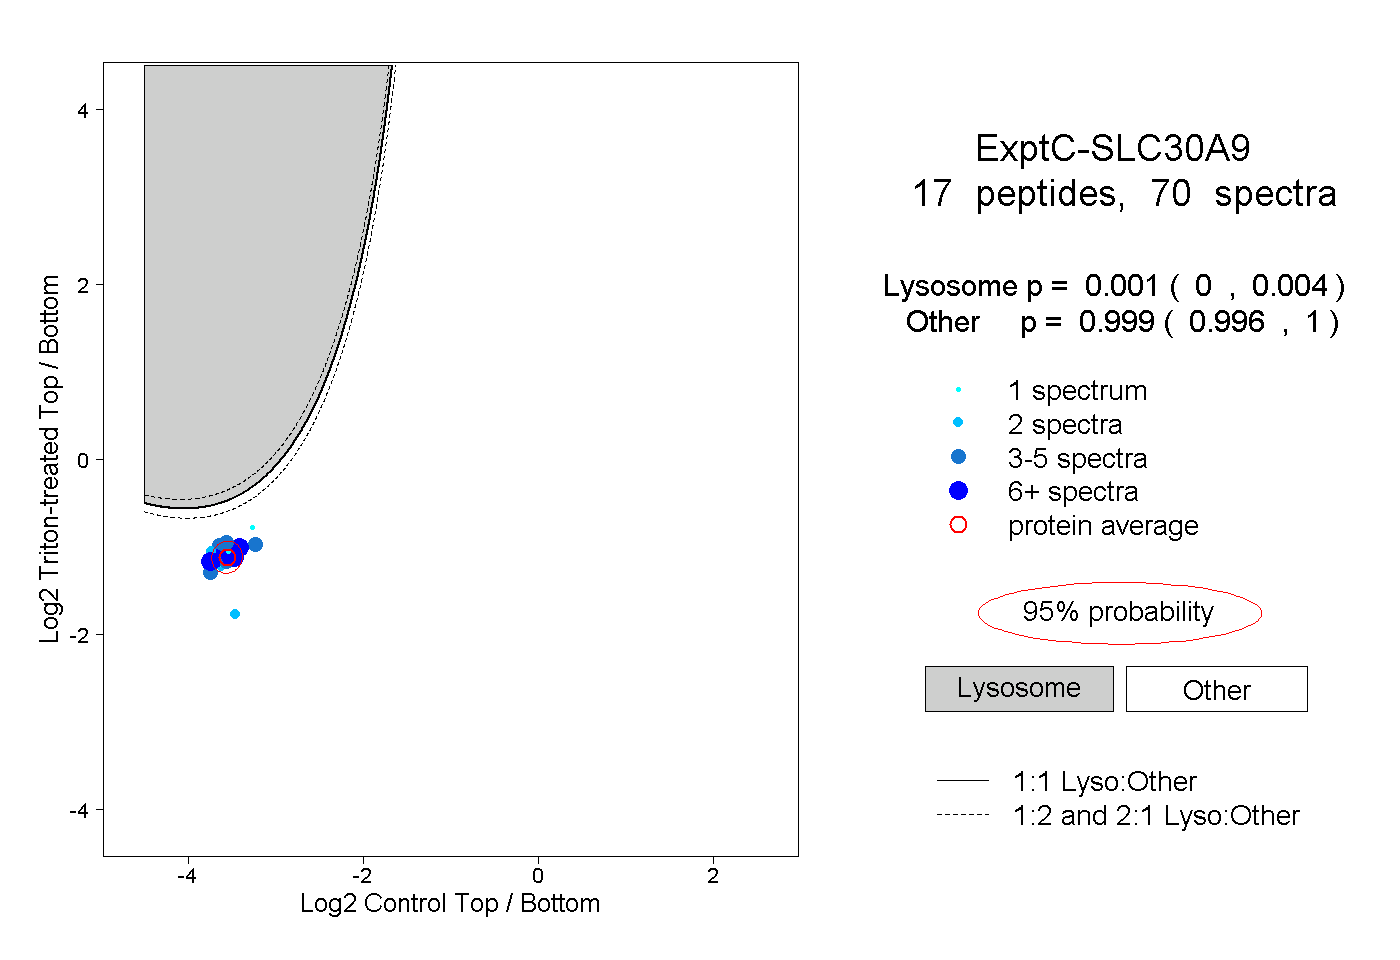
| | | Plot |
|
Lyso |
|
|
|
|
|
|
|
Other |
| Expt C |
17
peptides |
70
spectra |
 |
|
0.001
0.000 | 0.004 |
|
|
|
|
|
|
|
0.999
0.996 | 1.000 |
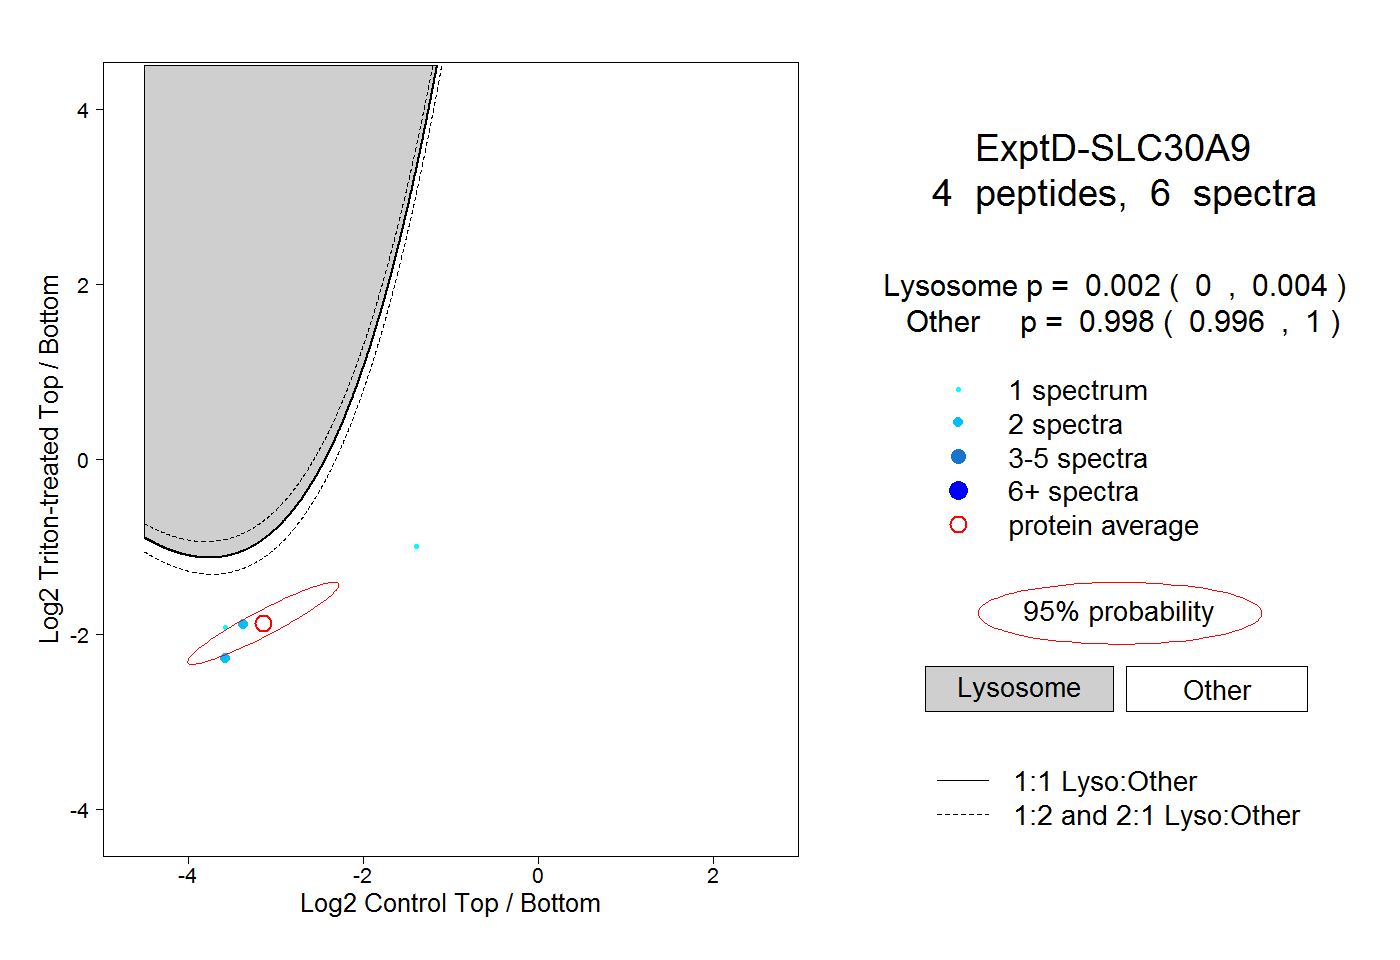
| | | Plot |
|
Lyso |
|
|
|
|
|
|
|
Other |
| Expt D |
4
peptides |
6
spectra |
 |
|
0.002
0.000 | 0.004 |
|
|
|
|
|
|
|
0.998
0.996 | 1.000 |