 8
8peptides
spectra
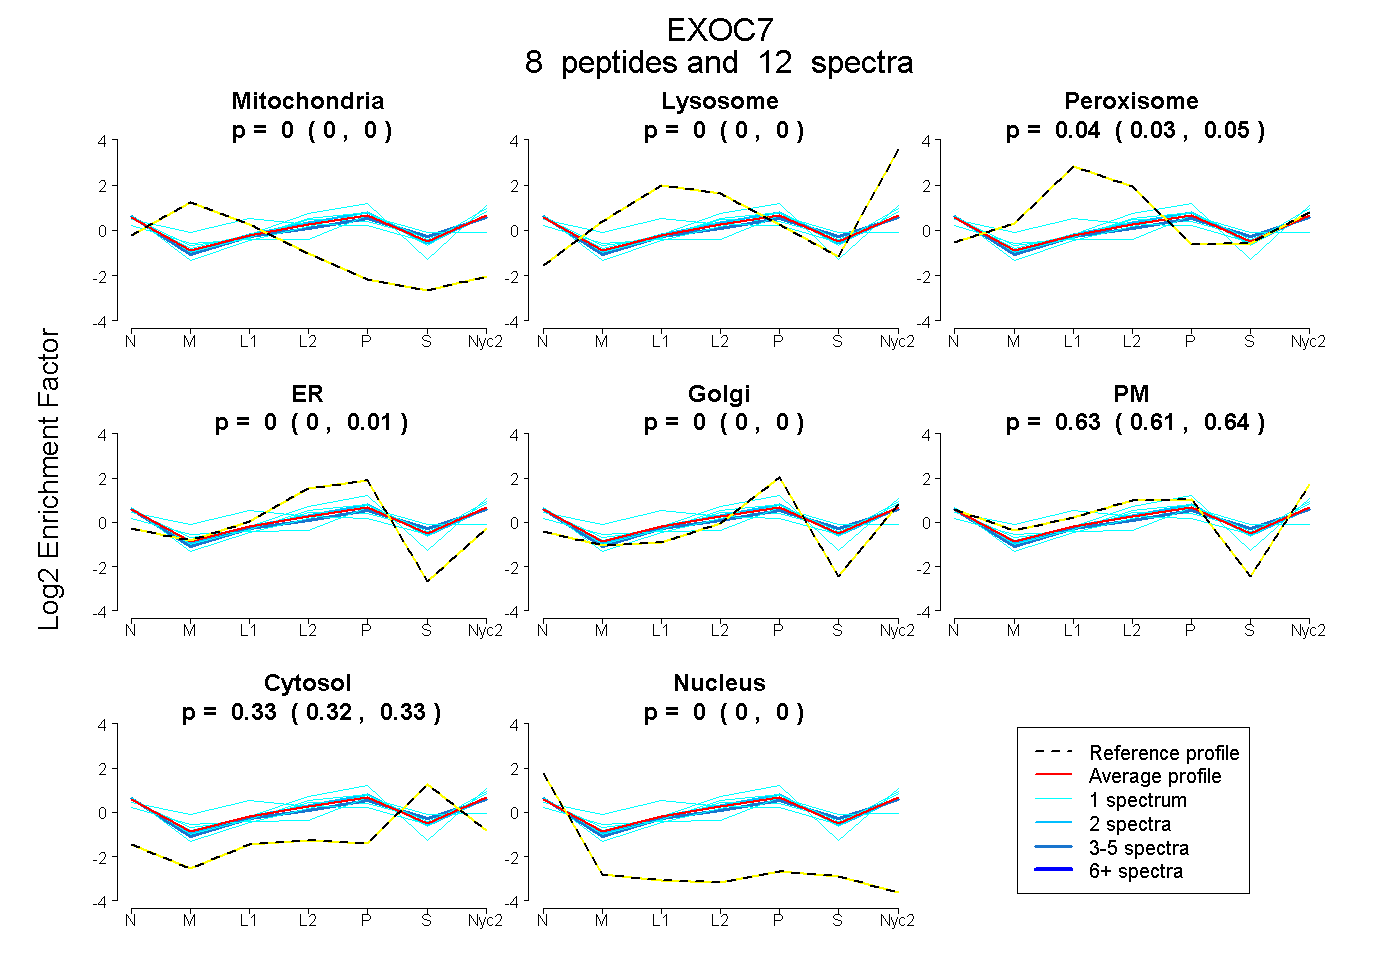
0.000 | 0.000
0.000 | 0.000
0.026 | 0.055
0.000 | 0.012
0.000 | 0.000
0.612 | 0.643
0.316 | 0.334
0.000 | 0.000
1peptide
spectrum
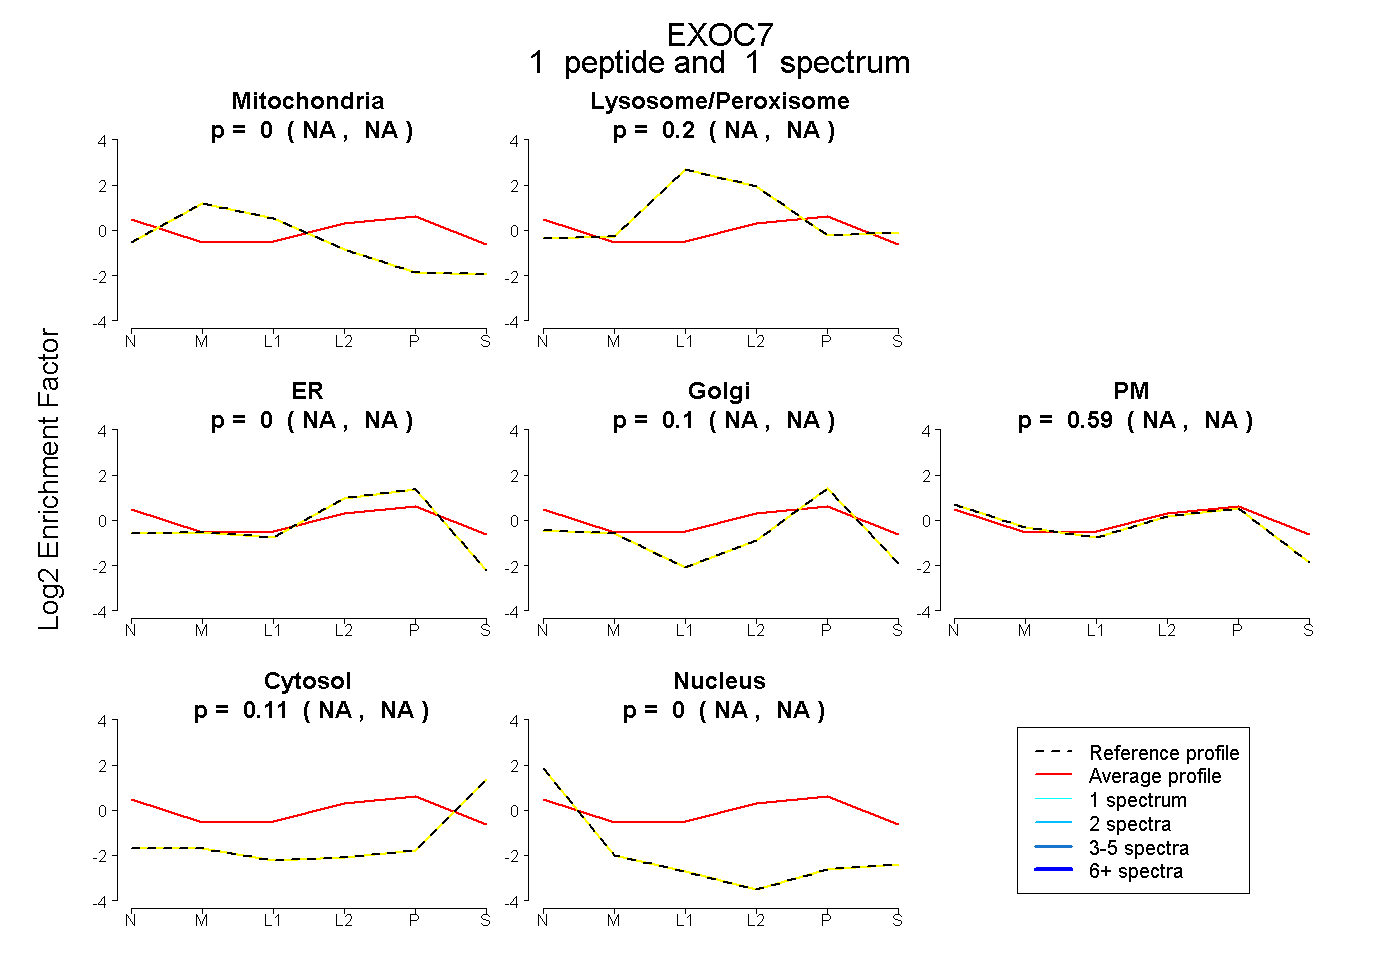
NA | NA
NA | NA
NA | NA
NA | NA
NA | NA
NA | NA
NA | NA
9peptides
spectra
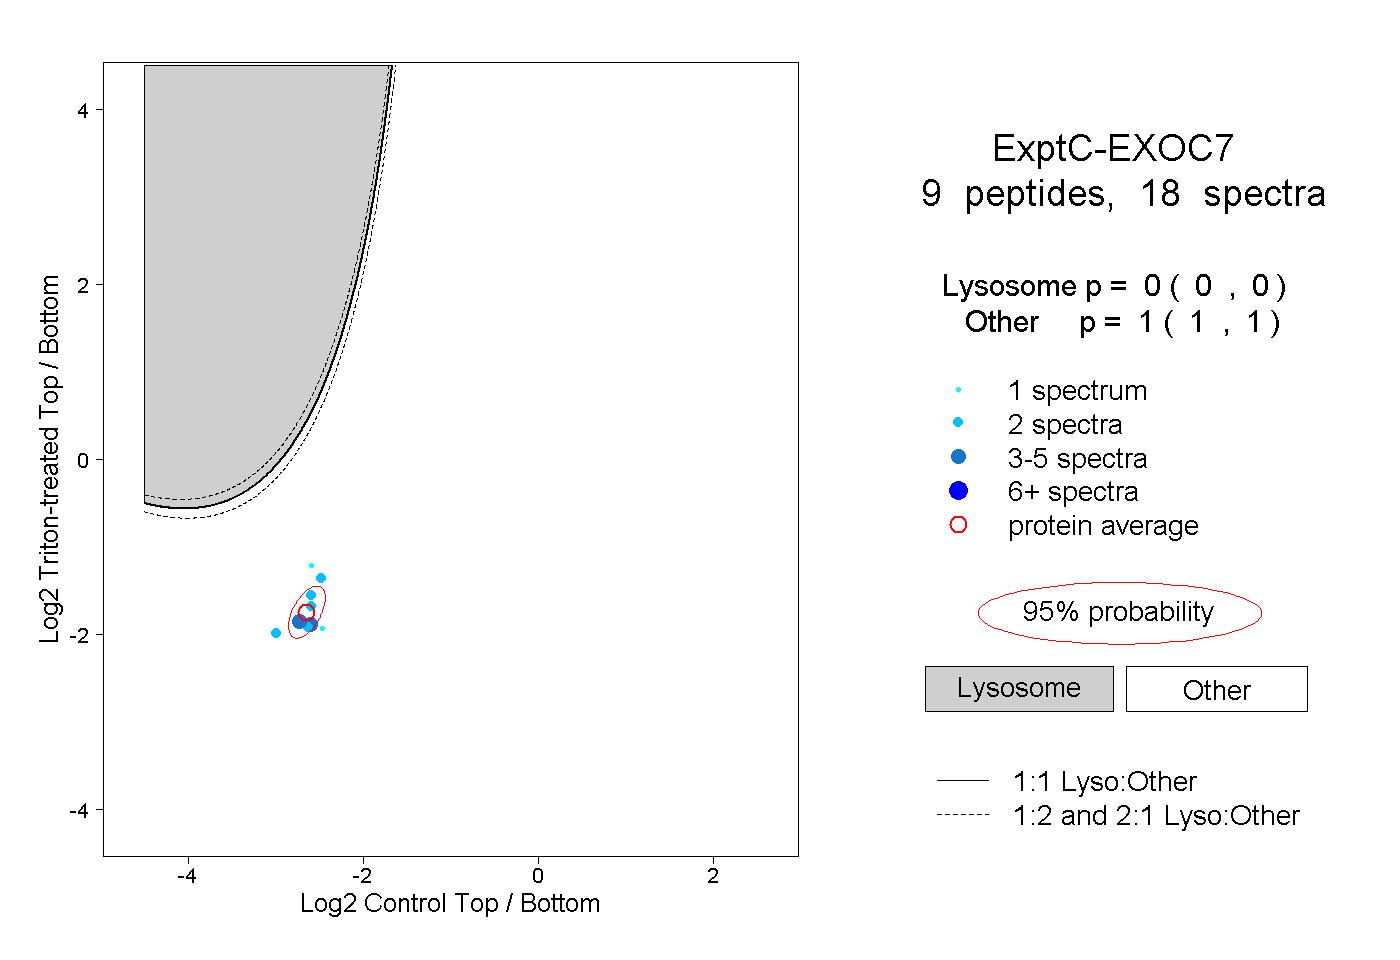
0.000 | 0.000
1.000 | 1.000
1peptide
spectra
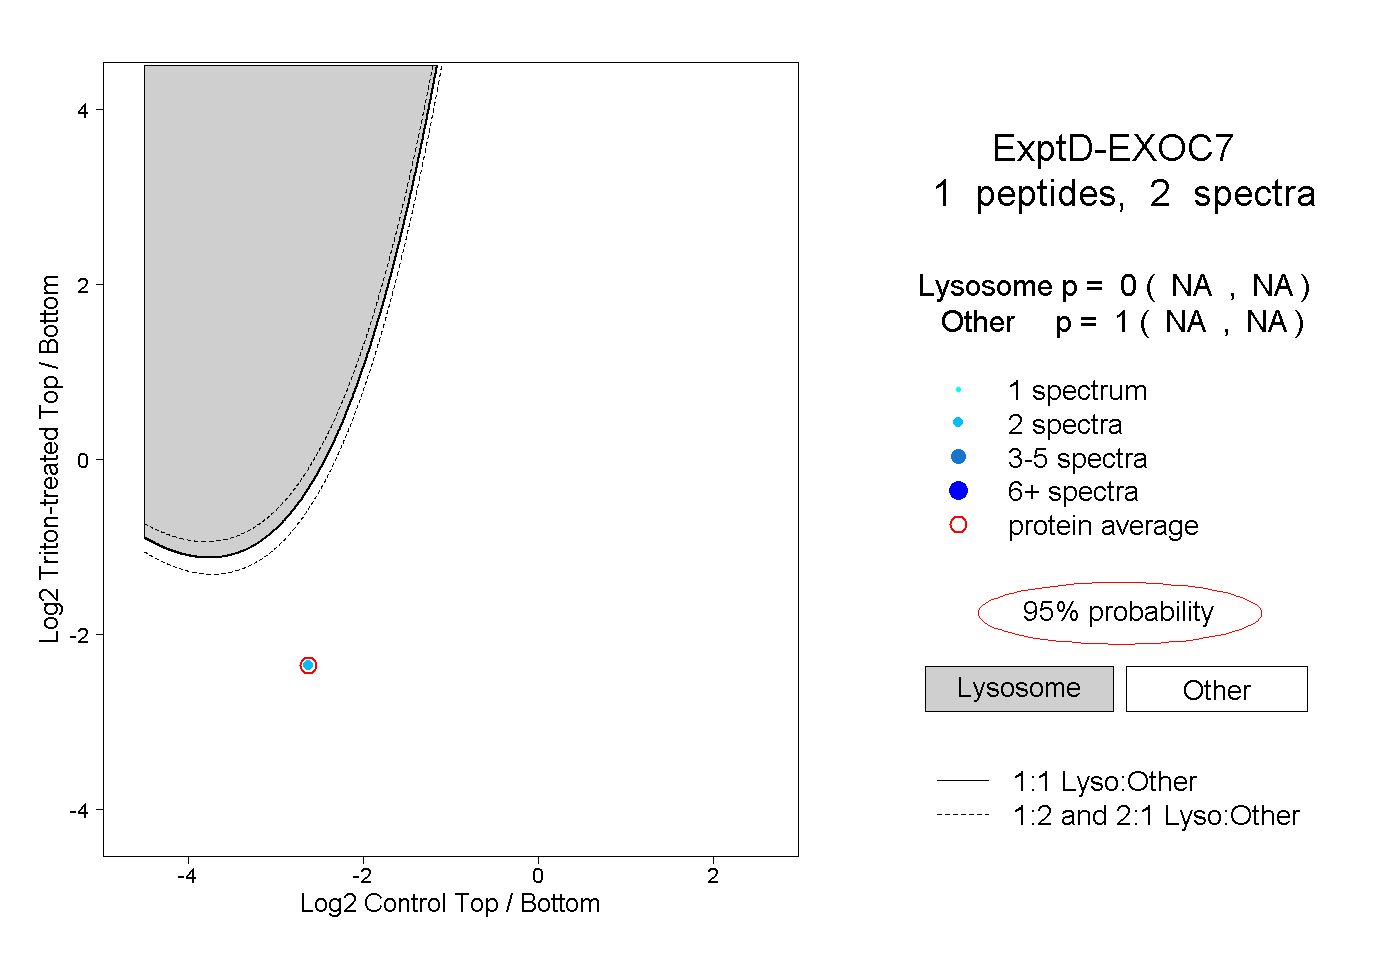
NA | NA
NA | NA