EXOC7
[ENSRNOP00000059717]
Main page
| | | Plot |
Mito |
Lyso |
|
Perox |
ER |
Golgi |
PM |
Cytosol |
Nucleus |
|
| Expt A |
 8
8
peptides |
12
spectra |
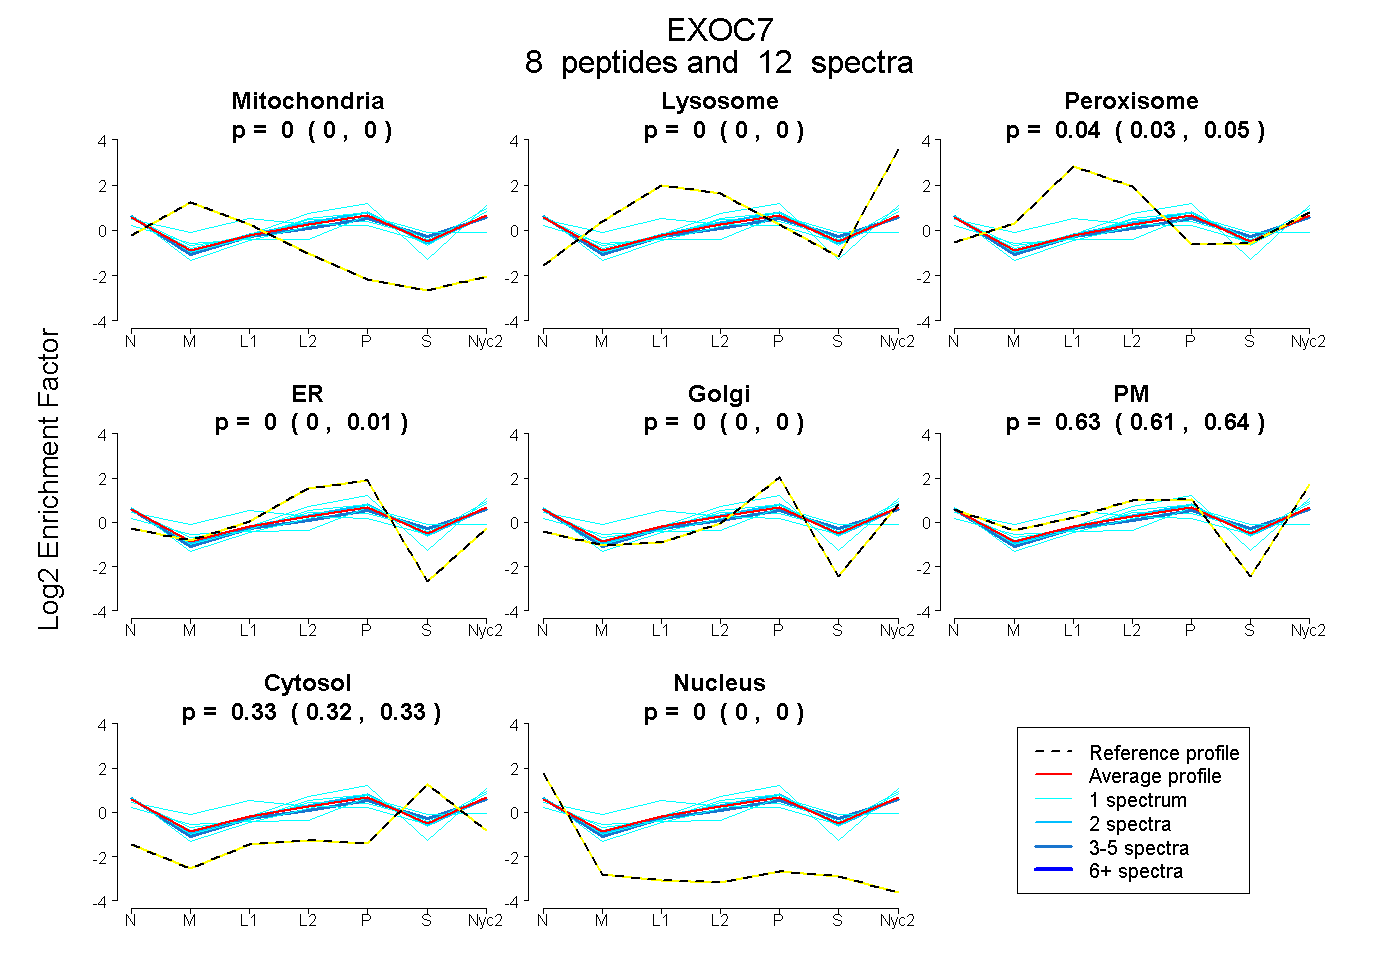 |
0.000
0.000 | 0.000 |
0.000
0.000 | 0.000 |
|
0.042
0.026 | 0.055 |
0.000
0.000 | 0.012 |
0.000
0.000 | 0.000 |
0.632
0.612 | 0.643 |
0.326
0.316 | 0.334 |
0.000
0.000 | 0.000 |
|
| | | Plot |
Mito |
|
Lyso or Perox |
|
ER |
Golgi |
PM |
Cytosol |
Nucleus |
|
| Expt B |
1
peptide |
1
spectrum |
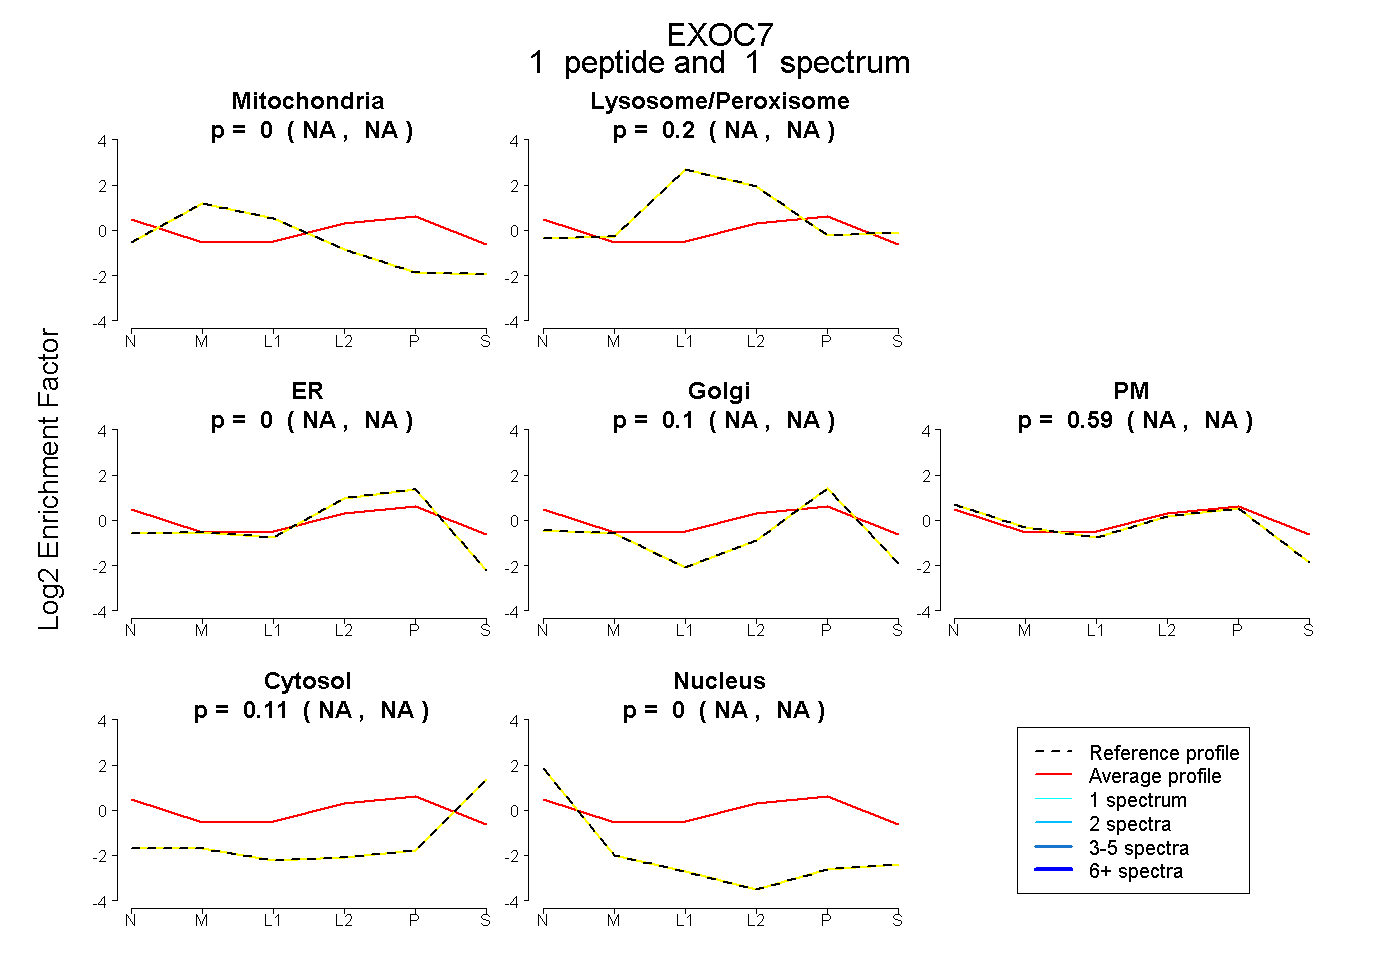 |
0.000
NA | NA |
|
0.202
NA | NA |
|
0.000
NA | NA |
0.104
NA | NA |
0.587
NA | NA |
0.107
NA | NA |
0.000
NA | NA |
|
| | | Plot |
|
Lyso |
|
|
|
|
|
|
|
Other |
| Expt C |
9
peptides |
18
spectra |
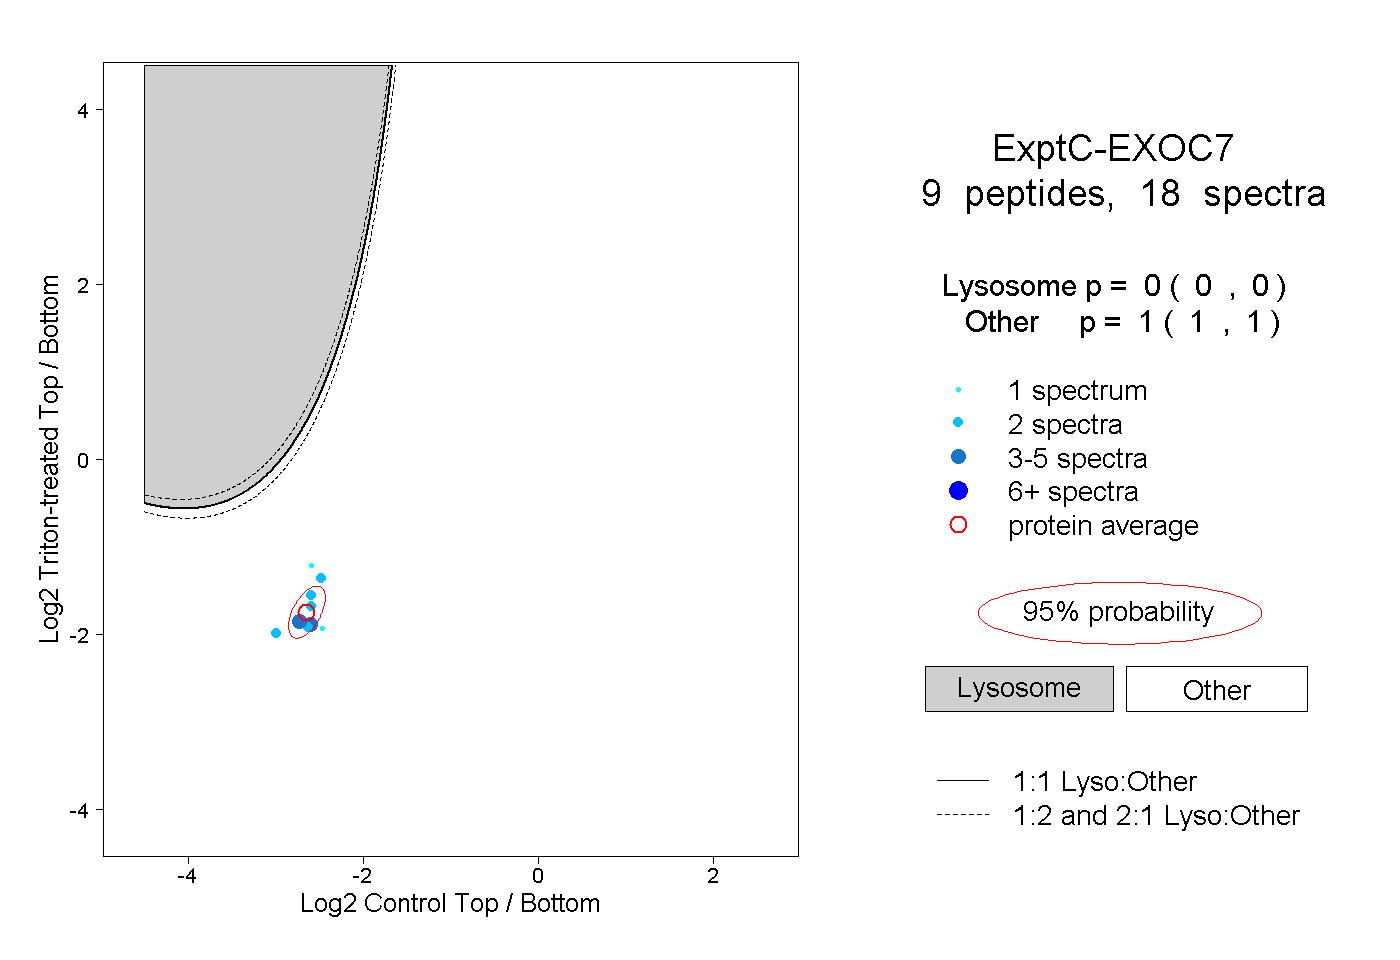 |
|
0.000
0.000 | 0.000 |
|
|
|
|
|
|
|
1.000
1.000 | 1.000 |
| 2 spectra, LQENVEK |
|
0.000 |
|
|
|
|
|
|
|
1.000 |
| 3 spectra, LLSTYICK |
|
0.000 |
|
|
|
|
|
|
|
1.000 |
| 1 spectrum, ALEDFADNIK |
|
0.000 |
|
|
|
|
|
|
|
1.000 |
| 1 spectrum, EHIEQQIQTYQR |
|
0.000 |
|
|
|
|
|
|
|
1.000 |
| 2 spectra, LENSIIPVHK |
|
0.000 |
|
|
|
|
|
|
|
1.000 |
| 2 spectra, NMVSILSSFESR |
|
0.000 |
|
|
|
|
|
|
|
1.000 |
| 3 spectra, YSSVPFTK |
|
0.000 |
|
|
|
|
|
|
|
1.000 |
| 2 spectra, VTDYIAEK |
|
0.000 |
|
|
|
|
|
|
|
1.000 |
| 2 spectra, ESLESEFR |
|
0.000 |
|
|
|
|
|
|
|
1.000 |
| | | Plot |
|
Lyso |
|
|
|
|
|
|
|
Other |
| Expt D |
1
peptide |
2
spectra |
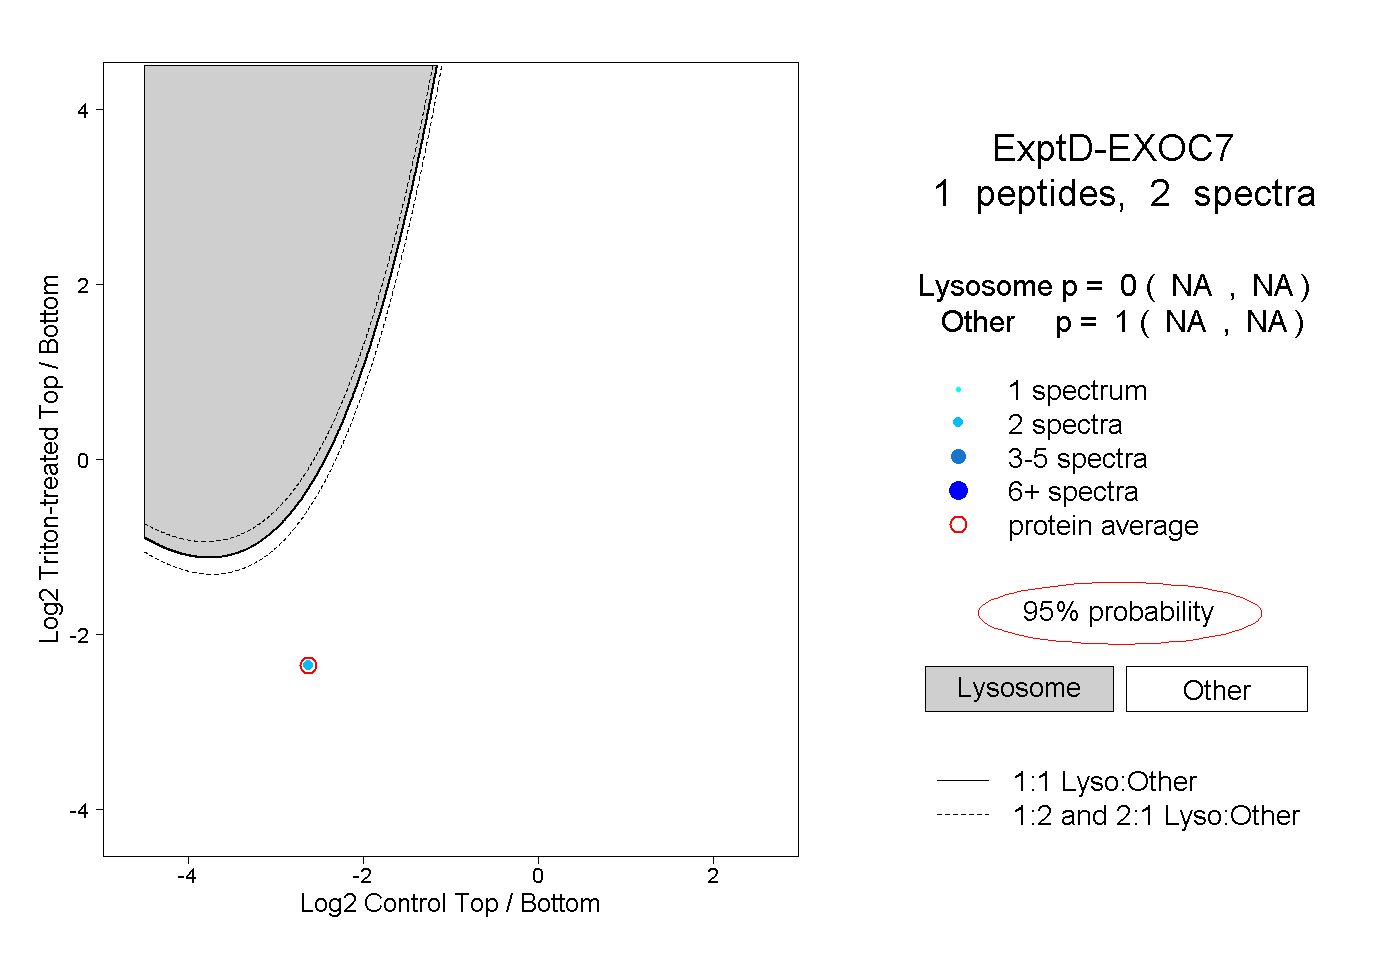 |
|
0.000
NA | NA |
|
|
|
|
|
|
|
1.000
NA | NA |