 8
8peptides
spectra
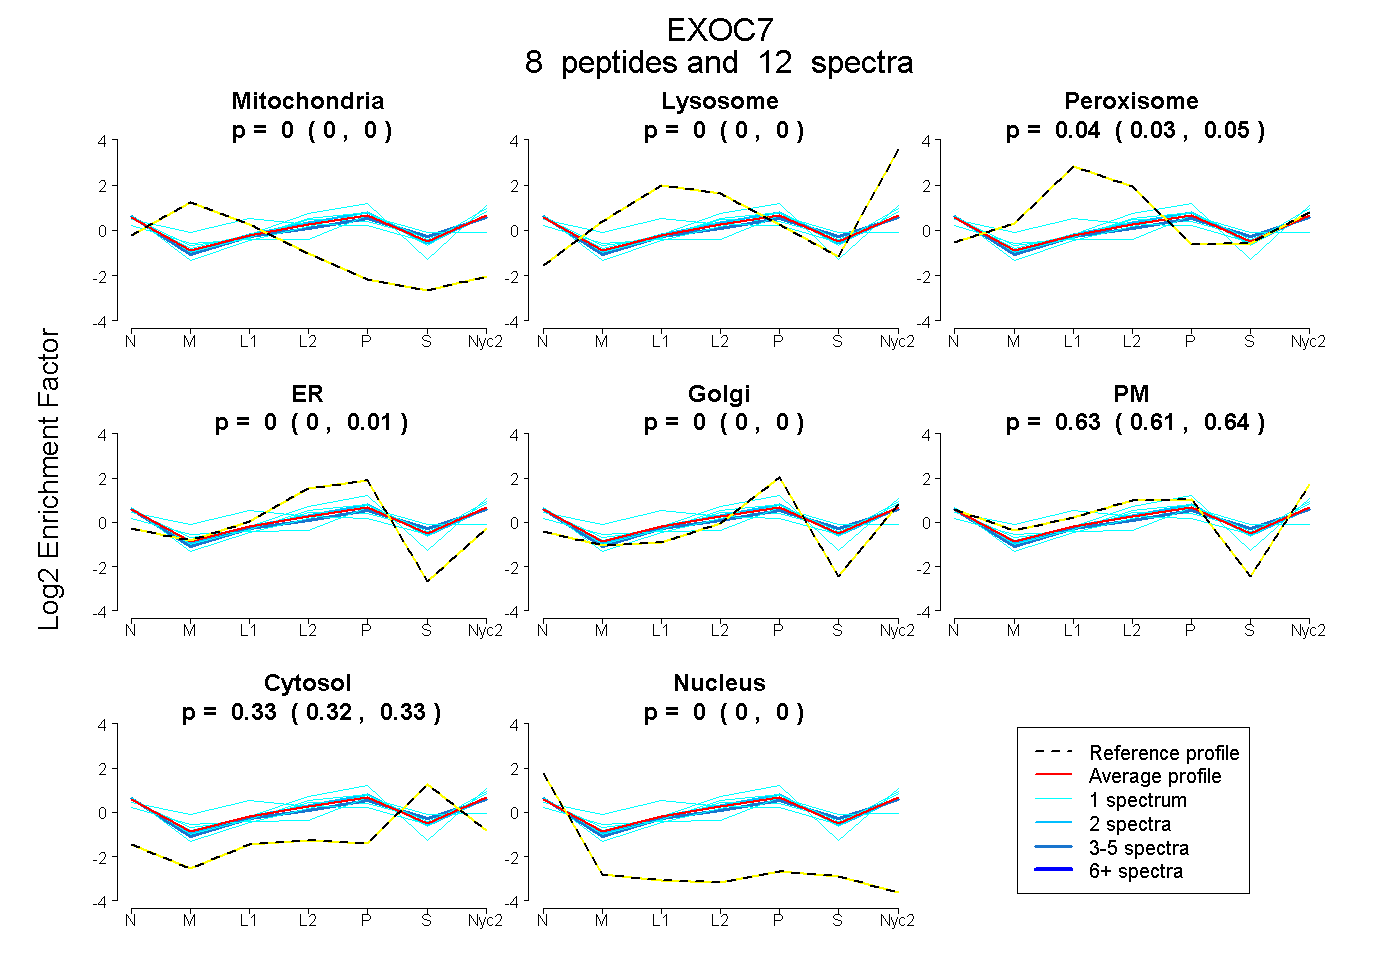
0.000 | 0.000
0.000 | 0.000
0.026 | 0.055
0.000 | 0.012
0.000 | 0.000
0.612 | 0.643
0.316 | 0.334
0.000 | 0.000
| Plot | Mito | Lyso | Perox | ER | Golgi | PM | Cytosol | Nucleus | |||||
| Expt A |
8 peptides |
12 spectra |
|
0.000 0.000 | 0.000 |
0.000 0.000 | 0.000 |
0.042 0.026 | 0.055 |
0.000 0.000 | 0.012 |
0.000 0.000 | 0.000 |
0.632 0.612 | 0.643 |
0.326 0.316 | 0.334 |
0.000 0.000 | 0.000 |
| 4 spectra, LQENVEK | 0.000 | 0.000 | 0.028 | 0.000 | 0.000 | 0.593 | 0.380 | 0.000 | ||
| 1 spectrum, SELIQLVAVTQK | 0.000 | 0.000 | 0.000 | 0.000 | 0.016 | 0.619 | 0.365 | 0.000 | ||
| 1 spectrum, ETYGAFLHR | 0.000 | 0.000 | 0.000 | 0.078 | 0.036 | 0.719 | 0.167 | 0.000 | ||
| 2 spectra, AWAIPDTEQR | 0.000 | 0.000 | 0.029 | 0.029 | 0.000 | 0.632 | 0.310 | 0.000 | ||
| 1 spectrum, NLPVFQPGVK | 0.000 | 0.000 | 0.002 | 0.008 | 0.000 | 0.698 | 0.291 | 0.000 | ||
| 1 spectrum, GFNDGLEELCK | 0.000 | 0.000 | 0.080 | 0.000 | 0.000 | 0.579 | 0.341 | 0.000 | ||
| 1 spectrum, WLVEYGR | 0.023 | 0.000 | 0.259 | 0.000 | 0.000 | 0.500 | 0.218 | 0.000 | ||
| 1 spectrum, YSSVPFTK | 0.053 | 0.000 | 0.117 | 0.000 | 0.267 | 0.200 | 0.363 | 0.000 |
| Plot | Mito | Lyso or Perox | ER | Golgi | PM | Cytosol | Nucleus | ||||||
| Expt B |
1 peptide |
1 spectrum |
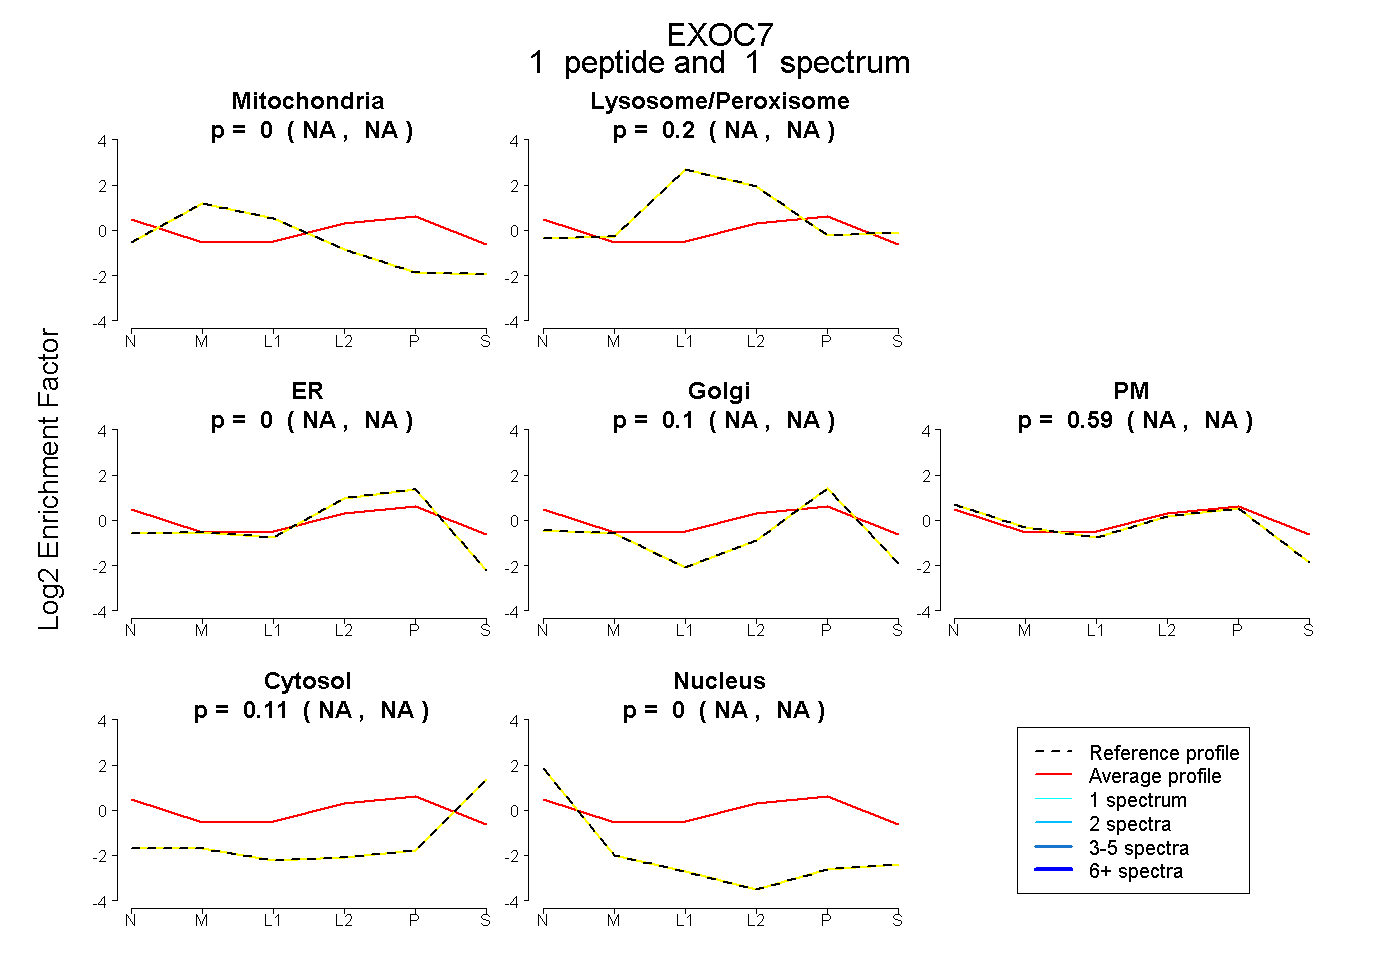 |
0.000 NA | NA |
0.202 NA | NA |
0.000 NA | NA |
0.104 NA | NA |
0.587 NA | NA |
0.107 NA | NA |
0.000 NA | NA |
|||
| Plot | Lyso | Other | |||||||||||
| Expt C |
9 peptides |
18 spectra |
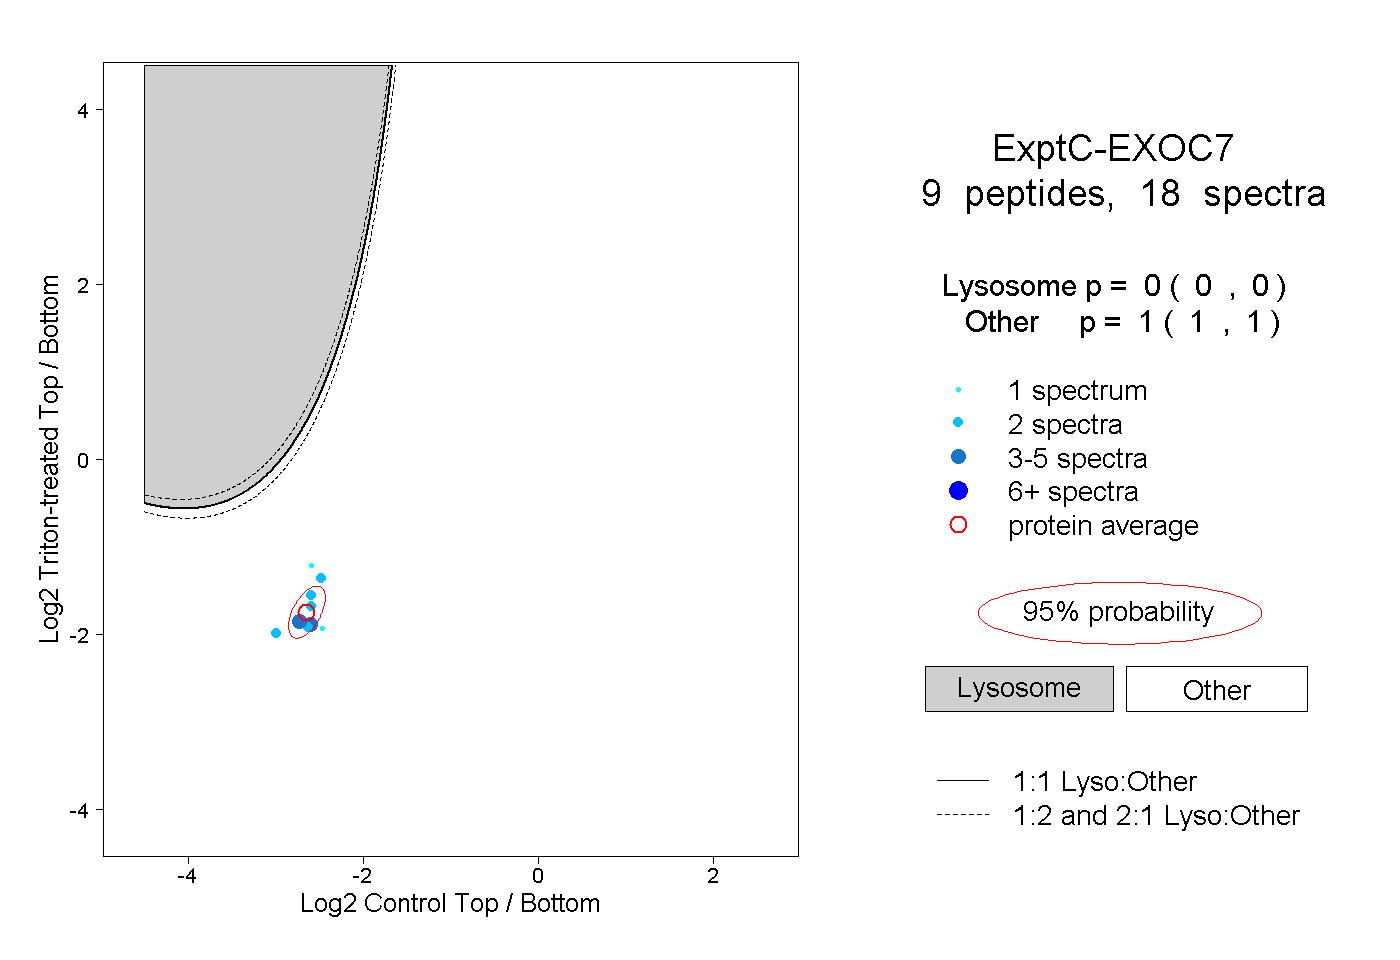 |
0.000 0.000 | 0.000 |
1.000 1.000 | 1.000 |
||||||||
| Plot | Lyso | Other | |||||||||||
| Expt D |
1 peptide |
2 spectra |
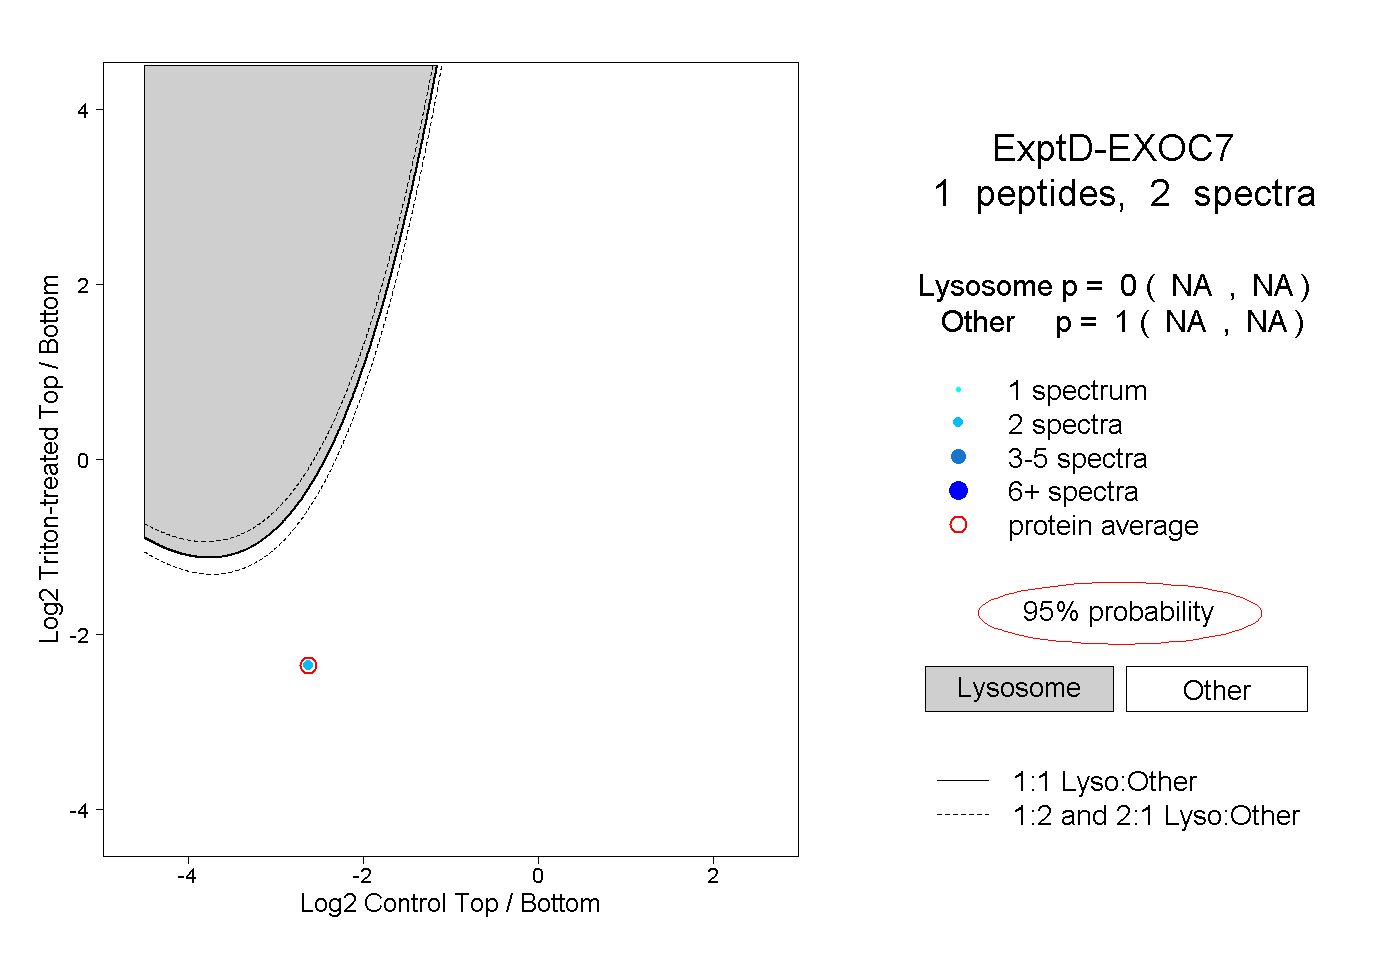 |
0.000 NA | NA |
1.000 NA | NA |