 24
24peptides
spectra
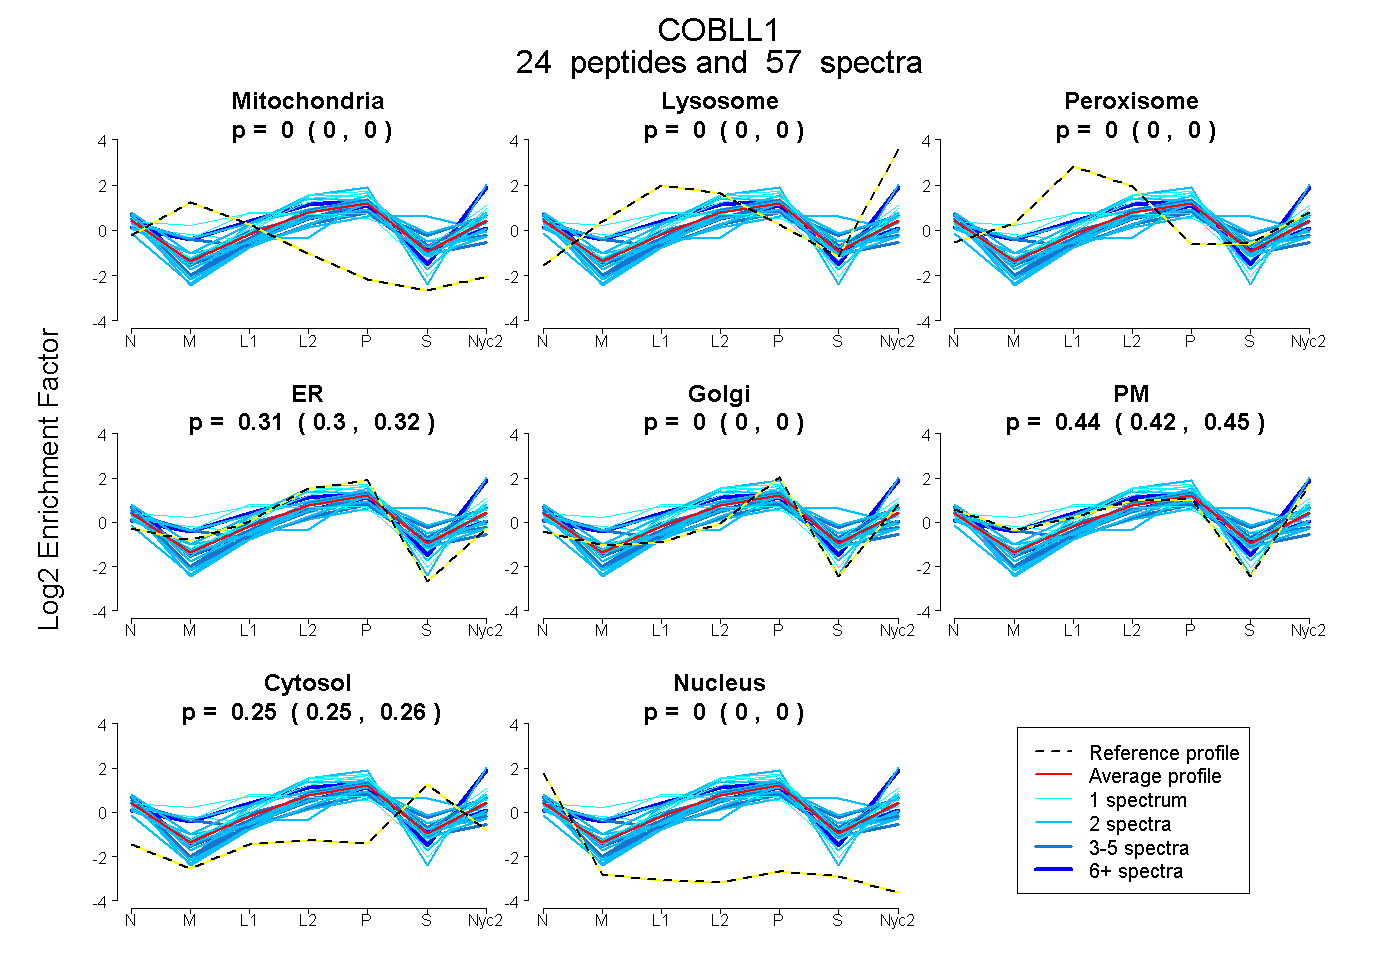
0.000 | 0.000
0.000 | 0.000
0.000 | 0.000
0.297 | 0.321
0.000 | 0.000
0.423 | 0.448
0.248 | 0.257
0.000 | 0.000
8peptides
spectra
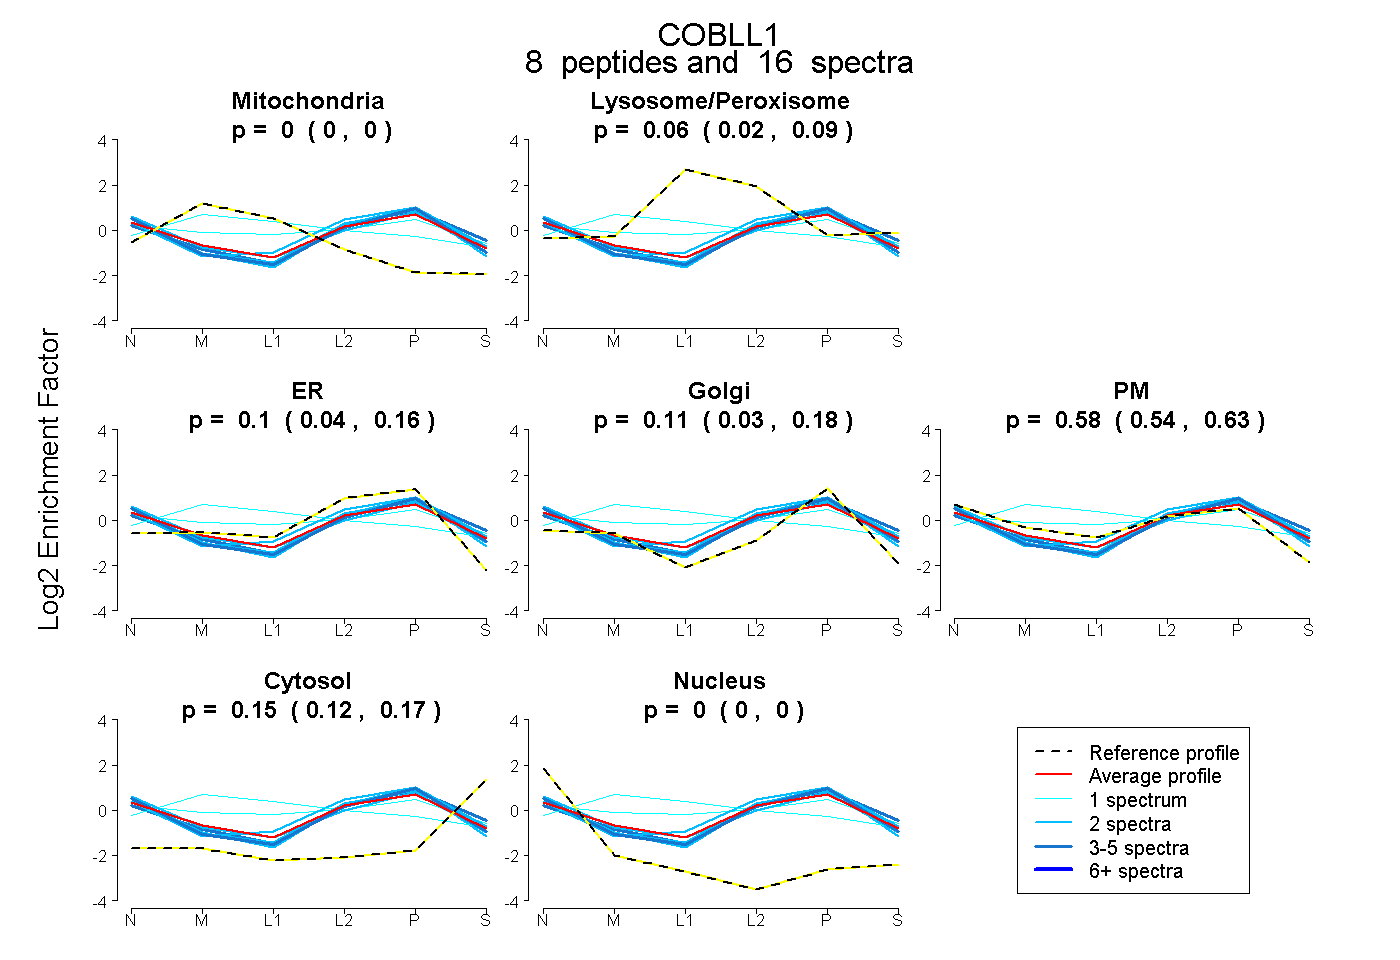
0.000 | 0.000
0.019 | 0.088
0.038 | 0.156
0.034 | 0.181
0.537 | 0.626
0.121 | 0.167
0.000 | 0.000
26peptides
spectra
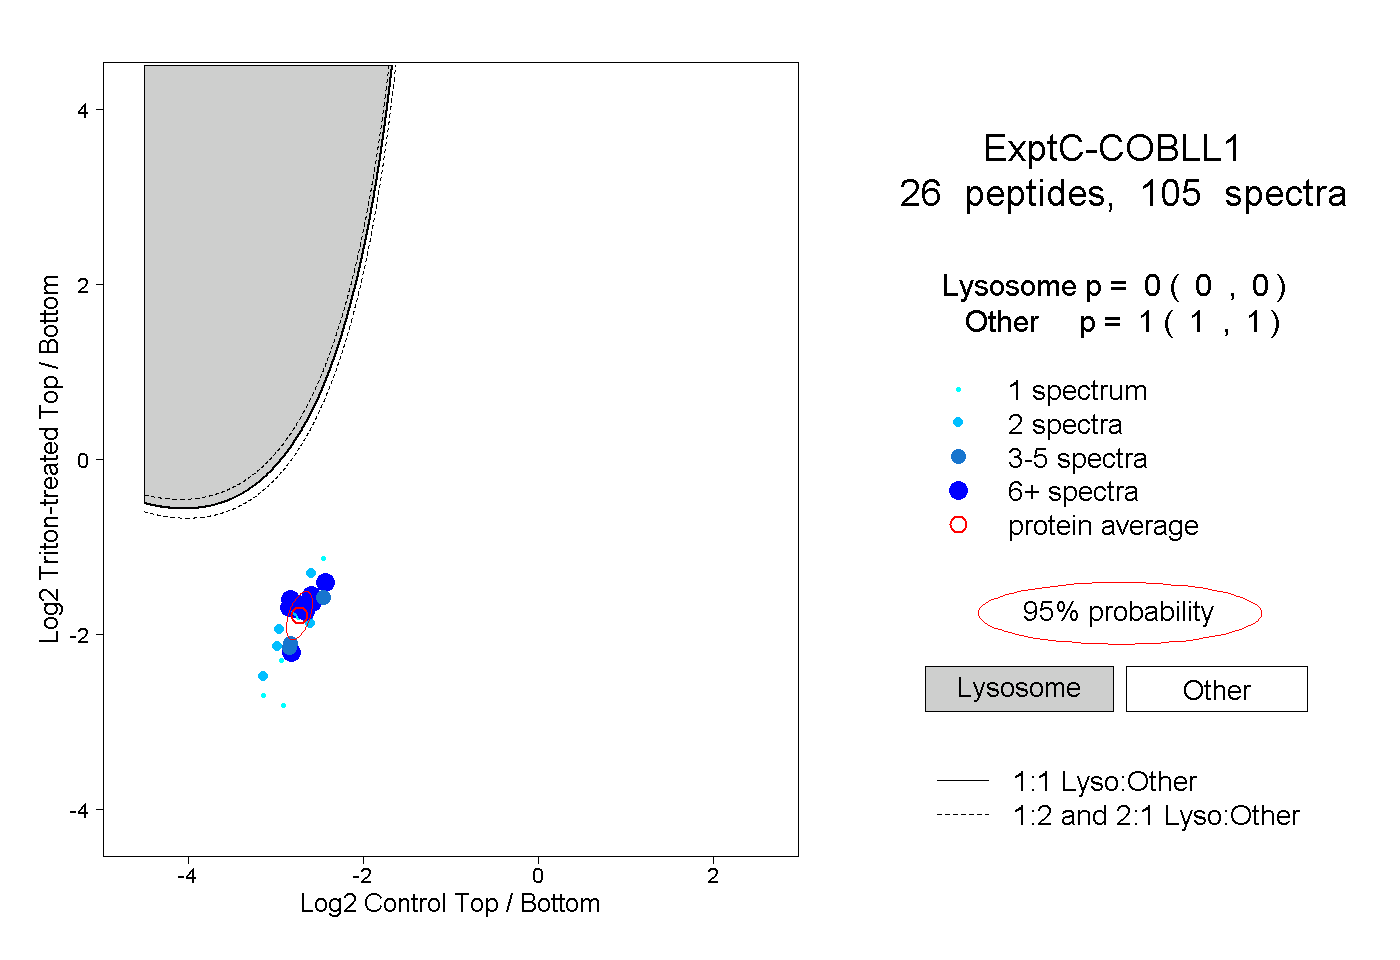
0.000 | 0.000
1.000 | 1.000
6peptides
spectra
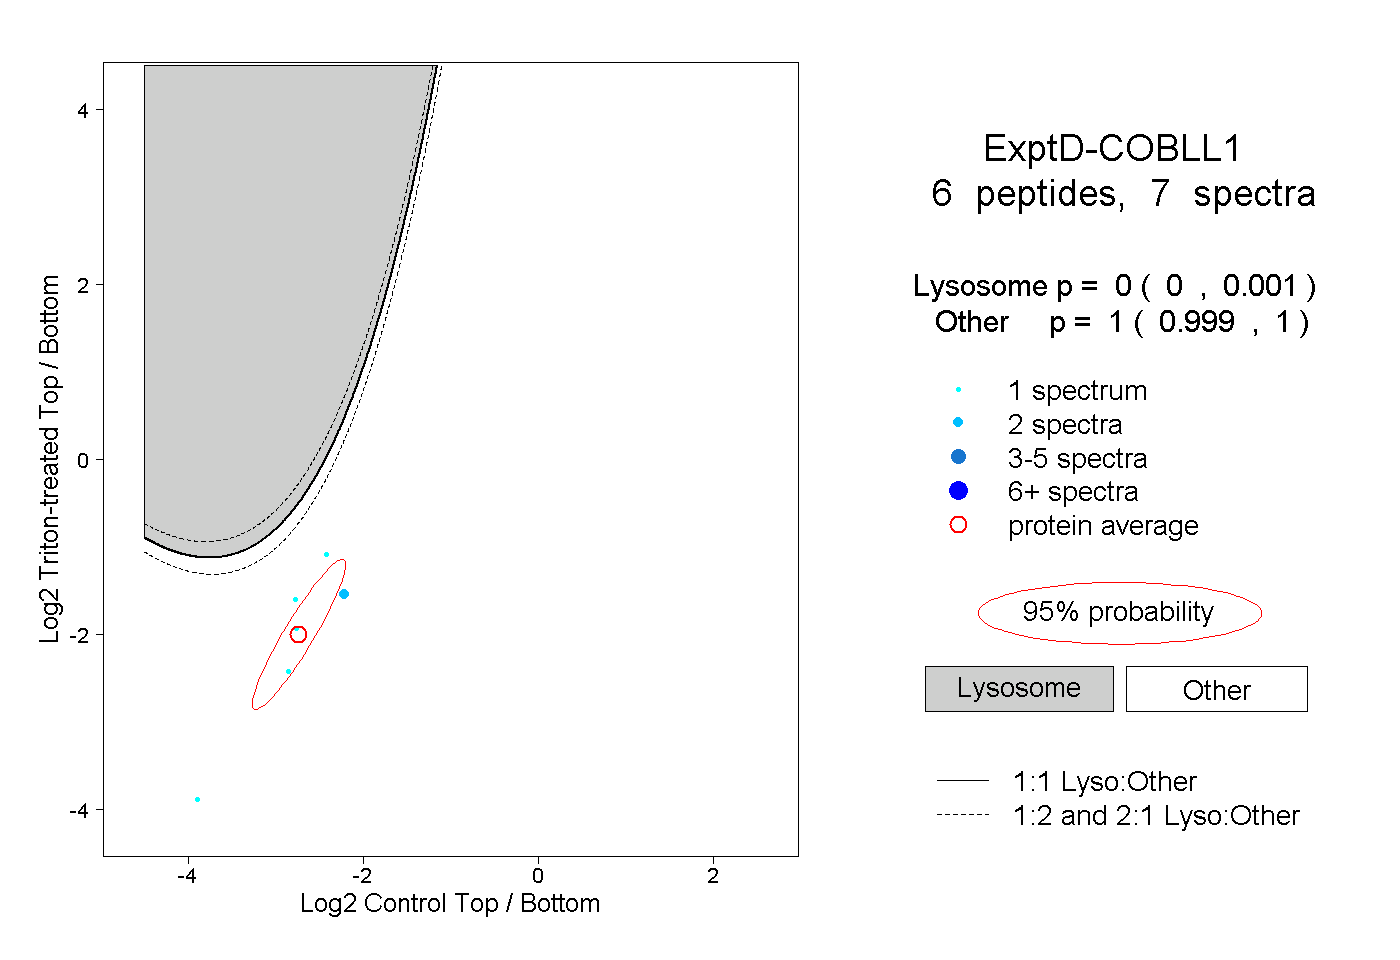
0.000 | 0.001
0.999 | 1.000