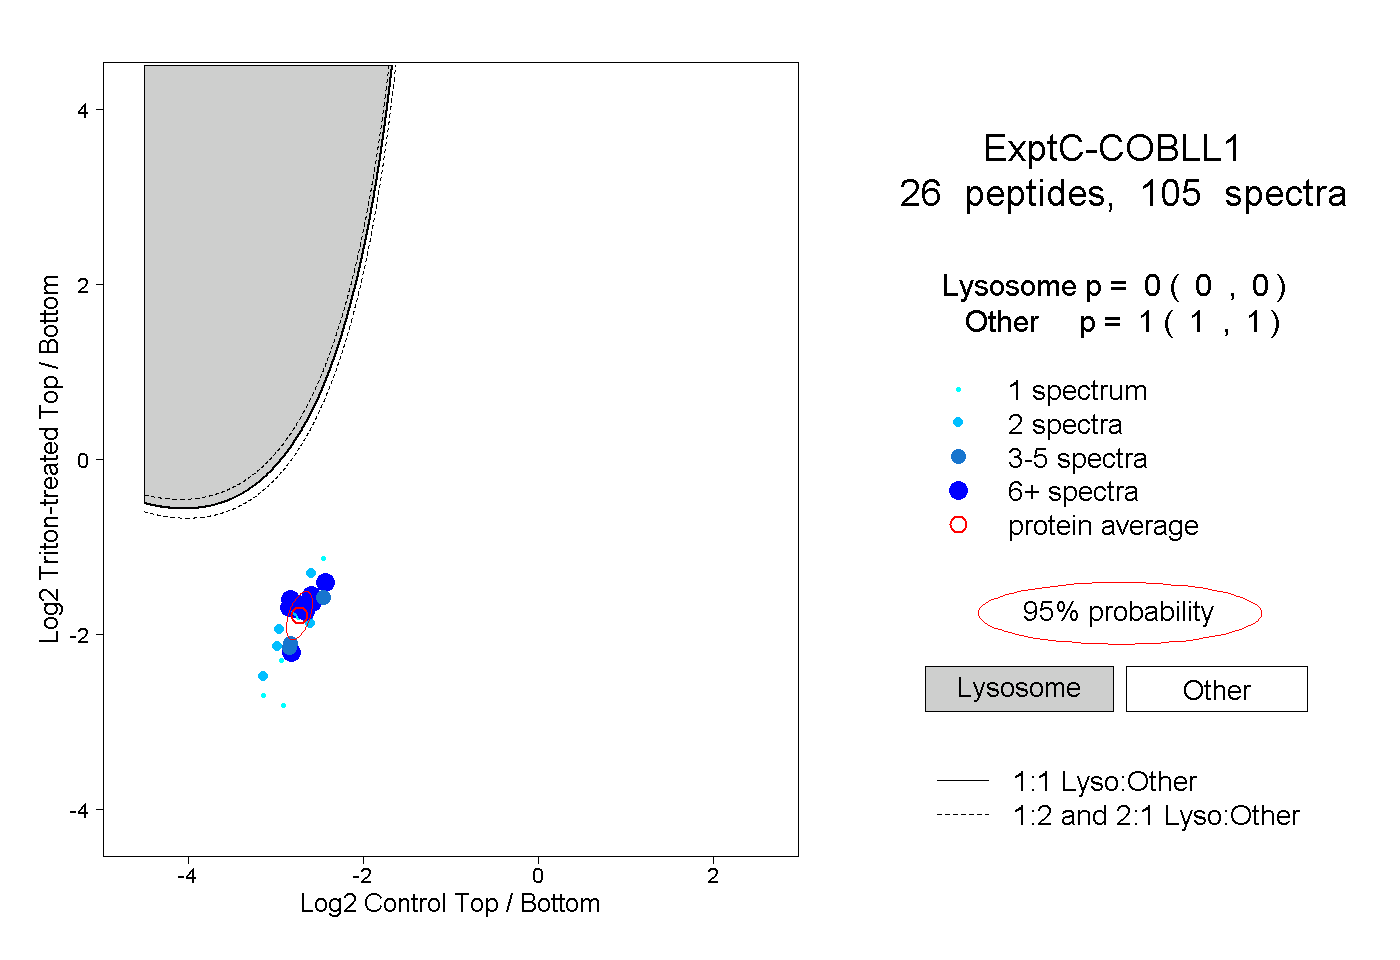
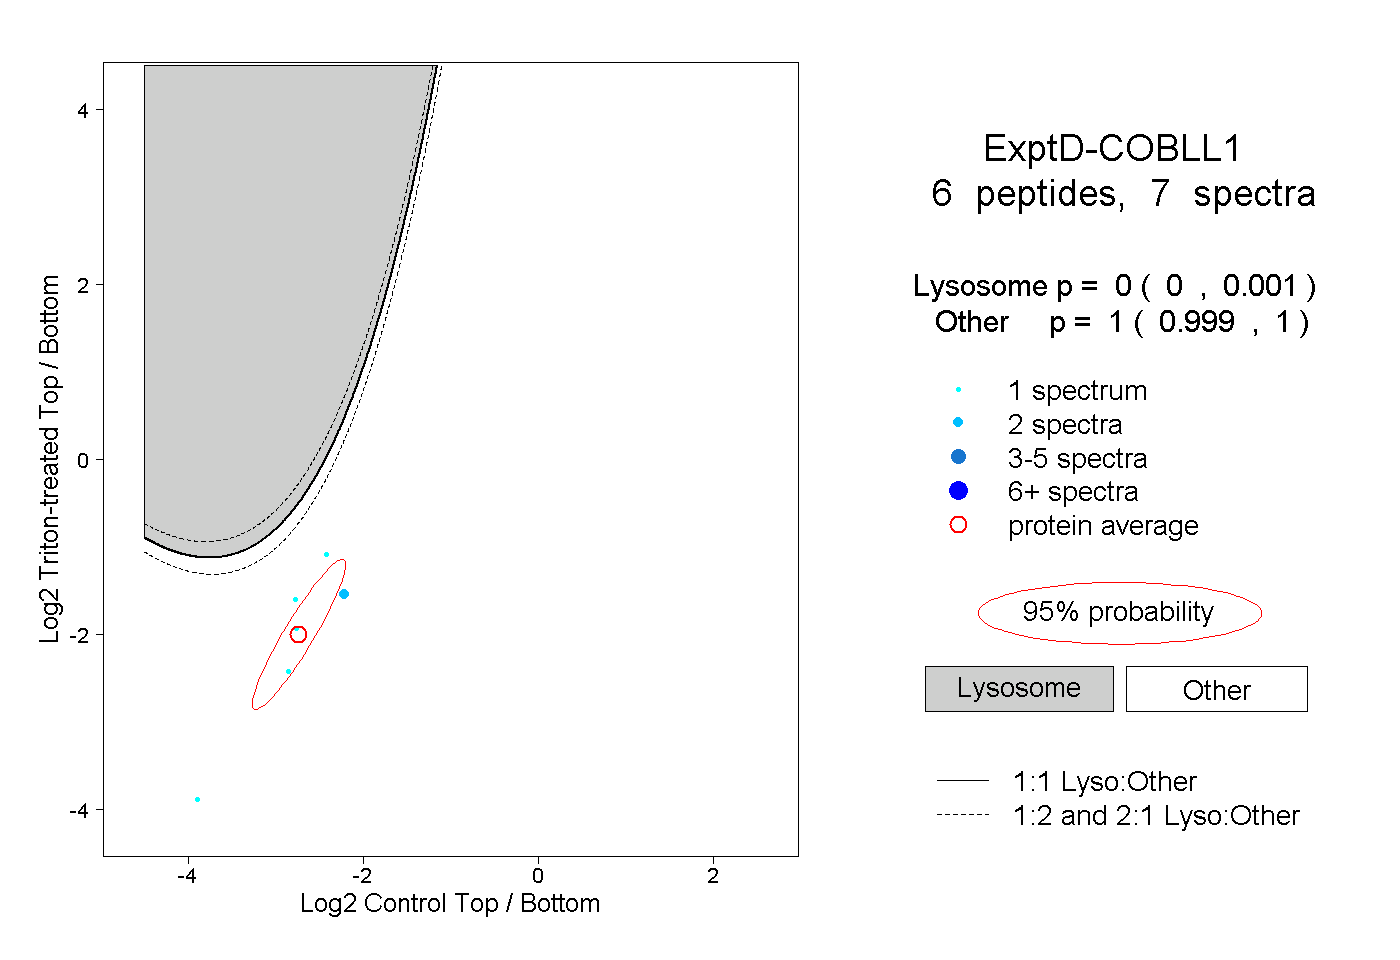
| 5 spectra, SVHTAPGPTPK |
|
0.000 |
|
|
|
|
|
|
|
1.000 |
| 2 spectra, APLPPAEMK |
|
0.000 |
|
|
|
|
|
|
|
1.000 |
| 1 spectrum, VVINFK |
|
0.000 |
|
|
|
|
|
|
|
1.000 |
| 7 spectra, SLNDLGLR |
|
0.000 |
|
|
|
|
|
|
|
1.000 |
| 1 spectrum, THSAPLPNISK |
|
0.000 |
|
|
|
|
|
|
|
1.000 |
| 7 spectra, ELYAMDISR |
|
0.000 |
|
|
|
|
|
|
|
1.000 |
| 4 spectra, IGMTTYK |
|
0.000 |
|
|
|
|
|
|
|
1.000 |
| 4 spectra, STSVDDTDK |
|
0.000 |
|
|
|
|
|
|
|
1.000 |
| 2 spectra, KPTPIIPEK |
|
0.000 |
|
|
|
|
|
|
|
1.000 |
| 11 spectra, SGEAAAK |
|
0.000 |
|
|
|
|
|
|
|
1.000 |
| 2 spectra, VTVPSNR |
|
0.000 |
|
|
|
|
|
|
|
1.000 |
| 2 spectra, DYQAQEPLDLTK |
|
0.000 |
|
|
|
|
|
|
|
1.000 |
| 2 spectra, SLEVVK |
|
0.000 |
|
|
|
|
|
|
|
1.000 |
| 1 spectrum, EMEATIEGEAQK |
|
0.000 |
|
|
|
|
|
|
|
1.000 |
| 6 spectra, NPAASSLK |
|
0.000 |
|
|
|
|
|
|
|
1.000 |
| 2 spectra, NFPLYR |
|
0.000 |
|
|
|
|
|
|
|
1.000 |
| 1 spectrum, TVSSPVGTEMNPPKPPR |
|
0.000 |
|
|
|
|
|
|
|
1.000 |
| 1 spectrum, LTPADGPSSFTLQR |
|
0.000 |
|
|
|
|
|
|
|
1.000 |
| 9 spectra, FKPNTPIGMLEVEK |
|
0.000 |
|
|
|
|
|
|
|
1.000 |
| 10 spectra, DQAGSVK |
|
0.000 |
|
|
|
|
|
|
|
1.000 |
| 2 spectra, QSLLTAIR |
|
0.000 |
|
|
|
|
|
|
|
1.000 |
| 2 spectra, MDDVQSSR |
|
0.000 |
|
|
|
|
|
|
|
1.000 |
| 7 spectra, SQGTSTYVQDR |
|
0.000 |
|
|
|
|
|
|
|
1.000 |
| 6 spectra, VGDVEAER |
|
0.000 |
|
|
|
|
|
|
|
1.000 |
| 6 spectra, GIFSFFQR |
|
0.000 |
|
|
|
|
|
|
|
1.000 |
| 2 spectra, ASGHYVTSAAAK |
|
0.000 |
|
|
|
|
|
|
|
1.000 |
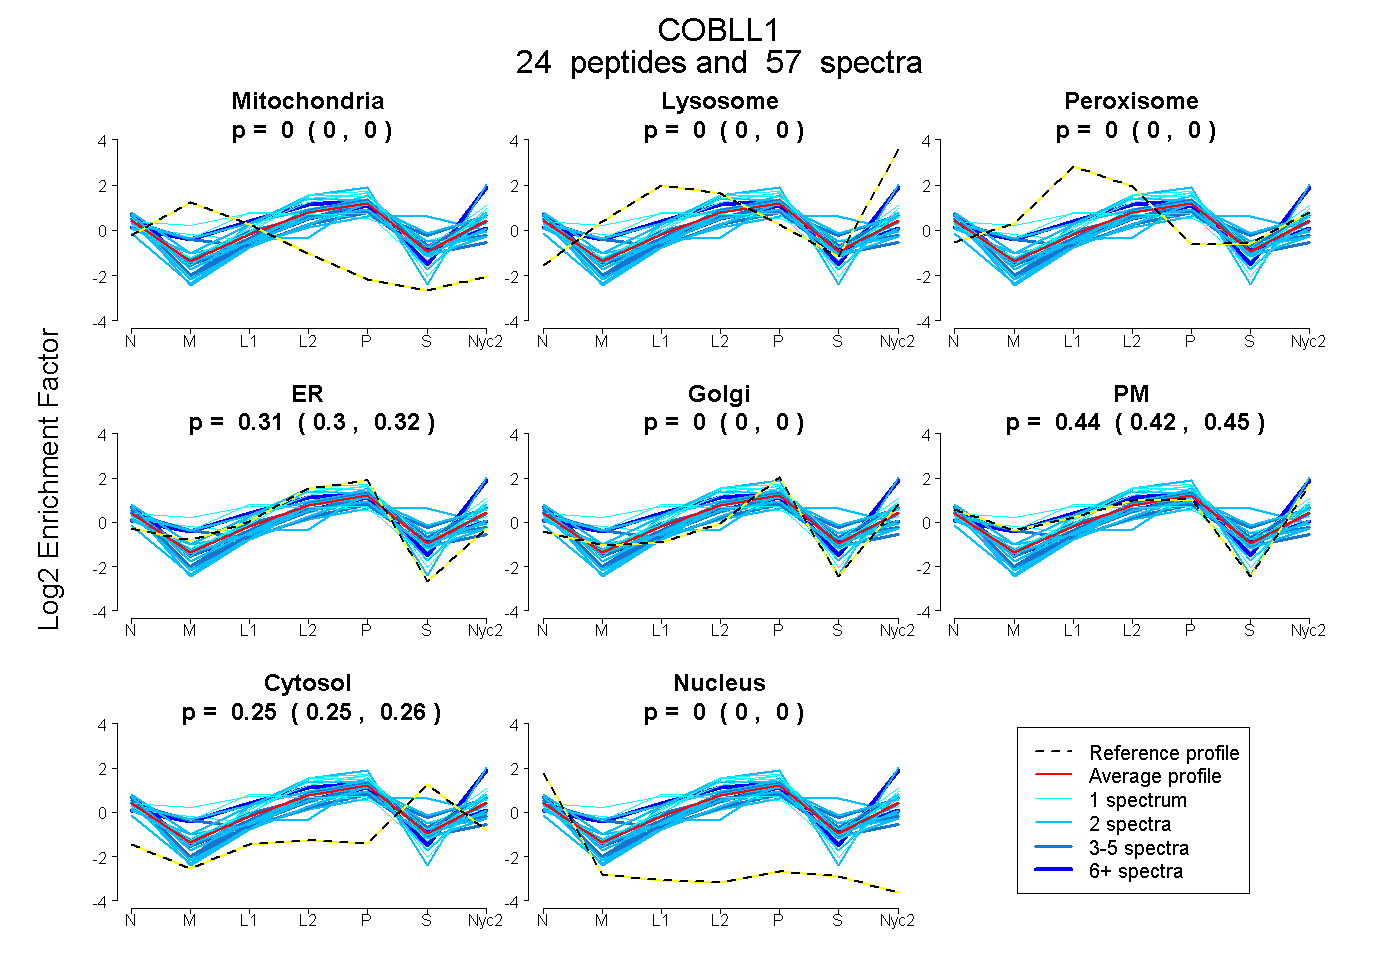
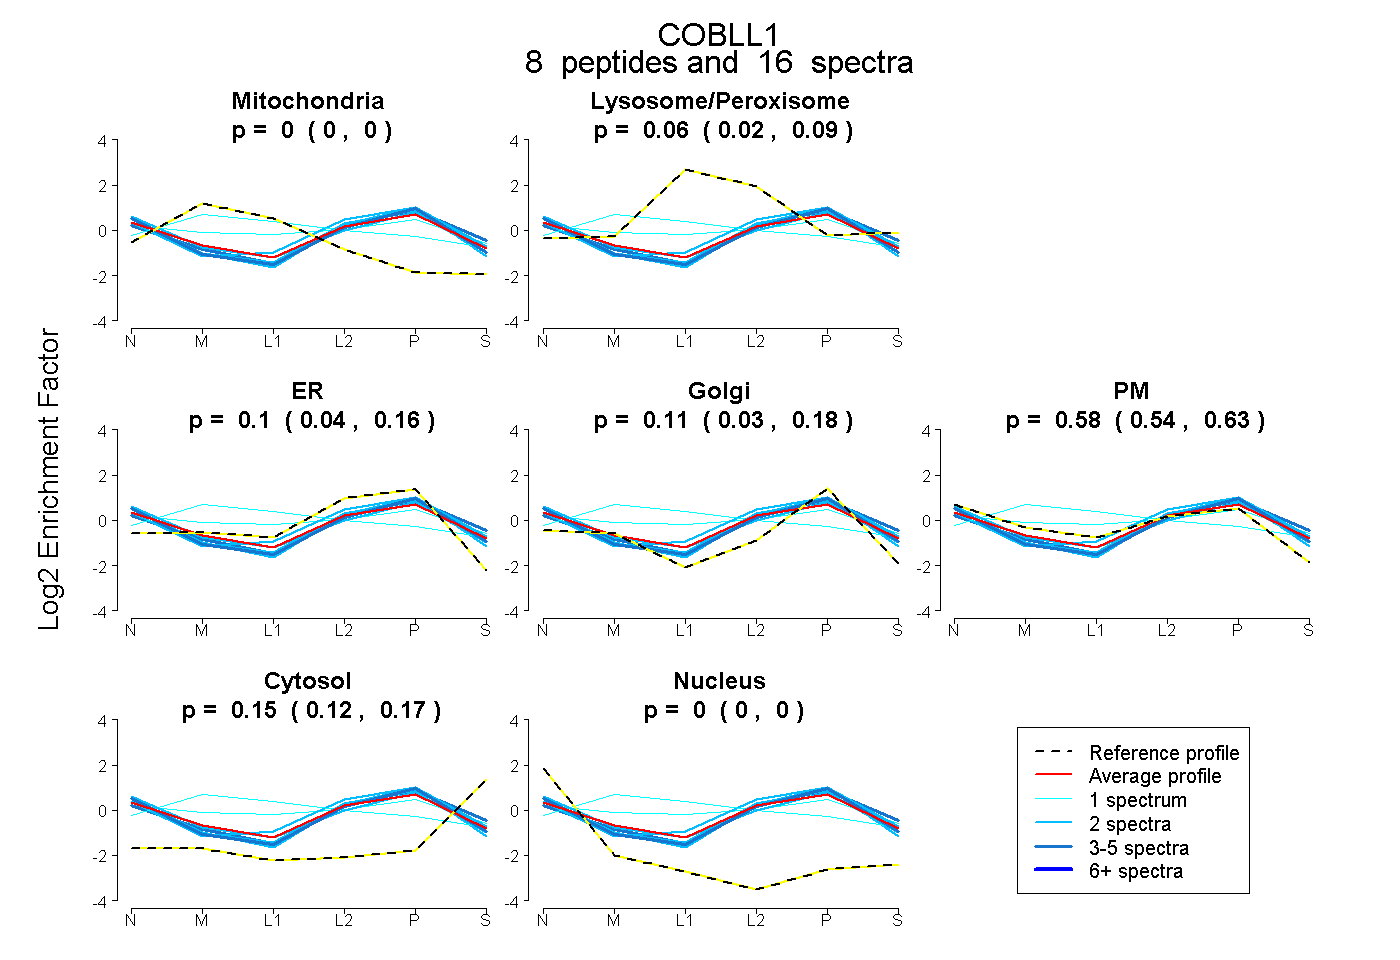
 24
24