 24
24peptides
spectra
0.000 | 0.000
0.000 | 0.000
0.000 | 0.000
0.297 | 0.321
0.000 | 0.000
0.423 | 0.448
0.248 | 0.257
0.000 | 0.000
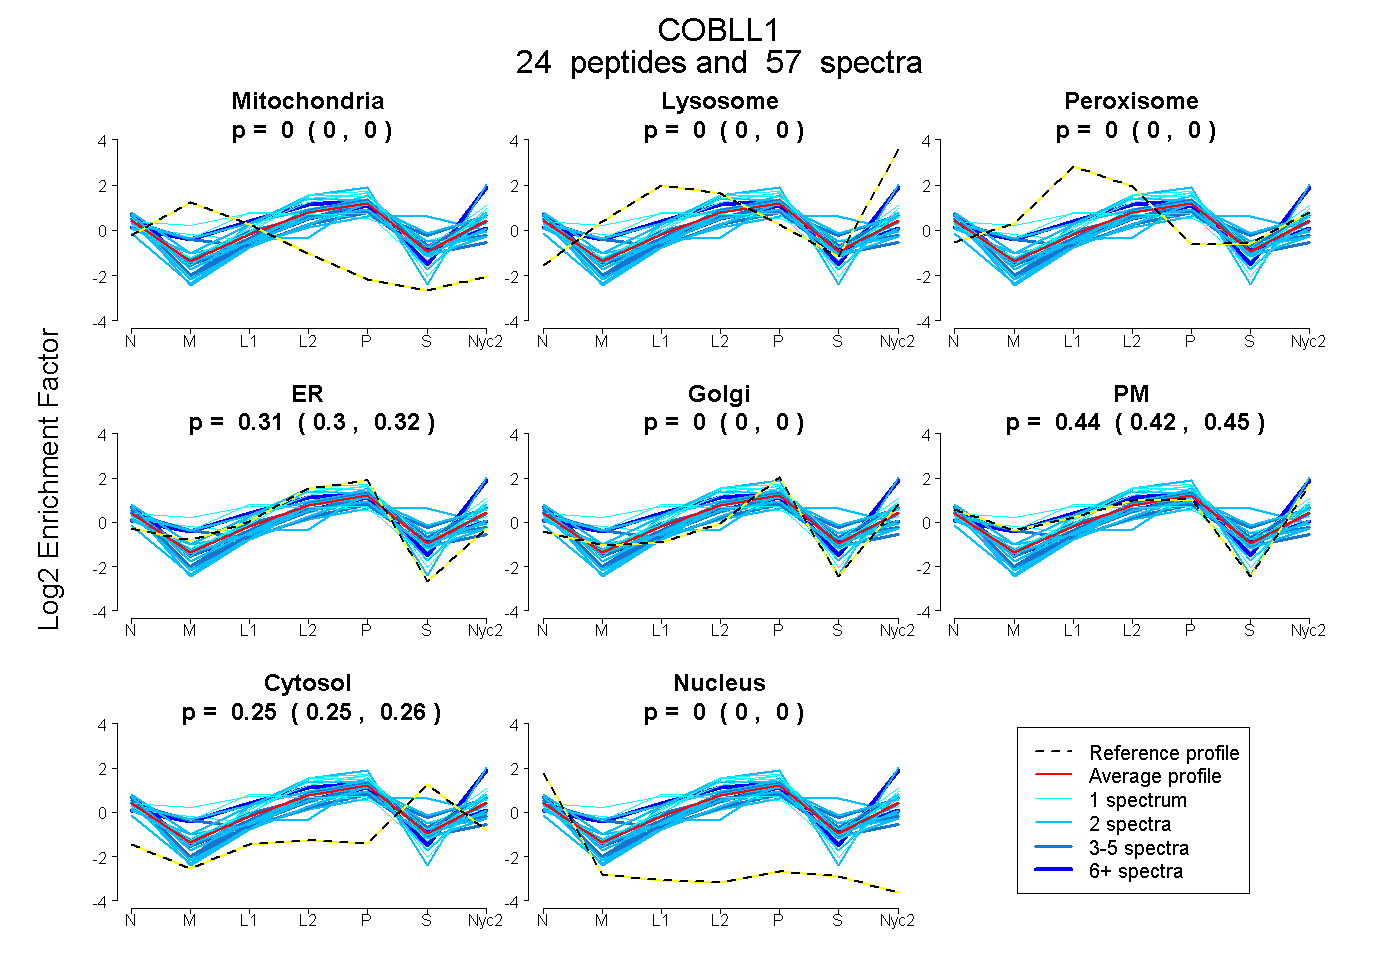
| Plot | Mito | Lyso | Perox | ER | Golgi | PM | Cytosol | Nucleus | |||||
| Expt A |
24 peptides |
57 spectra |
|
0.000 0.000 | 0.000 |
0.000 0.000 | 0.000 |
0.000 0.000 | 0.000 |
0.310 0.297 | 0.321 |
0.000 0.000 | 0.000 |
0.437 0.423 | 0.448 |
0.253 0.248 | 0.257 |
0.000 0.000 | 0.000 |
| 1 spectrum, APLPPAEMK | 0.031 | 0.000 | 0.098 | 0.195 | 0.039 | 0.343 | 0.294 | 0.000 | ||
| 1 spectrum, TPKPSSGTEHPLHR | 0.129 | 0.000 | 0.245 | 0.042 | 0.143 | 0.441 | 0.000 | 0.000 | ||
| 2 spectra, ASCVER | 0.000 | 0.000 | 0.000 | 0.220 | 0.000 | 0.194 | 0.586 | 0.000 | ||
| 2 spectra, SLNDLGLR | 0.000 | 0.000 | 0.000 | 0.375 | 0.000 | 0.338 | 0.197 | 0.089 | ||
| 6 spectra, DWDSEAAGK | 0.000 | 0.231 | 0.000 | 0.056 | 0.090 | 0.580 | 0.042 | 0.000 | ||
| 1 spectrum, NSQQPQPDR | 0.000 | 0.000 | 0.000 | 0.469 | 0.025 | 0.445 | 0.062 | 0.000 | ||
| 6 spectra, ELYAMDISR | 0.000 | 0.000 | 0.000 | 0.332 | 0.000 | 0.361 | 0.276 | 0.030 | ||
| 2 spectra, HRPSFTR | 0.000 | 0.000 | 0.000 | 0.252 | 0.300 | 0.100 | 0.294 | 0.054 | ||
| 3 spectra, ENHLTASPGPDQK | 0.000 | 0.000 | 0.083 | 0.079 | 0.000 | 0.512 | 0.327 | 0.000 | ||
| 2 spectra, IGMTTYK | 0.000 | 0.142 | 0.000 | 0.174 | 0.138 | 0.546 | 0.000 | 0.000 | ||
| 2 spectra, STSVDDTDK | 0.000 | 0.006 | 0.000 | 0.207 | 0.000 | 0.436 | 0.350 | 0.000 | ||
| 1 spectrum, SGEAAAK | 0.000 | 0.074 | 0.000 | 0.445 | 0.000 | 0.302 | 0.178 | 0.000 | ||
| 2 spectra, EQTASAPATPLVSK | 0.000 | 0.000 | 0.000 | 0.362 | 0.139 | 0.093 | 0.369 | 0.037 | ||
| 3 spectra, DYQAQEPLDLTK | 0.100 | 0.000 | 0.000 | 0.374 | 0.030 | 0.224 | 0.226 | 0.047 | ||
| 1 spectrum, SQSFSK | 0.000 | 0.133 | 0.009 | 0.344 | 0.000 | 0.348 | 0.166 | 0.000 | ||
| 1 spectrum, EMEATIEGEAQK | 0.000 | 0.000 | 0.356 | 0.131 | 0.000 | 0.304 | 0.197 | 0.012 | ||
| 2 spectra, NPAASSLK | 0.000 | 0.000 | 0.001 | 0.269 | 0.000 | 0.513 | 0.218 | 0.000 | ||
| 2 spectra, LSGSPAGR | 0.000 | 0.000 | 0.000 | 0.454 | 0.180 | 0.060 | 0.305 | 0.000 | ||
| 1 spectrum, TVSSPVGTEMNPPKPPR | 0.000 | 0.041 | 0.000 | 0.396 | 0.000 | 0.444 | 0.118 | 0.000 | ||
| 2 spectra, QSLLTAIR | 0.000 | 0.000 | 0.138 | 0.364 | 0.000 | 0.465 | 0.032 | 0.000 | ||
| 5 spectra, MDDVQSSR | 0.000 | 0.000 | 0.000 | 0.222 | 0.000 | 0.502 | 0.276 | 0.000 | ||
| 4 spectra, SQGTSTYVQDR | 0.000 | 0.000 | 0.000 | 0.353 | 0.000 | 0.380 | 0.268 | 0.000 | ||
| 2 spectra, VGDVEAER | 0.000 | 0.000 | 0.000 | 0.423 | 0.000 | 0.311 | 0.247 | 0.019 | ||
| 3 spectra, GNTPEGR | 0.000 | 0.000 | 0.000 | 0.435 | 0.022 | 0.186 | 0.330 | 0.028 |
| Plot | Mito | Lyso or Perox | ER | Golgi | PM | Cytosol | Nucleus | ||||||
| Expt B |
8 peptides |
16 spectra |
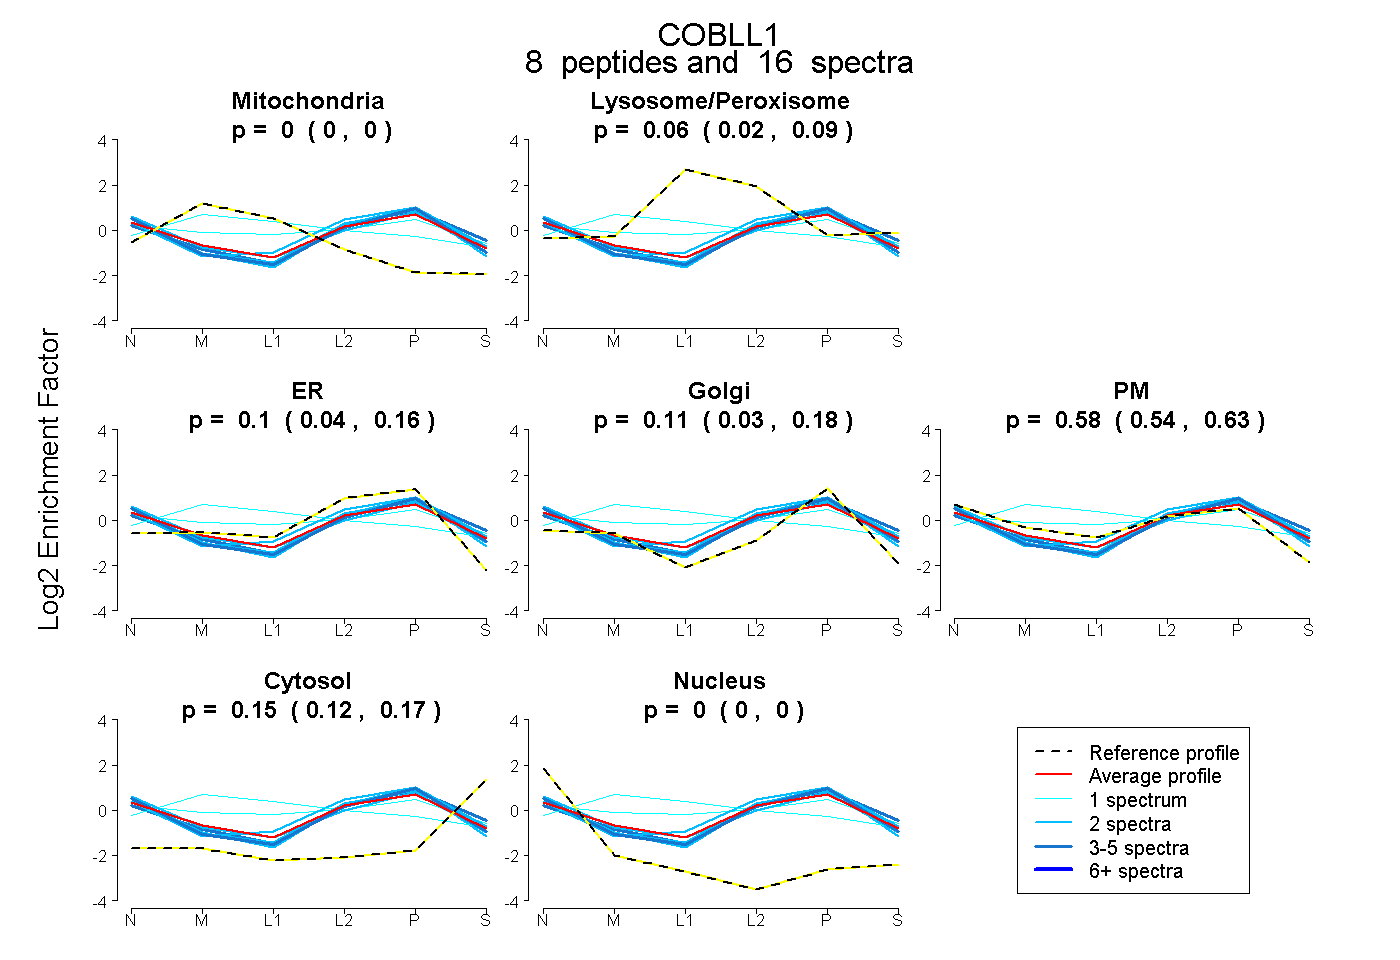 |
0.000 0.000 | 0.000 |
0.055 0.019 | 0.088 |
0.100 0.038 | 0.156 |
0.114 0.034 | 0.181 |
0.585 0.537 | 0.626 |
0.146 0.121 | 0.167 |
0.000 0.000 | 0.000 |
|||
| Plot | Lyso | Other | |||||||||||
| Expt C |
26 peptides |
105 spectra |
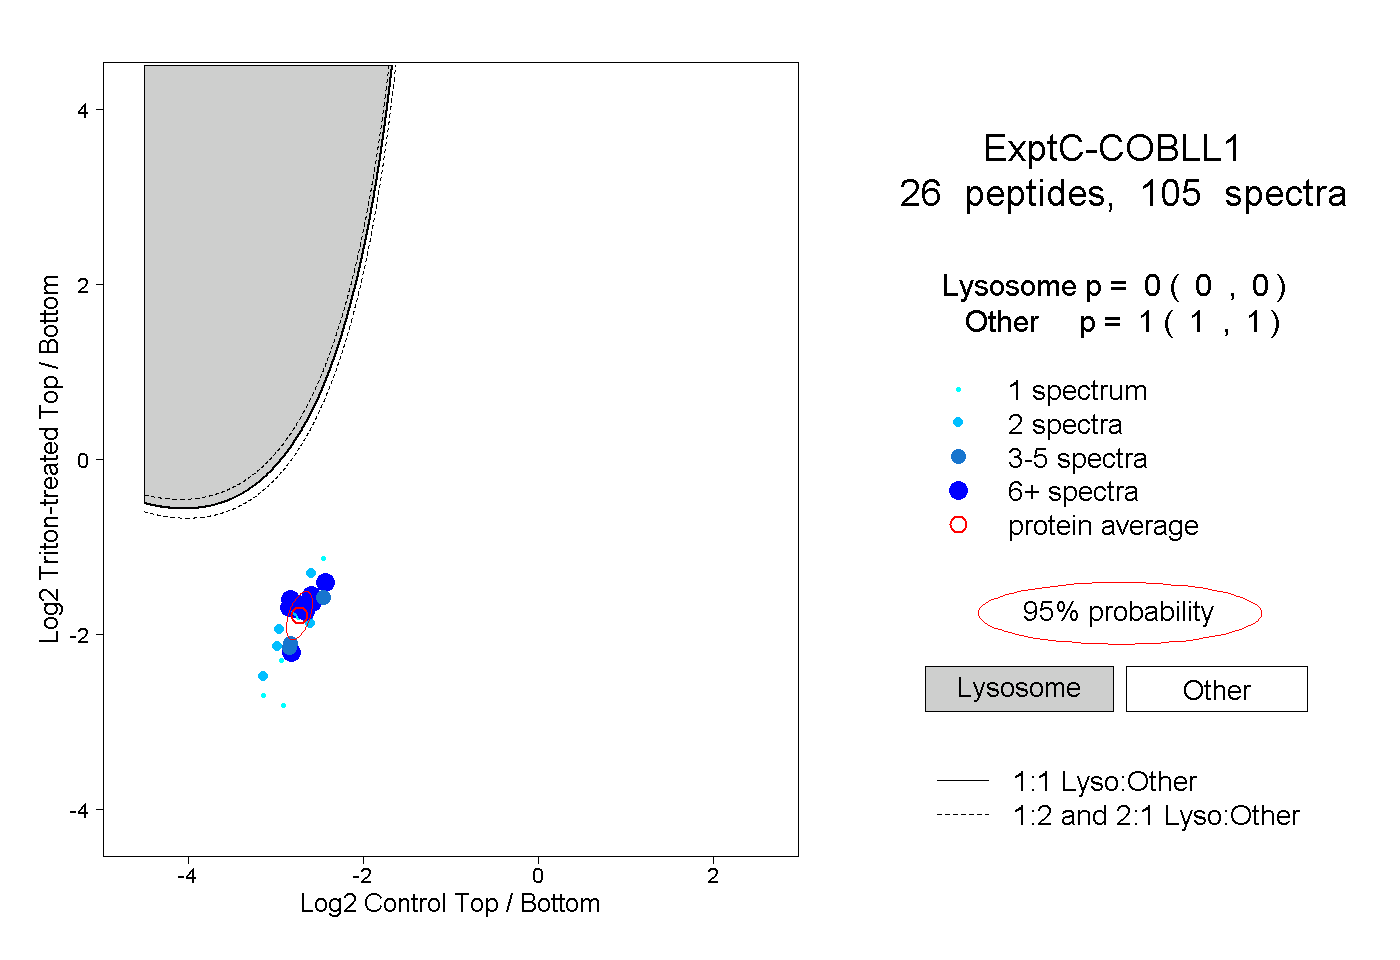 |
0.000 0.000 | 0.000 |
1.000 1.000 | 1.000 |
||||||||
| Plot | Lyso | Other | |||||||||||
| Expt D |
6 peptides |
7 spectra |
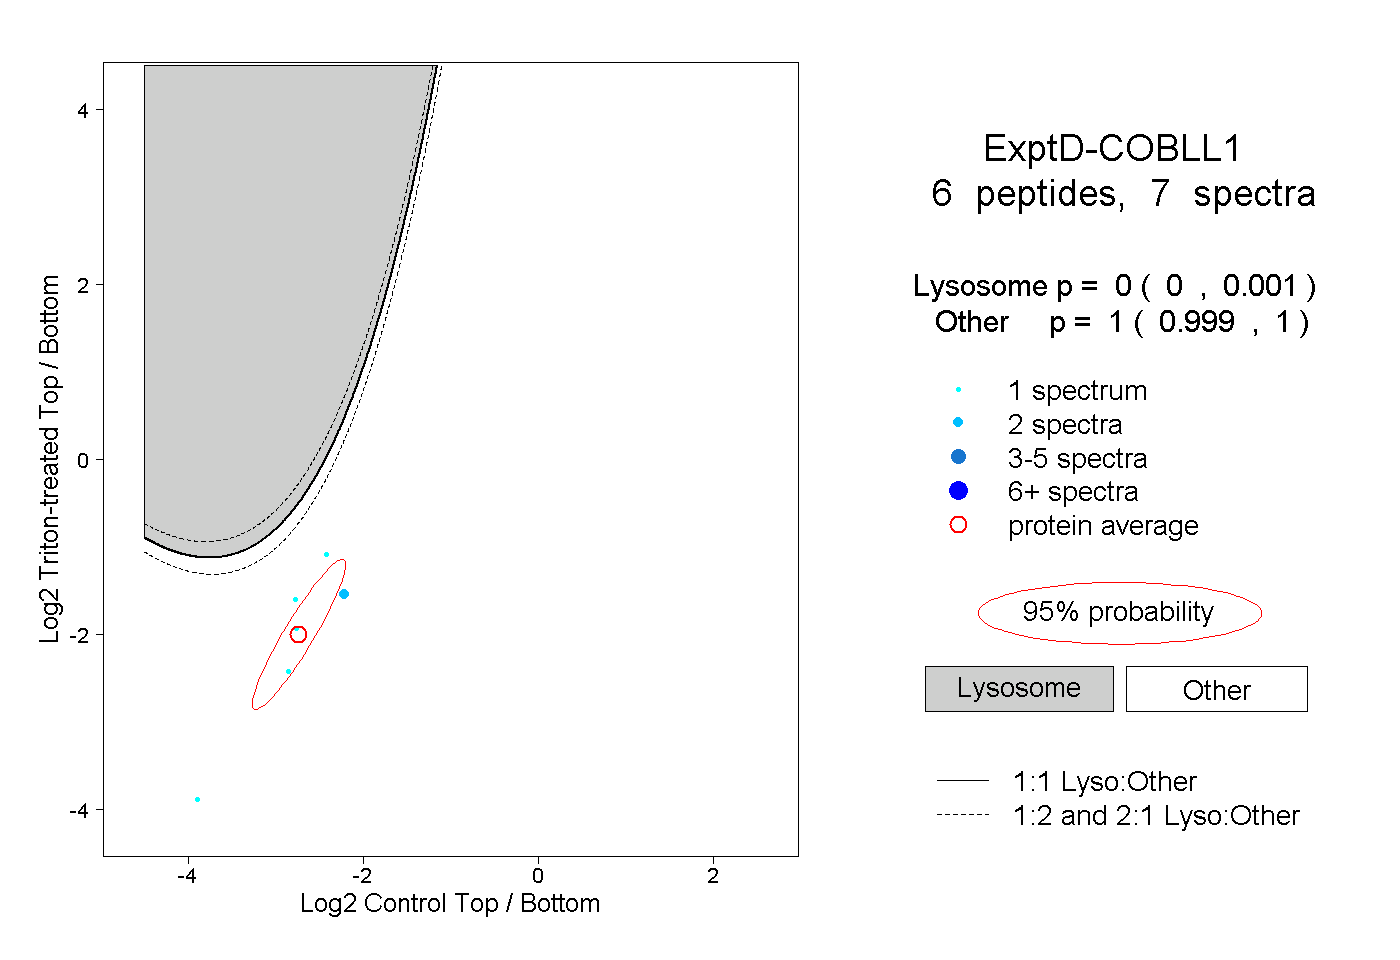 |
0.000 0.000 | 0.001 |
1.000 0.999 | 1.000 |