 14
14peptides
spectra
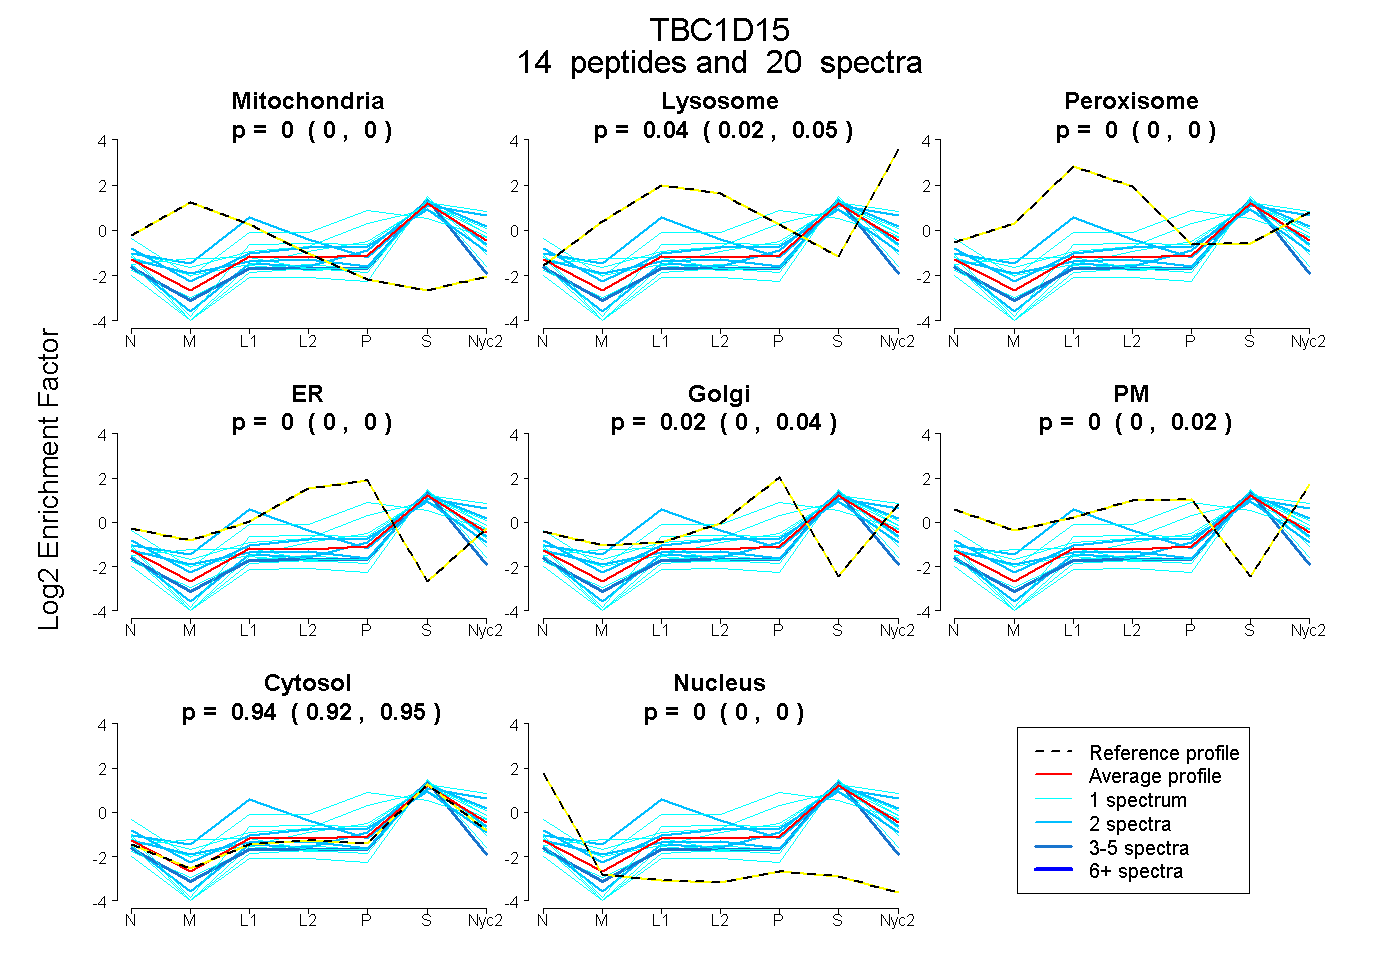
0.000 | 0.000
0.020 | 0.054
0.000 | 0.000
0.000 | 0.000
0.000 | 0.038
0.000 | 0.020
0.924 | 0.950
0.000 | 0.000
3peptides
spectra
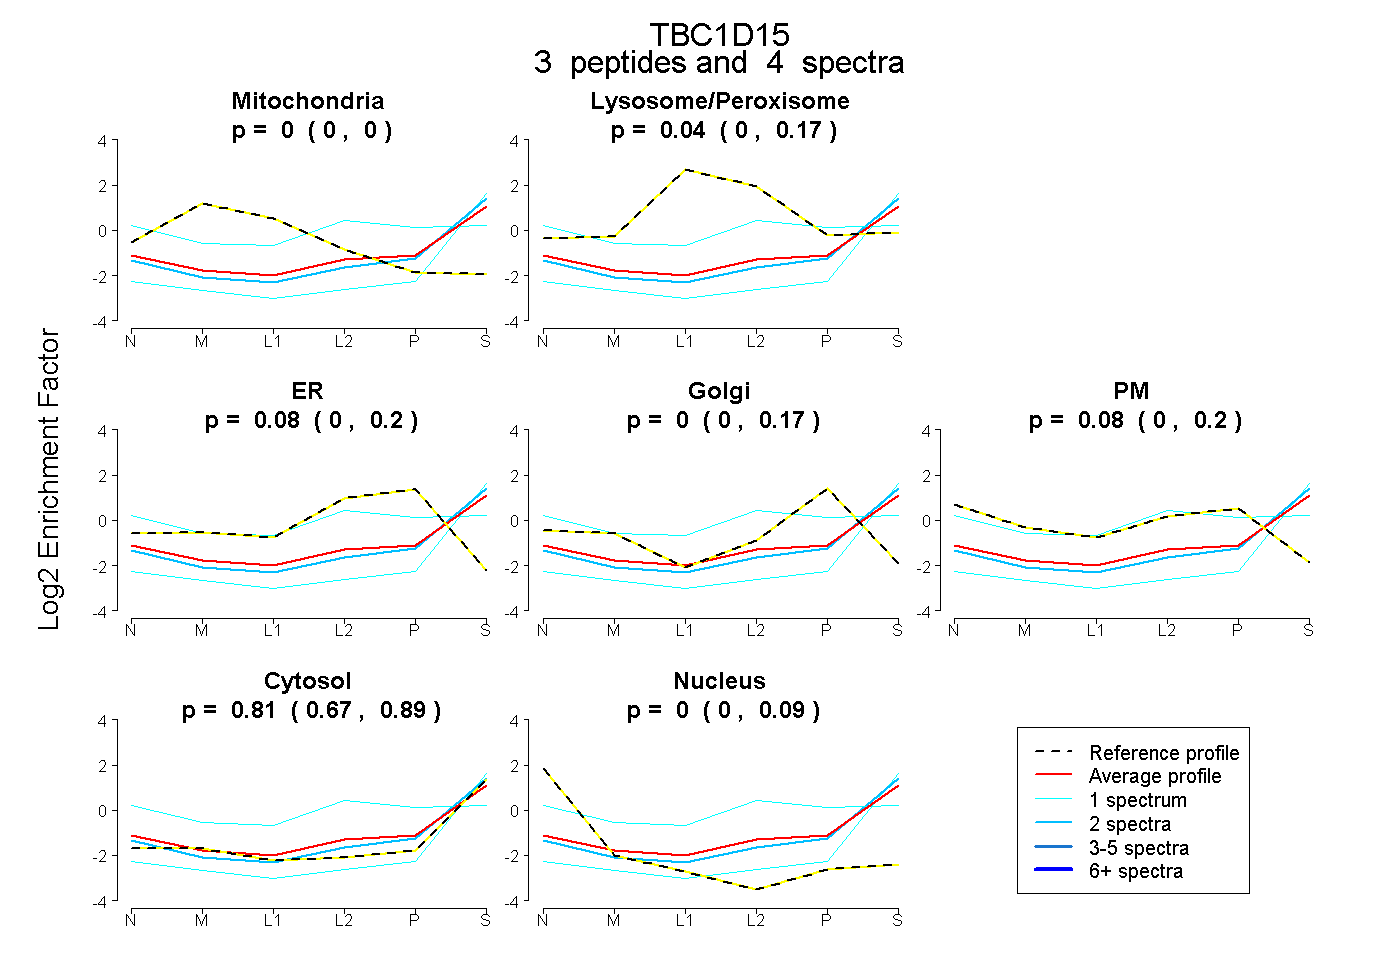
0.000 | 0.000
0.000 | 0.165
0.000 | 0.197
0.000 | 0.169
0.000 | 0.196
0.668 | 0.885
0.000 | 0.089
11peptides
spectra
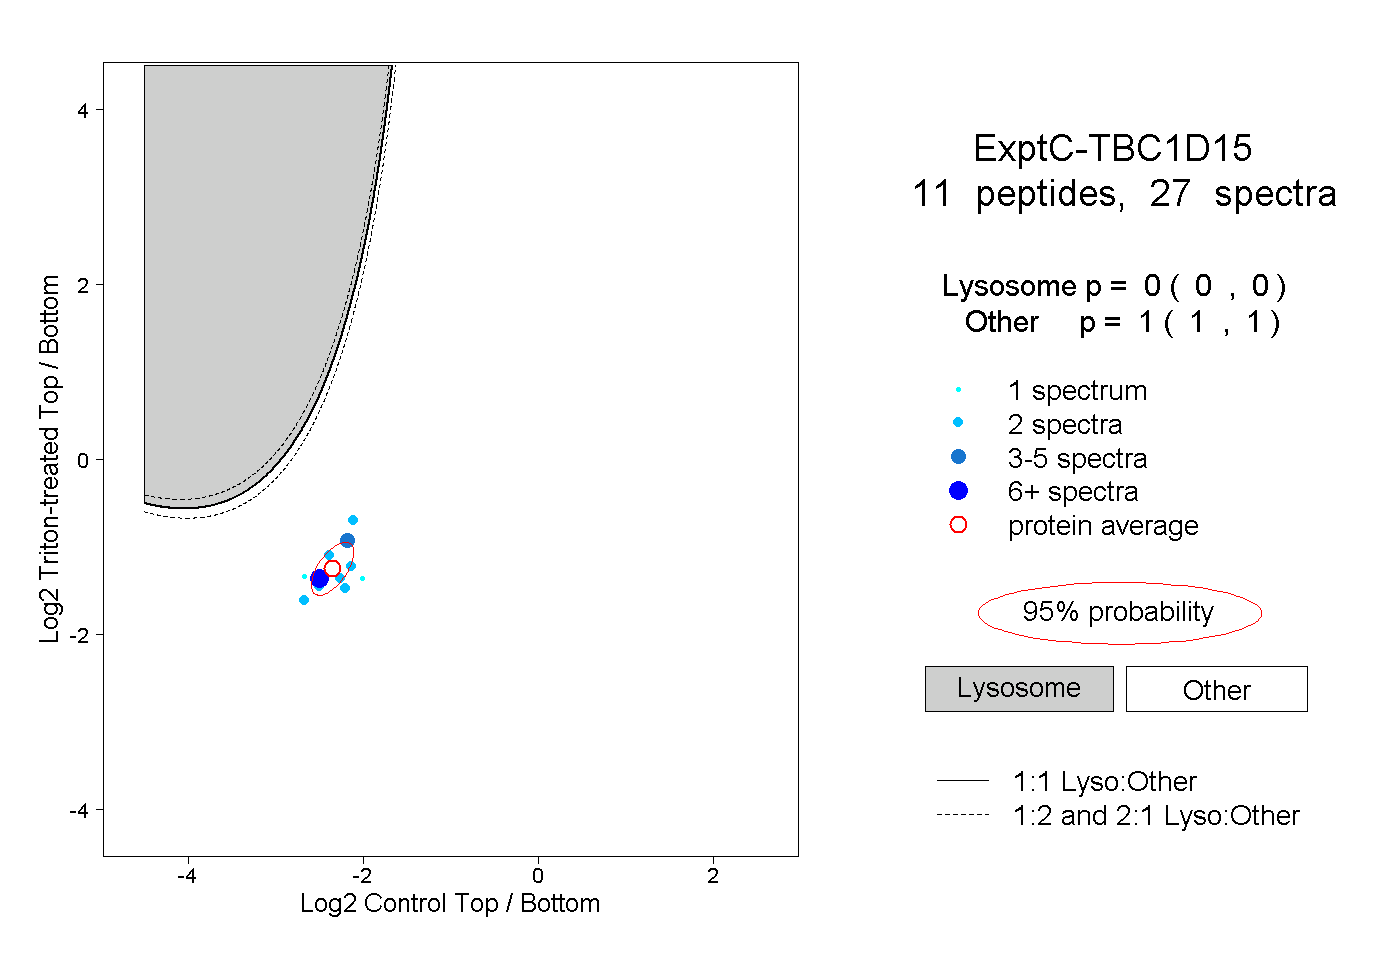
0.000 | 0.000
1.000 | 1.000