 14
14peptides
spectra
0.000 | 0.000
0.020 | 0.054
0.000 | 0.000
0.000 | 0.000
0.000 | 0.038
0.000 | 0.020
0.924 | 0.950
0.000 | 0.000
| Plot | Mito | Lyso | Perox | ER | Golgi | PM | Cytosol | Nucleus | |||||
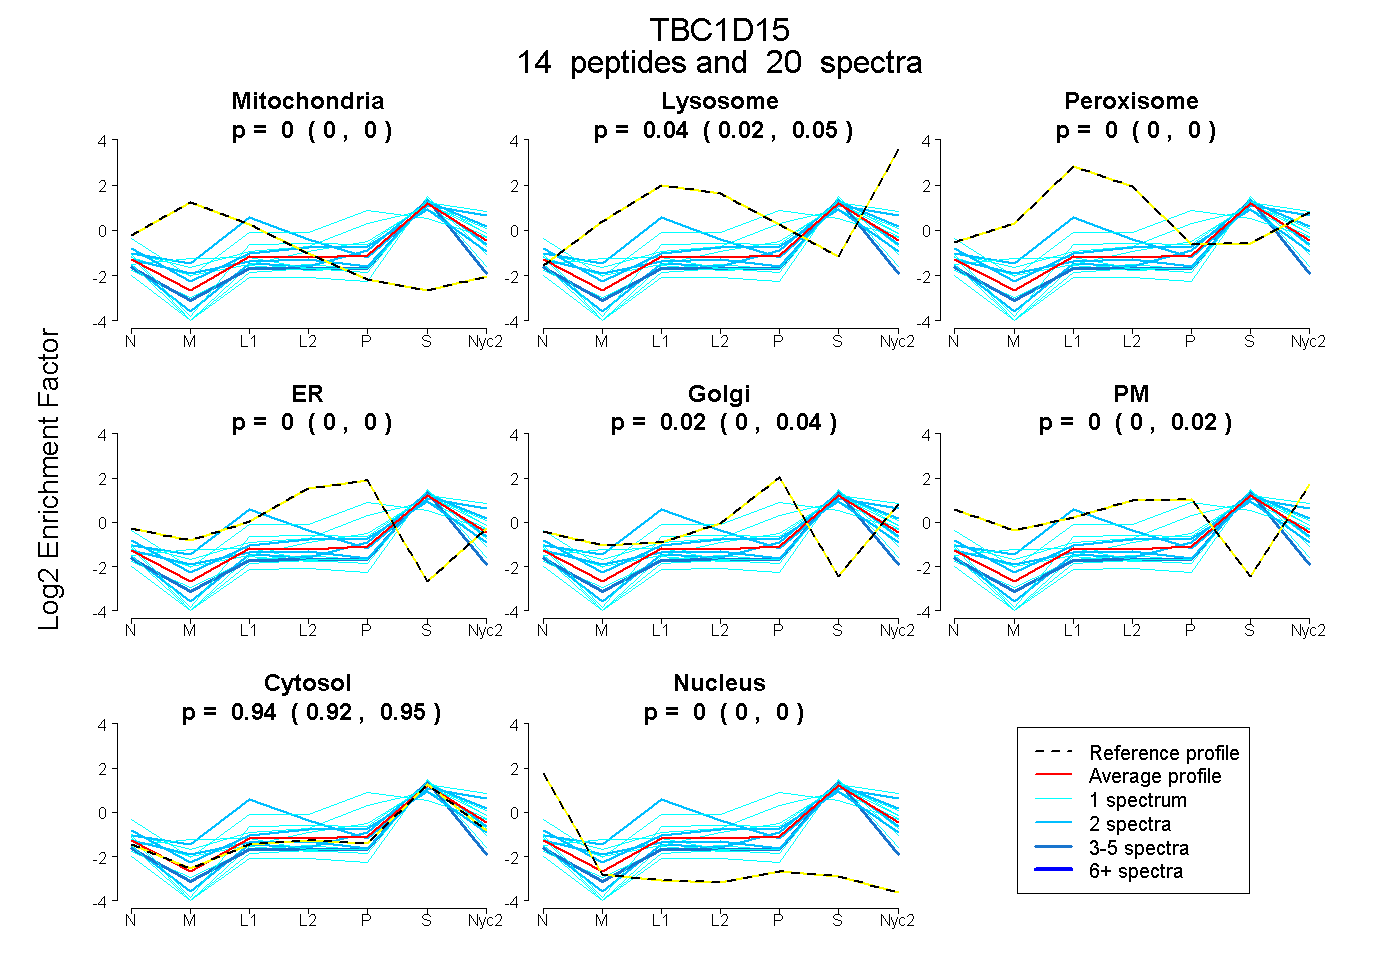
| Expt A |
14 peptides |
20 spectra |
|
0.000 0.000 | 0.000 |
0.040 0.020 | 0.054 |
0.000 0.000 | 0.000 |
0.000 0.000 | 0.000 |
0.021 0.000 | 0.038 |
0.000 0.000 | 0.020 |
0.939 0.924 | 0.950 |
0.000 0.000 | 0.000 |
| 1 spectrum, ANDQDSLISGILR | 0.000 | 0.000 | 0.000 | 0.000 | 0.000 | 0.000 | 0.956 | 0.044 | ||
| 1 spectrum, FLLGYFPWDSTK | 0.000 | 0.000 | 0.000 | 0.000 | 0.000 | 0.000 | 1.000 | 0.000 | ||
| 2 spectra, IDLGERPVVQR | 0.000 | 0.000 | 0.000 | 0.000 | 0.000 | 0.000 | 1.000 | 0.000 | ||
| 2 spectra, TQLIQLSTLLR | 0.000 | 0.104 | 0.000 | 0.000 | 0.000 | 0.000 | 0.896 | 0.000 | ||
| 2 spectra, YVVLCESSQDSR | 0.000 | 0.000 | 0.035 | 0.133 | 0.000 | 0.000 | 0.819 | 0.013 | ||
| 1 spectrum, AEAISLQMAQCK | 0.000 | 0.014 | 0.067 | 0.000 | 0.259 | 0.000 | 0.659 | 0.000 | ||
| 3 spectra, IDVEDILCK | 0.000 | 0.000 | 0.000 | 0.000 | 0.000 | 0.000 | 0.916 | 0.084 | ||
| 1 spectrum, LLIESLGK | 0.092 | 0.076 | 0.000 | 0.000 | 0.000 | 0.000 | 0.833 | 0.000 | ||
| 1 spectrum, EFSFLDILR | 0.000 | 0.000 | 0.000 | 0.000 | 0.000 | 0.000 | 0.953 | 0.047 | ||
| 1 spectrum, TLLVNCQNK | 0.000 | 0.000 | 0.000 | 0.000 | 0.000 | 0.000 | 0.916 | 0.084 | ||
| 2 spectra, HYGFNEILK | 0.000 | 0.157 | 0.244 | 0.000 | 0.000 | 0.000 | 0.599 | 0.000 | ||
| 1 spectrum, VTNYIFDSLR | 0.000 | 0.170 | 0.000 | 0.000 | 0.000 | 0.000 | 0.830 | 0.000 | ||
| 1 spectrum, SLSQSFENLLDEPAYGLIQK | 0.000 | 0.000 | 0.118 | 0.245 | 0.123 | 0.000 | 0.515 | 0.000 | ||
| 1 spectrum, SVSEAQEK | 0.000 | 0.079 | 0.000 | 0.000 | 0.119 | 0.000 | 0.802 | 0.000 |
| Plot | Mito | Lyso or Perox | ER | Golgi | PM | Cytosol | Nucleus | ||||||
| Expt B |
3 peptides |
4 spectra |
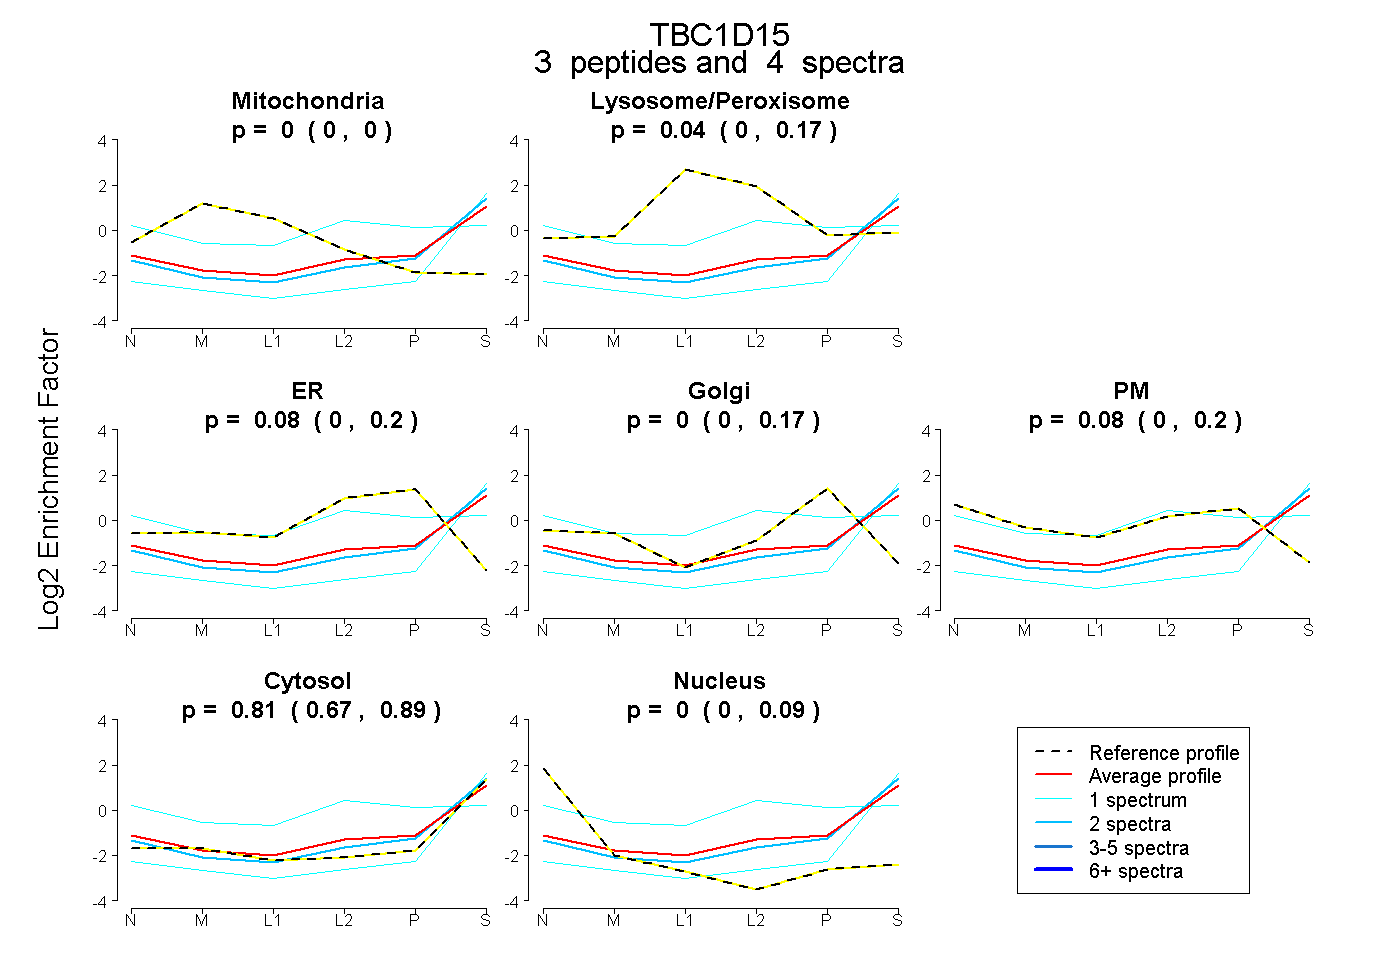 |
0.000 0.000 | 0.000 |
0.035 0.000 | 0.165 |
0.076 0.000 | 0.197 |
0.000 0.000 | 0.169 |
0.076 0.000 | 0.196 |
0.813 0.668 | 0.885 |
0.000 0.000 | 0.089 |
|||
| Plot | Lyso | Other | |||||||||||
| Expt C |
11 peptides |
27 spectra |
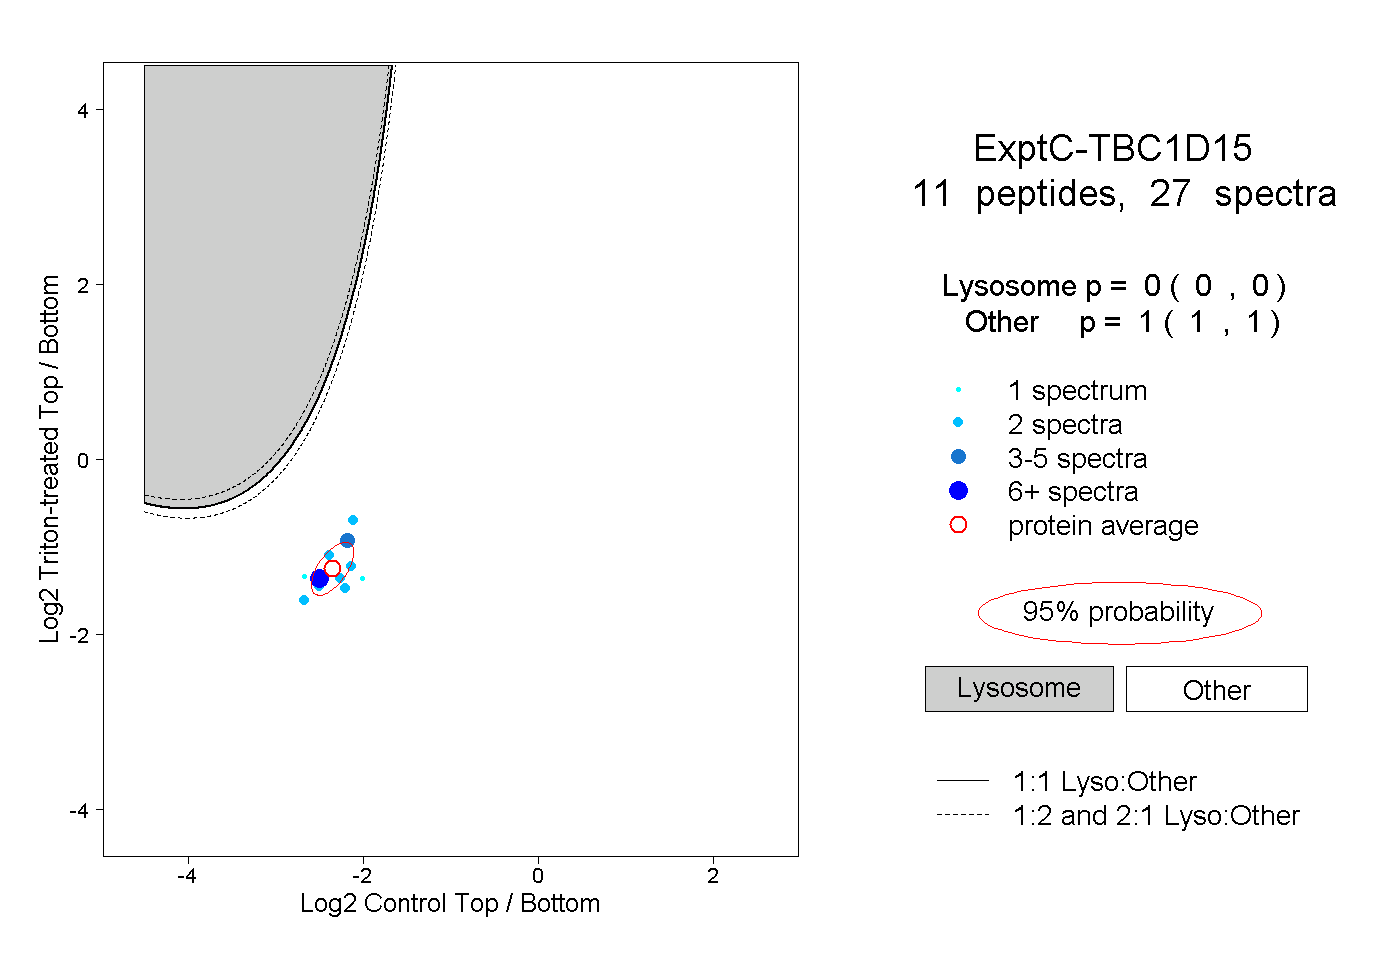 |
0.000 0.000 | 0.000 |
1.000 1.000 | 1.000 |