TBC1D15
[ENSRNOP00000058848]
Main page
| | | Plot |
Mito |
Lyso |
|
Perox |
ER |
Golgi |
PM |
Cytosol |
Nucleus |
|
| Expt A |
 14
14
peptides |
20
spectra |
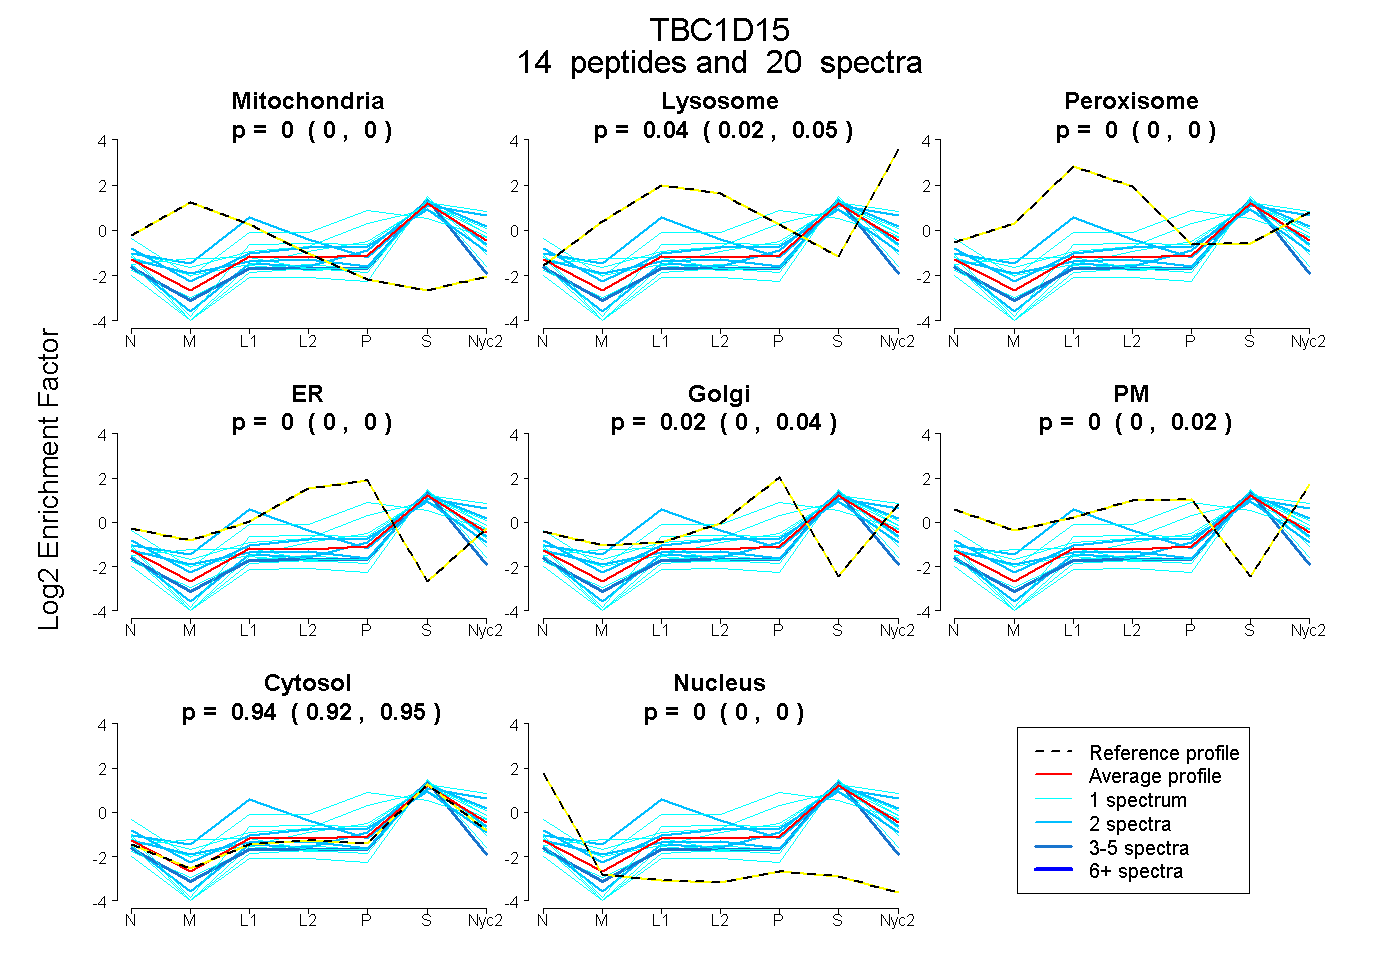 |
0.000
0.000 | 0.000 |
0.040
0.020 | 0.054 |
|
0.000
0.000 | 0.000 |
0.000
0.000 | 0.000 |
0.021
0.000 | 0.038 |
0.000
0.000 | 0.020 |
0.939
0.924 | 0.950 |
0.000
0.000 | 0.000 |
|
| | | Plot |
Mito |
|
Lyso or Perox |
|
ER |
Golgi |
PM |
Cytosol |
Nucleus |
|
| Expt B |
3
peptides |
4
spectra |
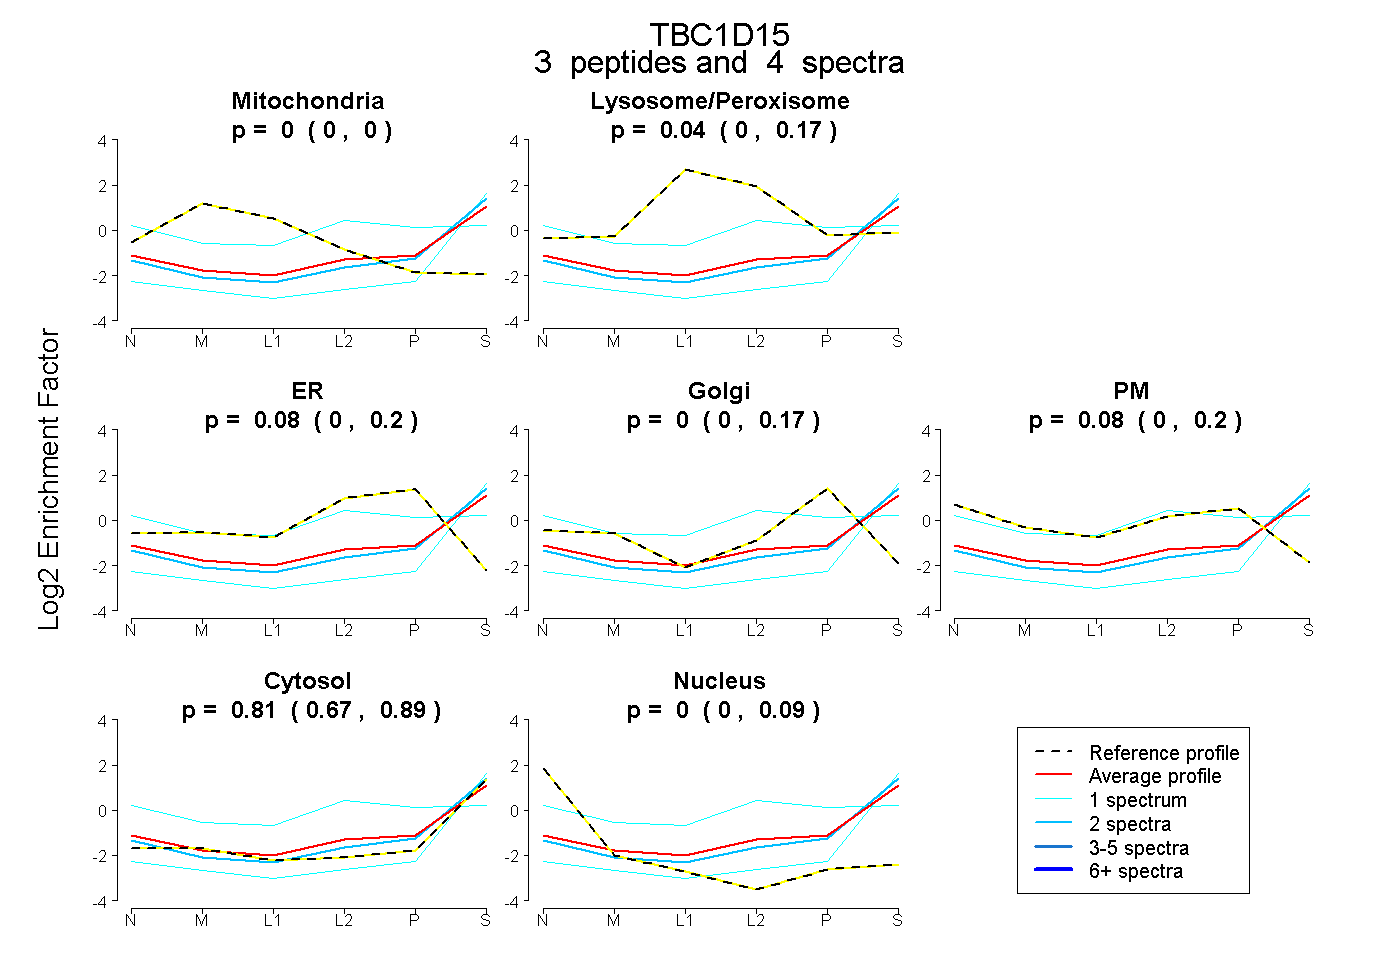 |
0.000
0.000 | 0.000 |
|
0.035
0.000 | 0.165 |
|
0.076
0.000 | 0.197 |
0.000
0.000 | 0.169 |
0.076
0.000 | 0.196 |
0.813
0.668 | 0.885 |
0.000
0.000 | 0.089 |
|
| 2 spectra, VTNYIFDSLR |
0.000 |
|
0.000 |
|
0.071 |
0.003 |
0.000 |
0.926 |
0.000 |
|
| 1 spectrum, YVVLCESSQDSR |
0.000 |
|
0.259 |
|
0.000 |
0.000 |
0.476 |
0.266 |
0.000 |
|
| 1 spectrum, IDVEDILCK |
0.000 |
|
0.000 |
|
0.000 |
0.000 |
0.000 |
1.000 |
0.000 |
|
| | | Plot |
|
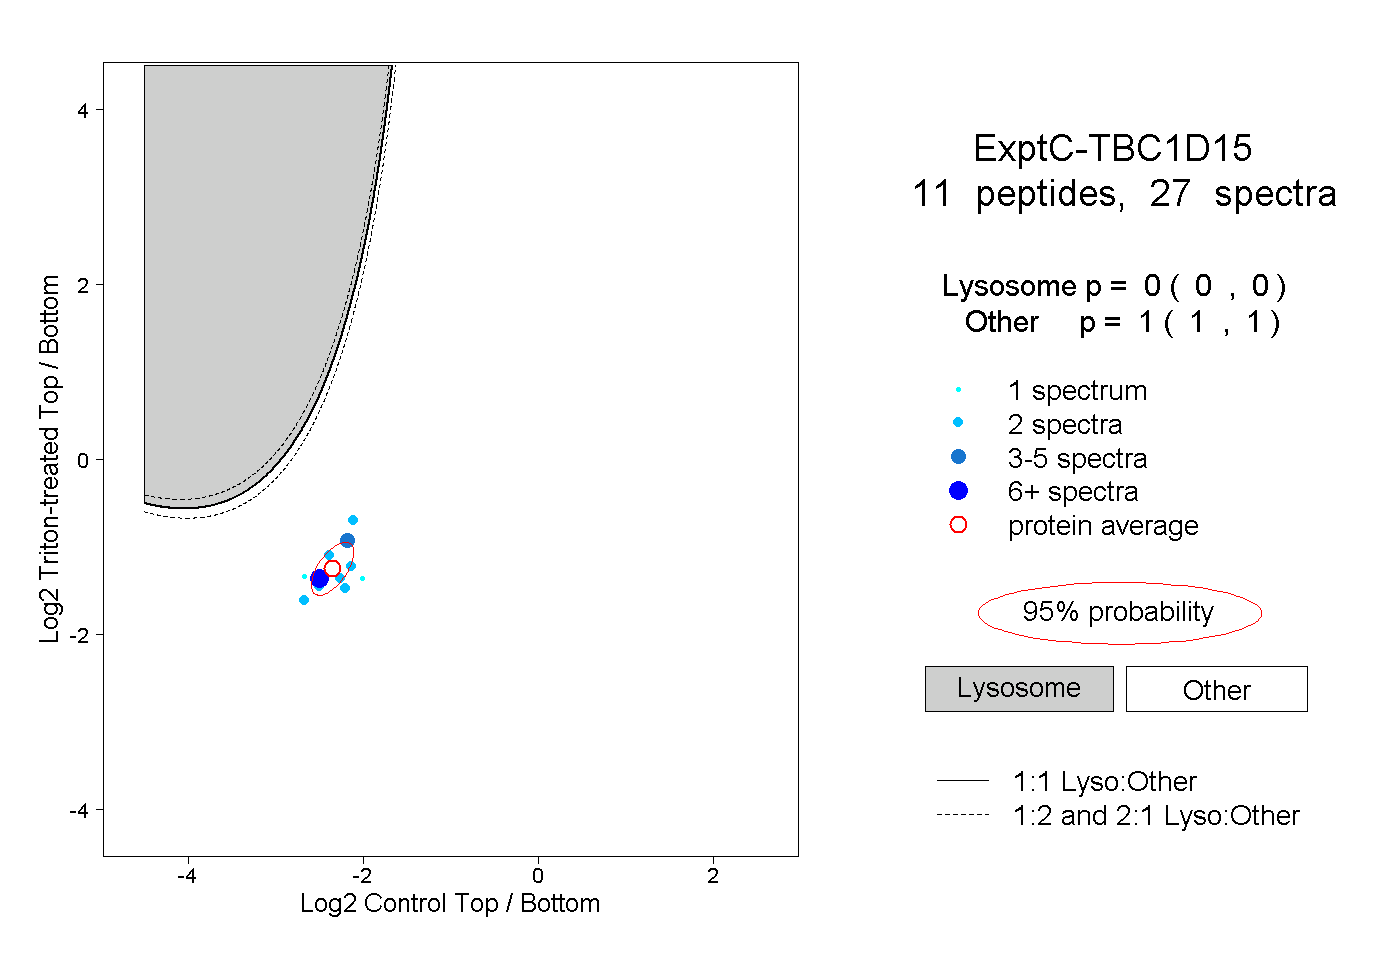
Lyso |
|
|
|
|
|
|
|
Other |
| Expt C |
11
peptides |
27
spectra |
 |
|
0.000
0.000 | 0.000 |
|
|
|
|
|
|
|
1.000
1.000 | 1.000 |