 25
25peptides
spectra
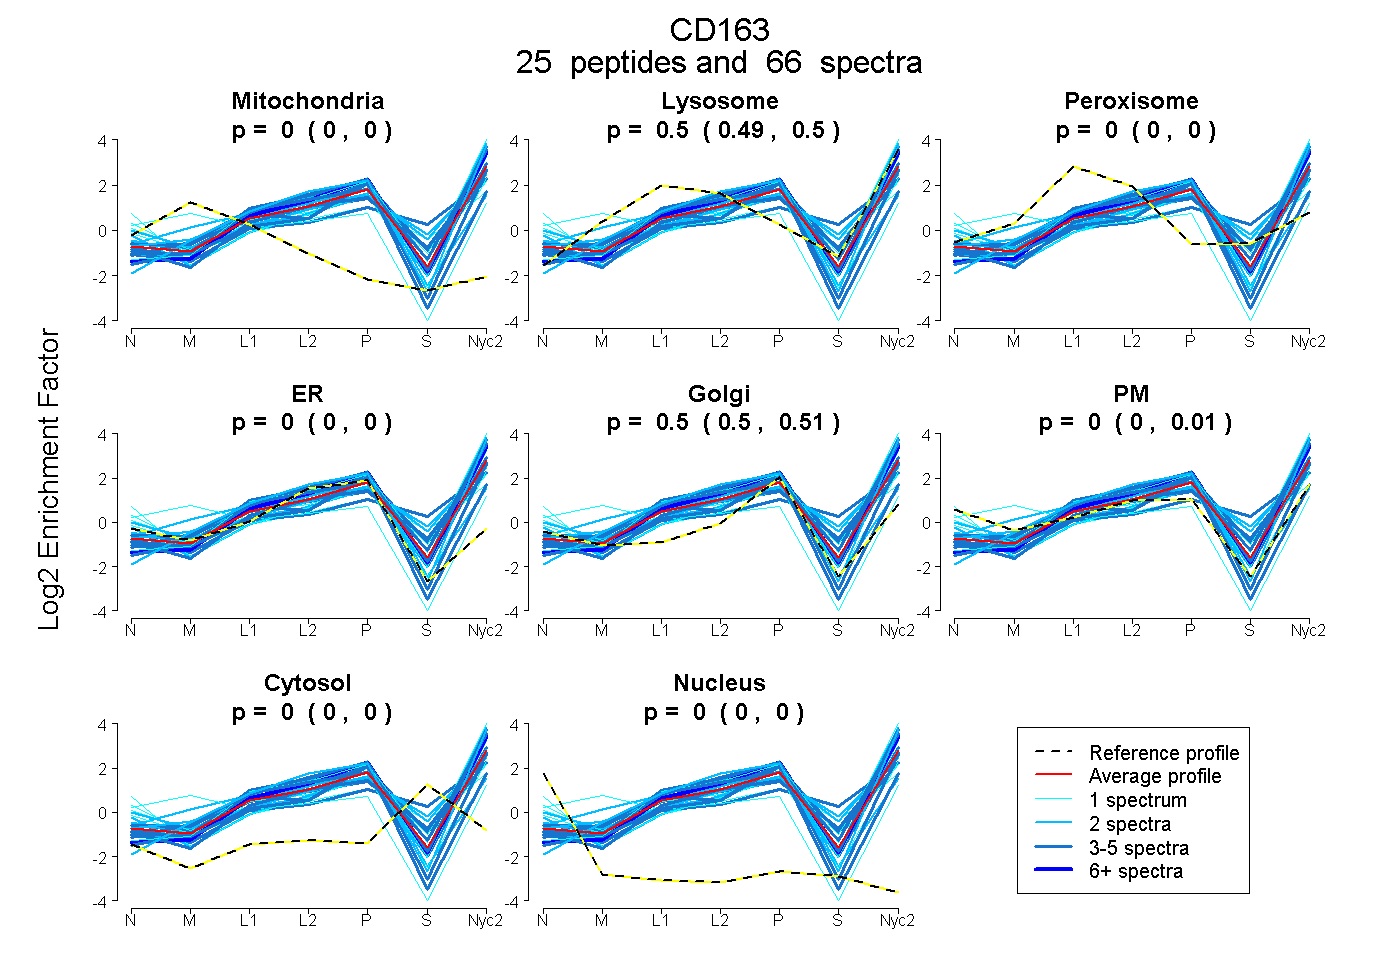
0.000 | 0.000
0.491 | 0.502
0.000 | 0.000
0.000 | 0.000
0.495 | 0.506
0.000 | 0.006
0.000 | 0.000
0.000 | 0.000
3peptides
spectra
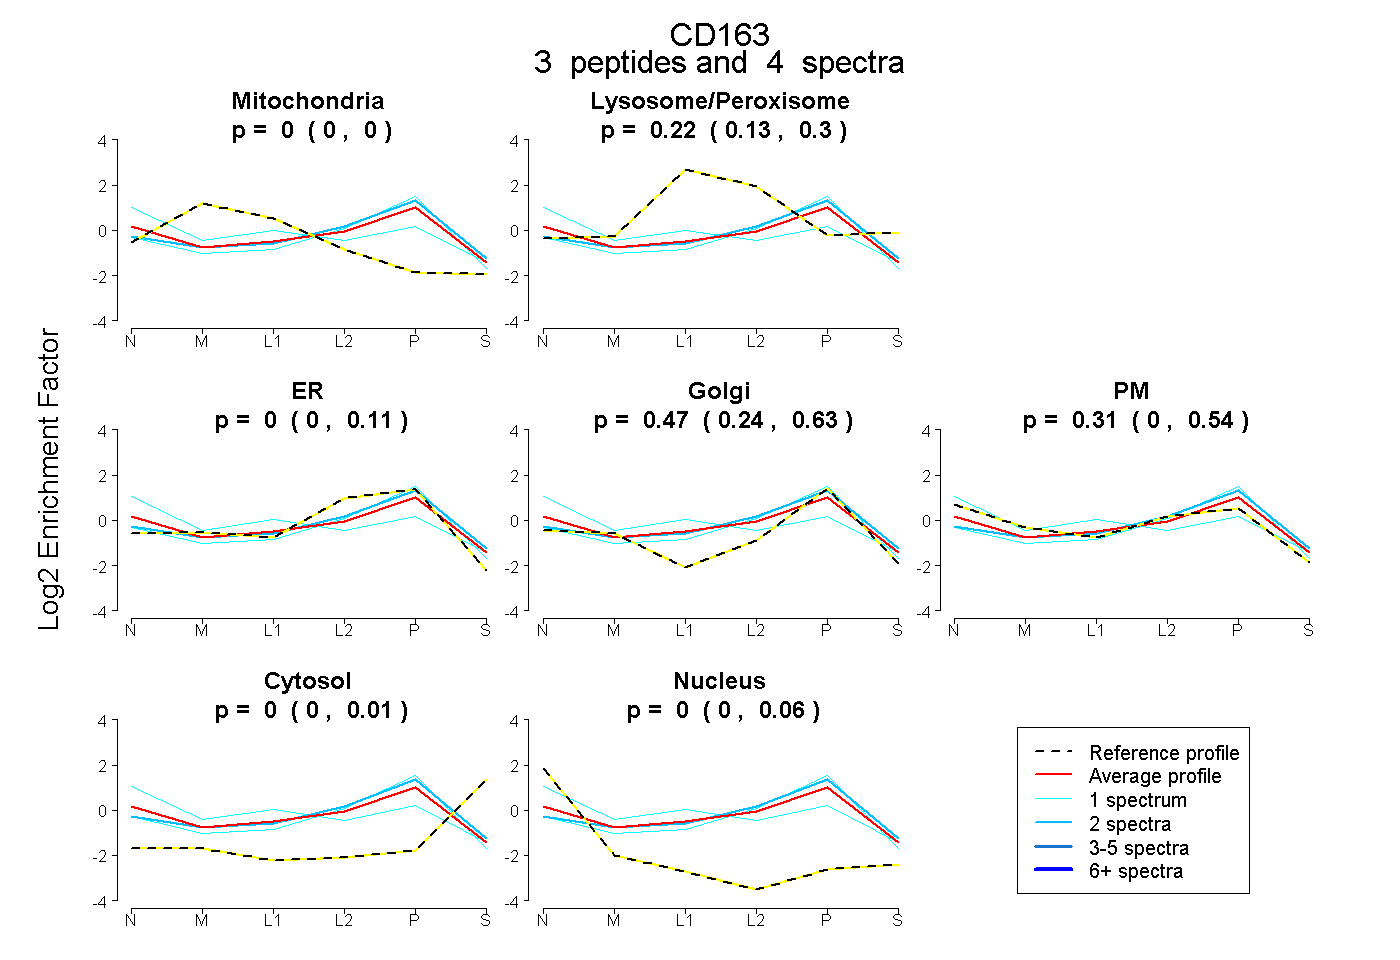
0.000 | 0.000
0.126 | 0.299
0.000 | 0.112
0.237 | 0.634
0.000 | 0.538
0.000 | 0.006
0.000 | 0.063
24peptides
spectra
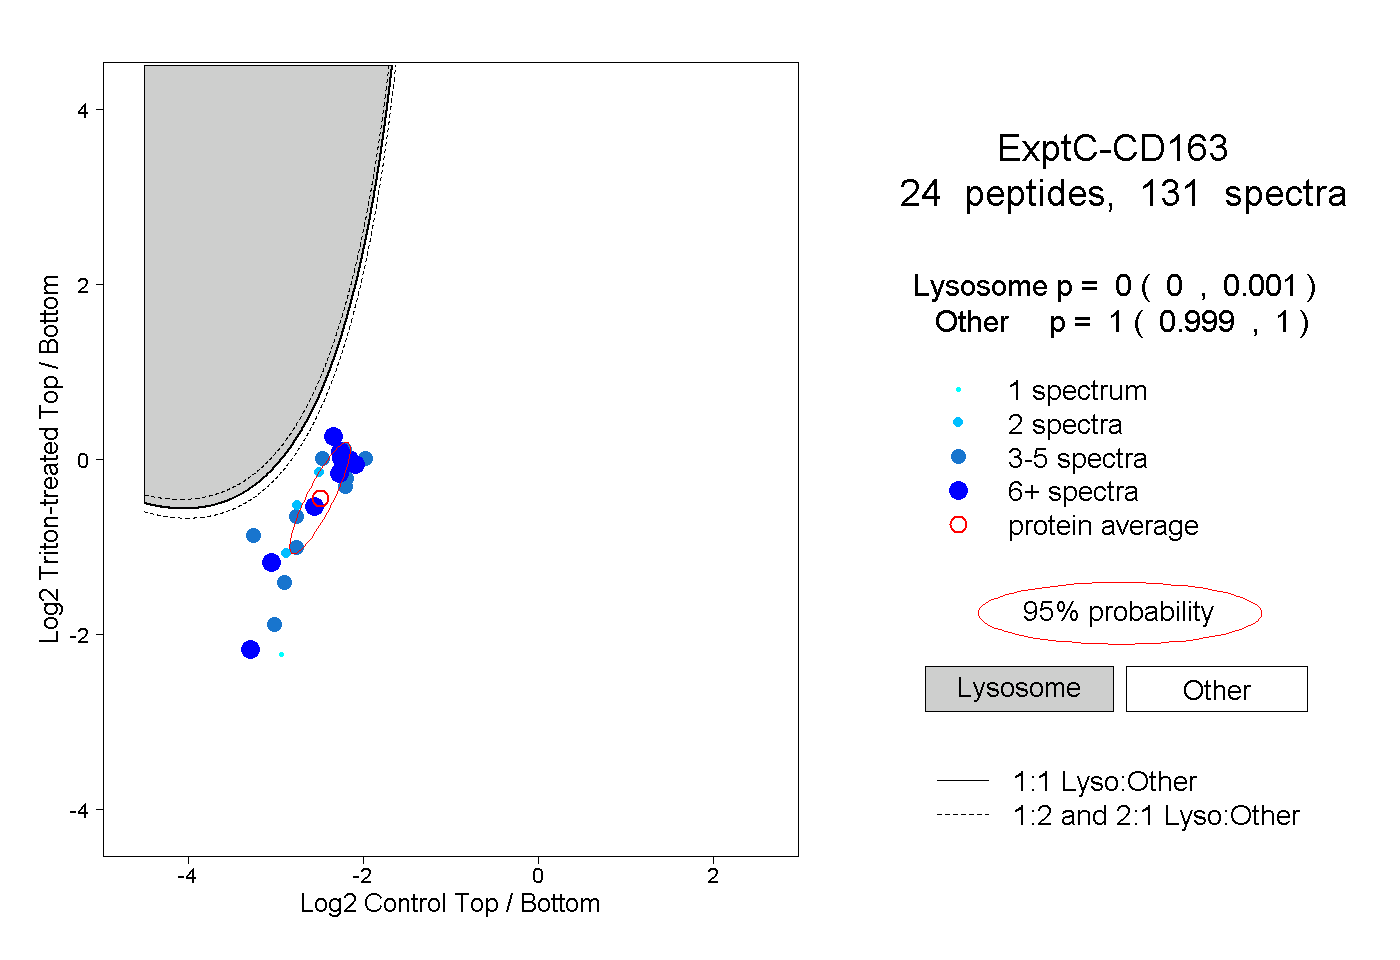
0.000 | 0.001
0.999 | 1.000
5peptides
spectra
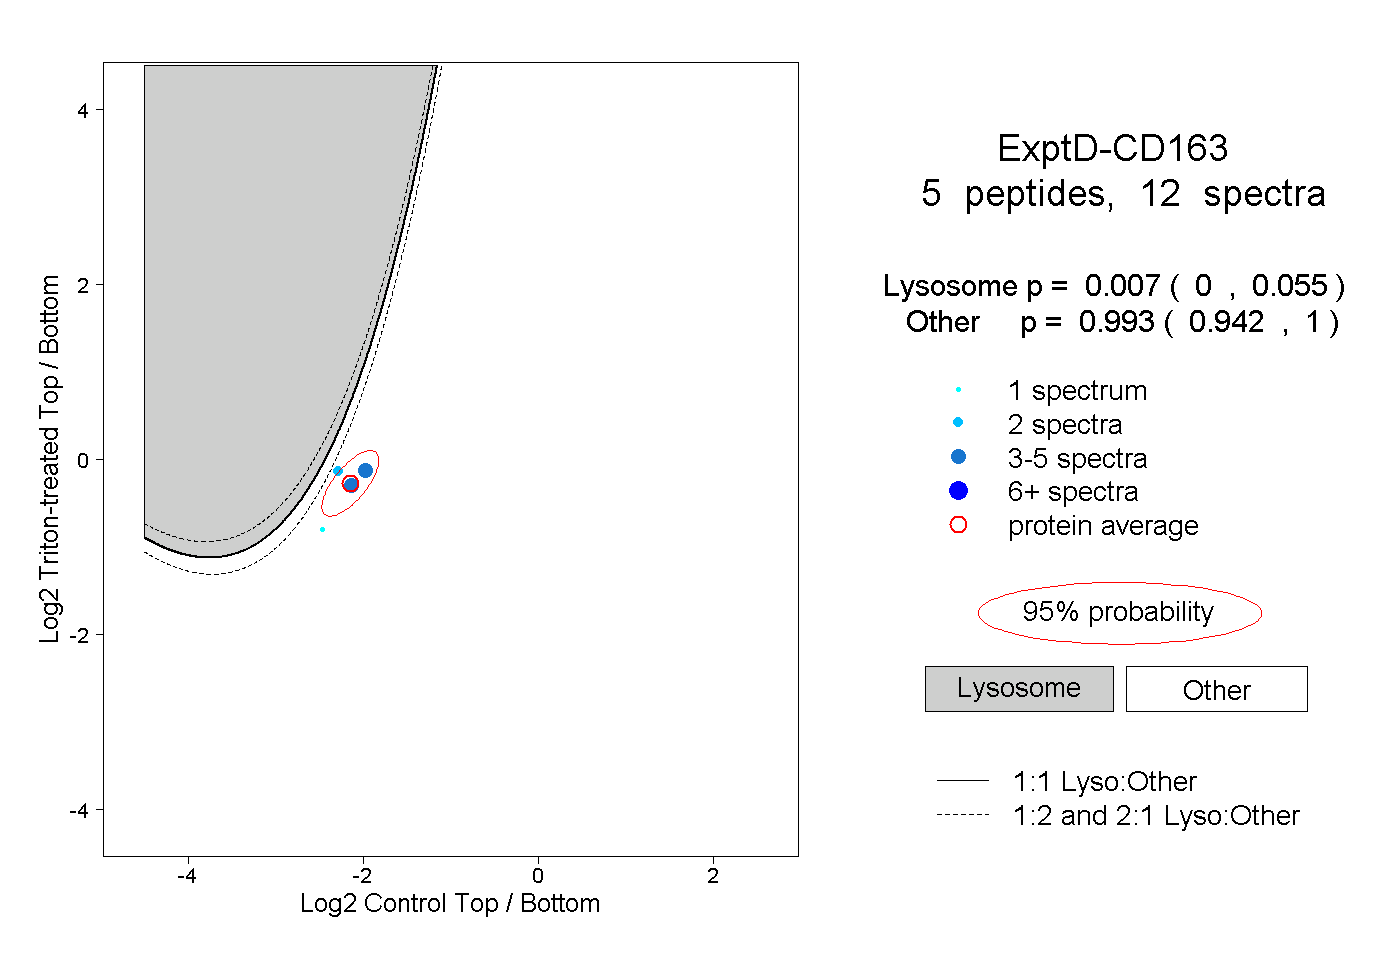
0.000 | 0.055
0.942 | 1.000