 17
17peptides
spectra
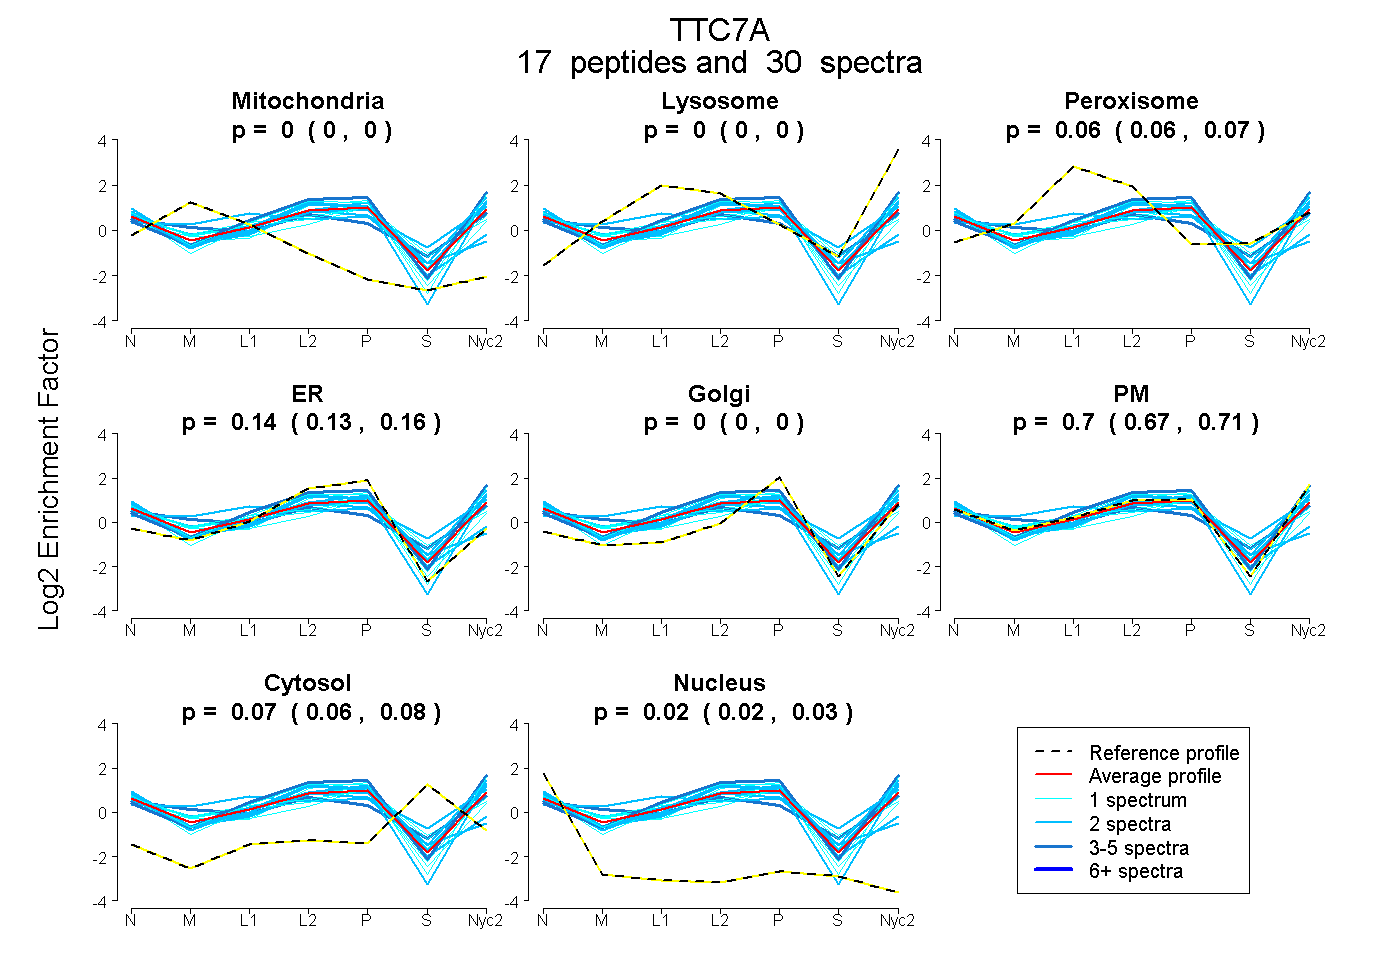
0.000 | 0.000
0.000 | 0.000
0.056 | 0.072
0.127 | 0.156
0.000 | 0.000
0.674 | 0.714
0.063 | 0.081
0.017 | 0.030
4peptides
spectra
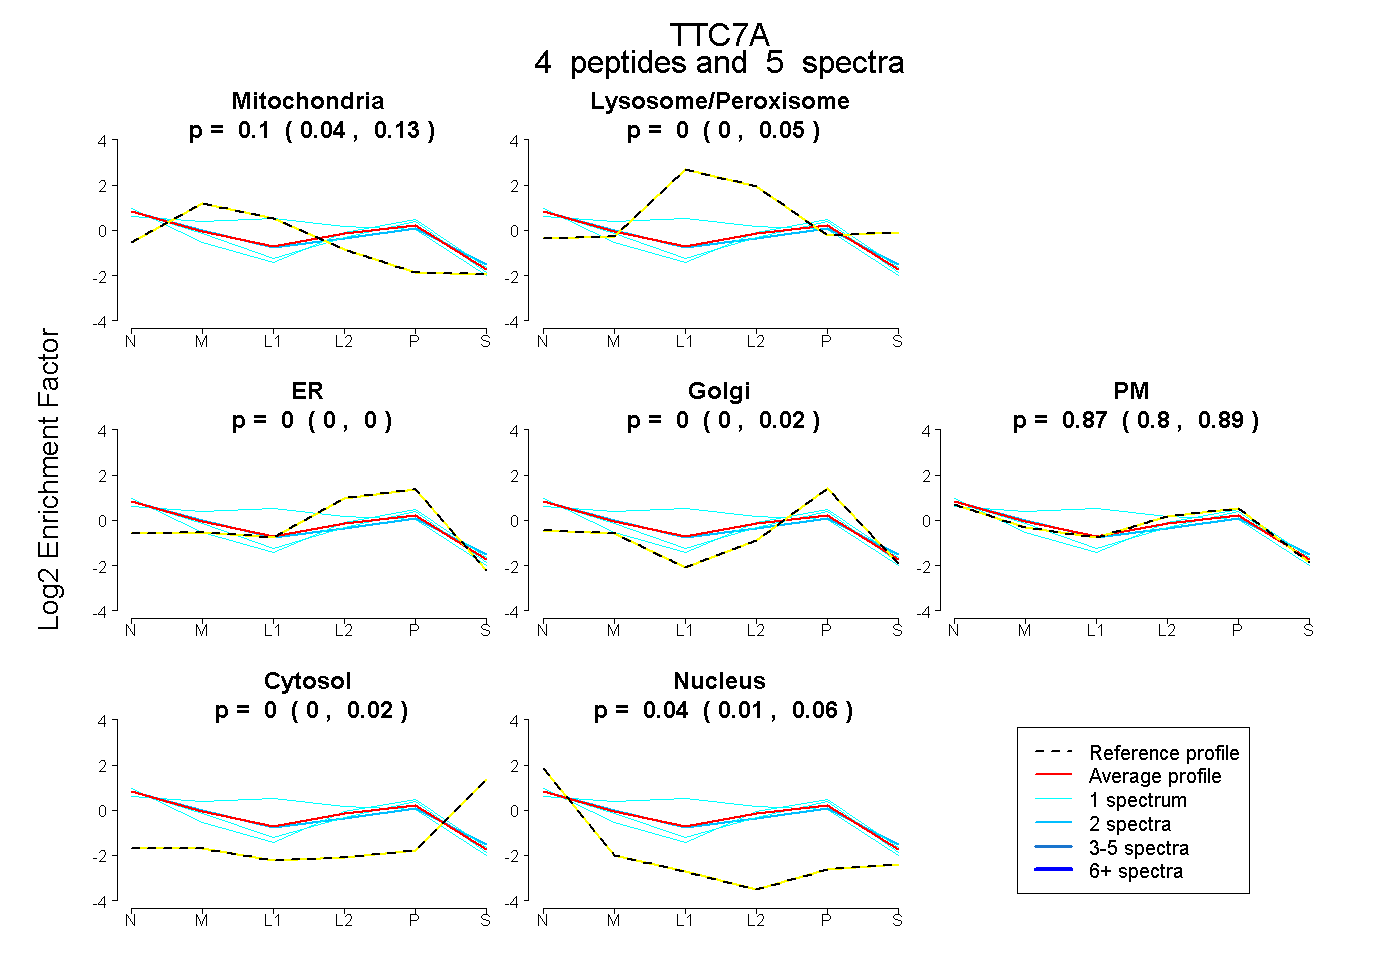
0.035 | 0.133
0.000 | 0.046
0.000 | 0.000
0.000 | 0.024
0.798 | 0.892
0.000 | 0.015
0.013 | 0.065
12peptides
spectra
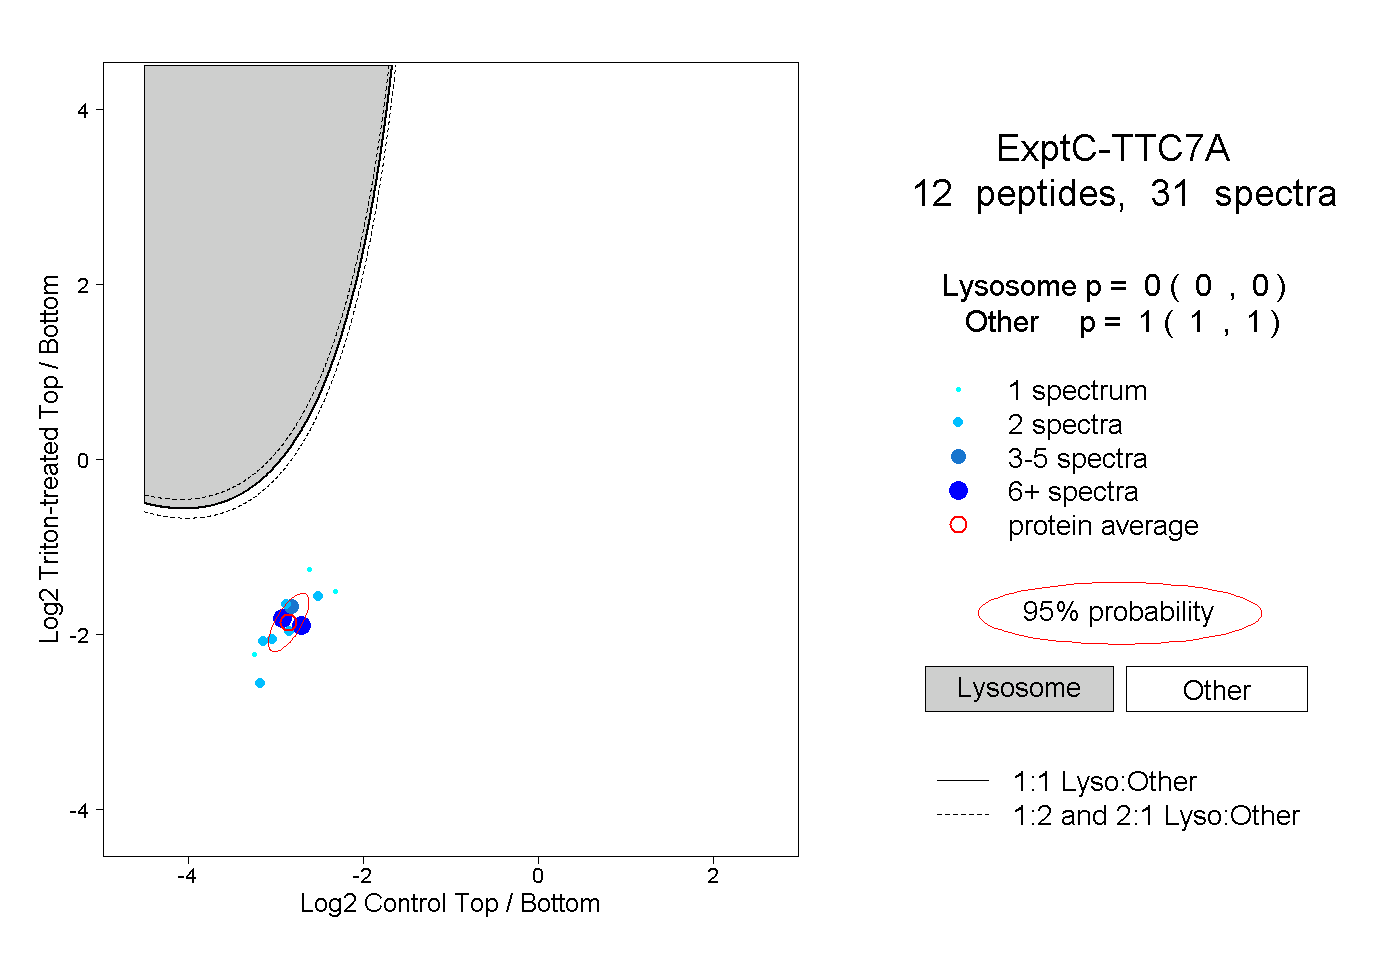
0.000 | 0.000
1.000 | 1.000
3peptides
spectra
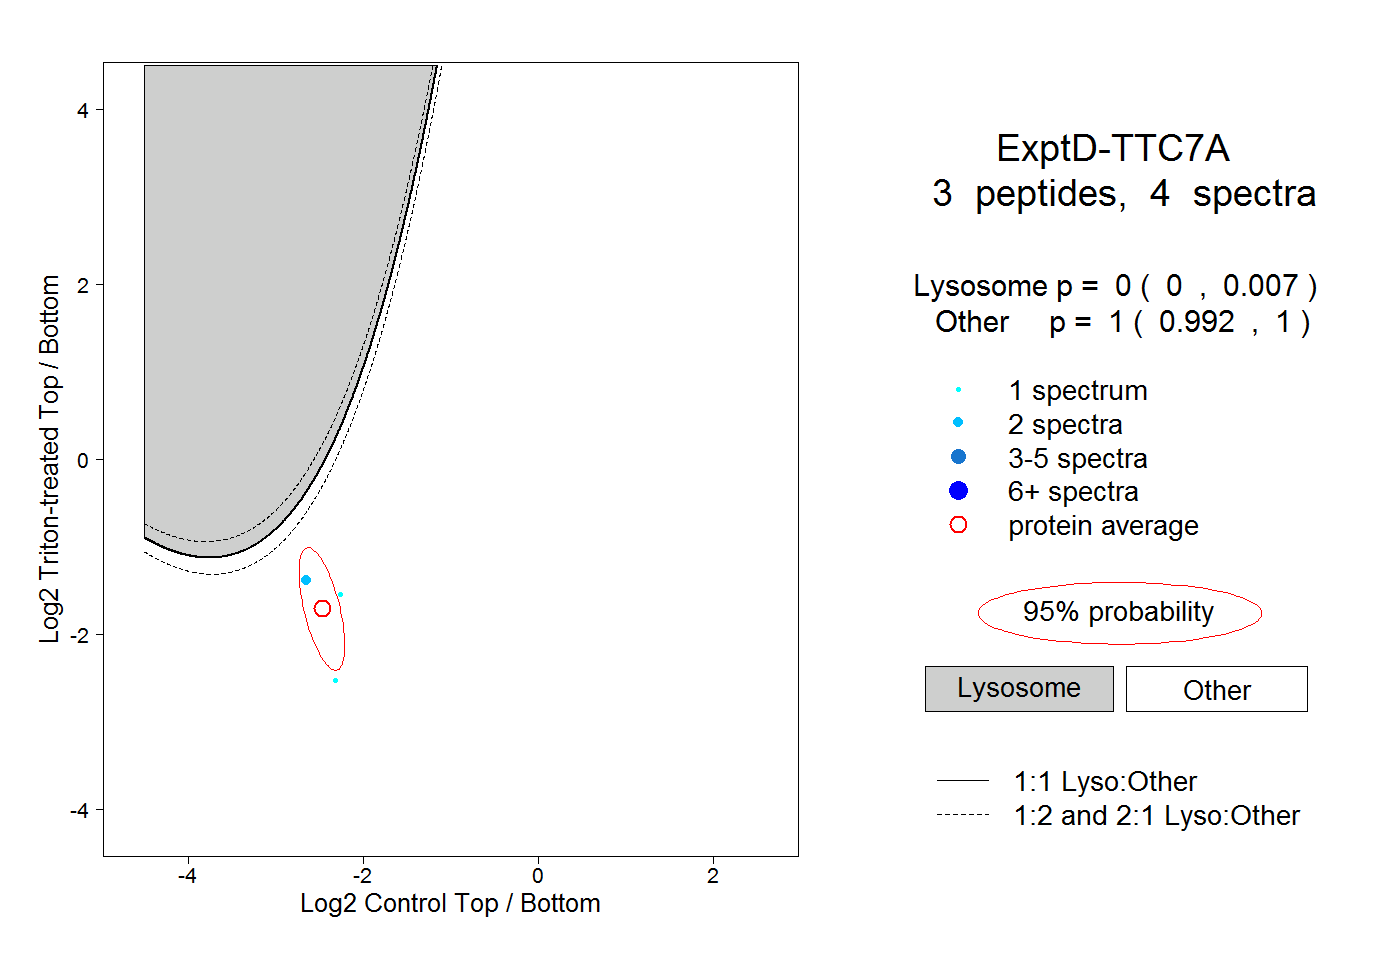
0.000 | 0.007
0.992 | 1.000