TTC7A
[ENSRNOP00000058460]
Main page
| | | Plot |
Mito |
Lyso |
|
Perox |
ER |
Golgi |
PM |
Cytosol |
Nucleus |
|
| Expt A |
 17
17
peptides |
30
spectra |
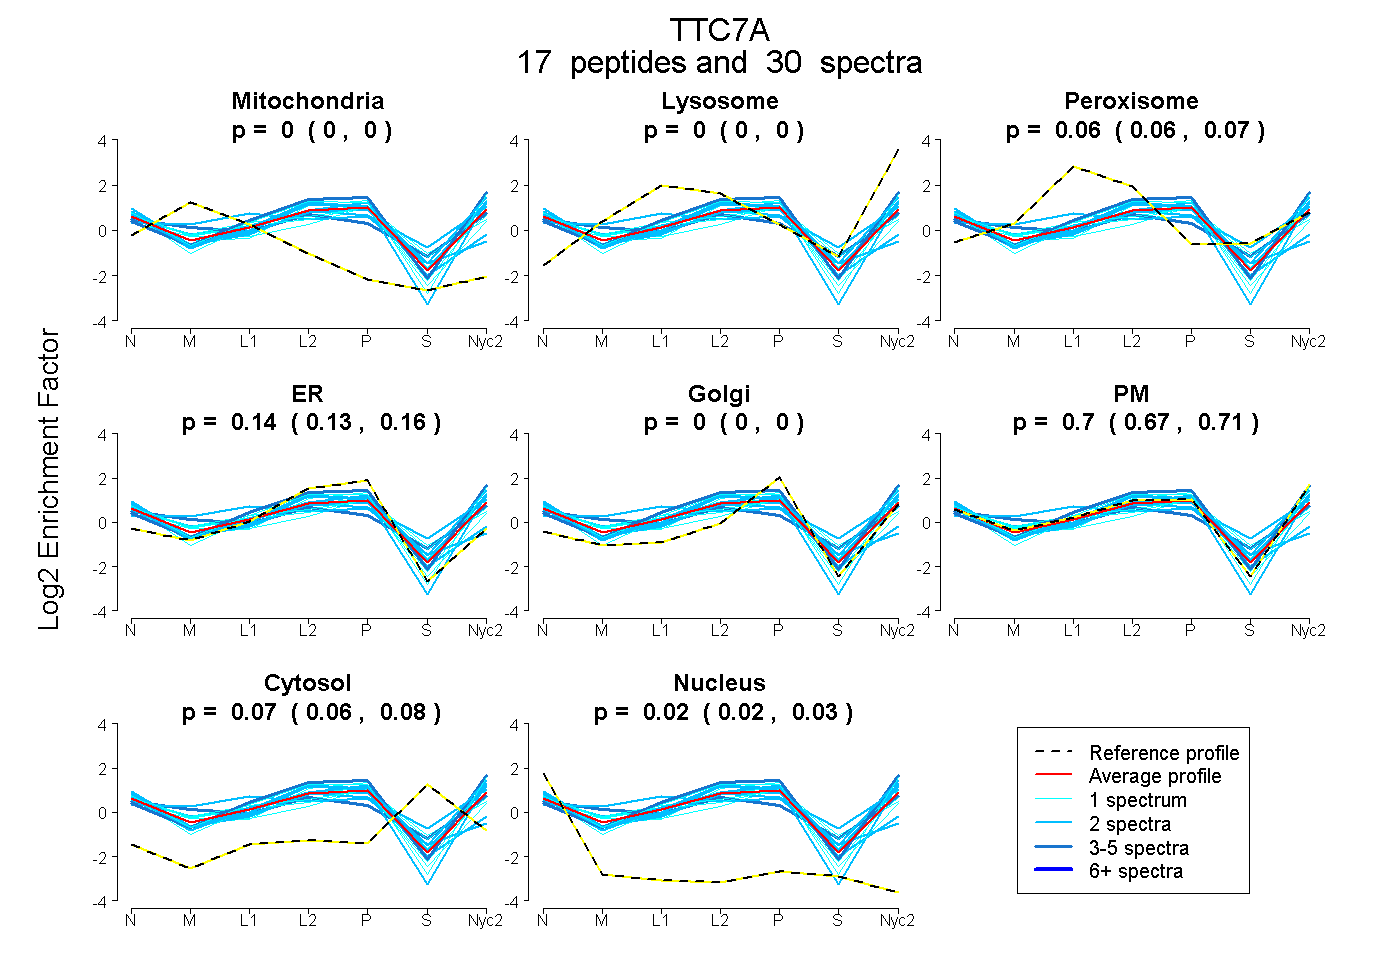 |
0.000
0.000 | 0.000 |
0.000
0.000 | 0.000 |
|
0.065
0.056 | 0.072 |
0.143
0.127 | 0.156 |
0.000
0.000 | 0.000 |
0.696
0.674 | 0.714 |
0.073
0.063 | 0.081 |
0.024
0.017 | 0.030 |
|
| | | Plot |
Mito |
|
Lyso or Perox |
|
ER |
Golgi |
PM |
Cytosol |
Nucleus |
|
| Expt B |
4
peptides |
5
spectra |
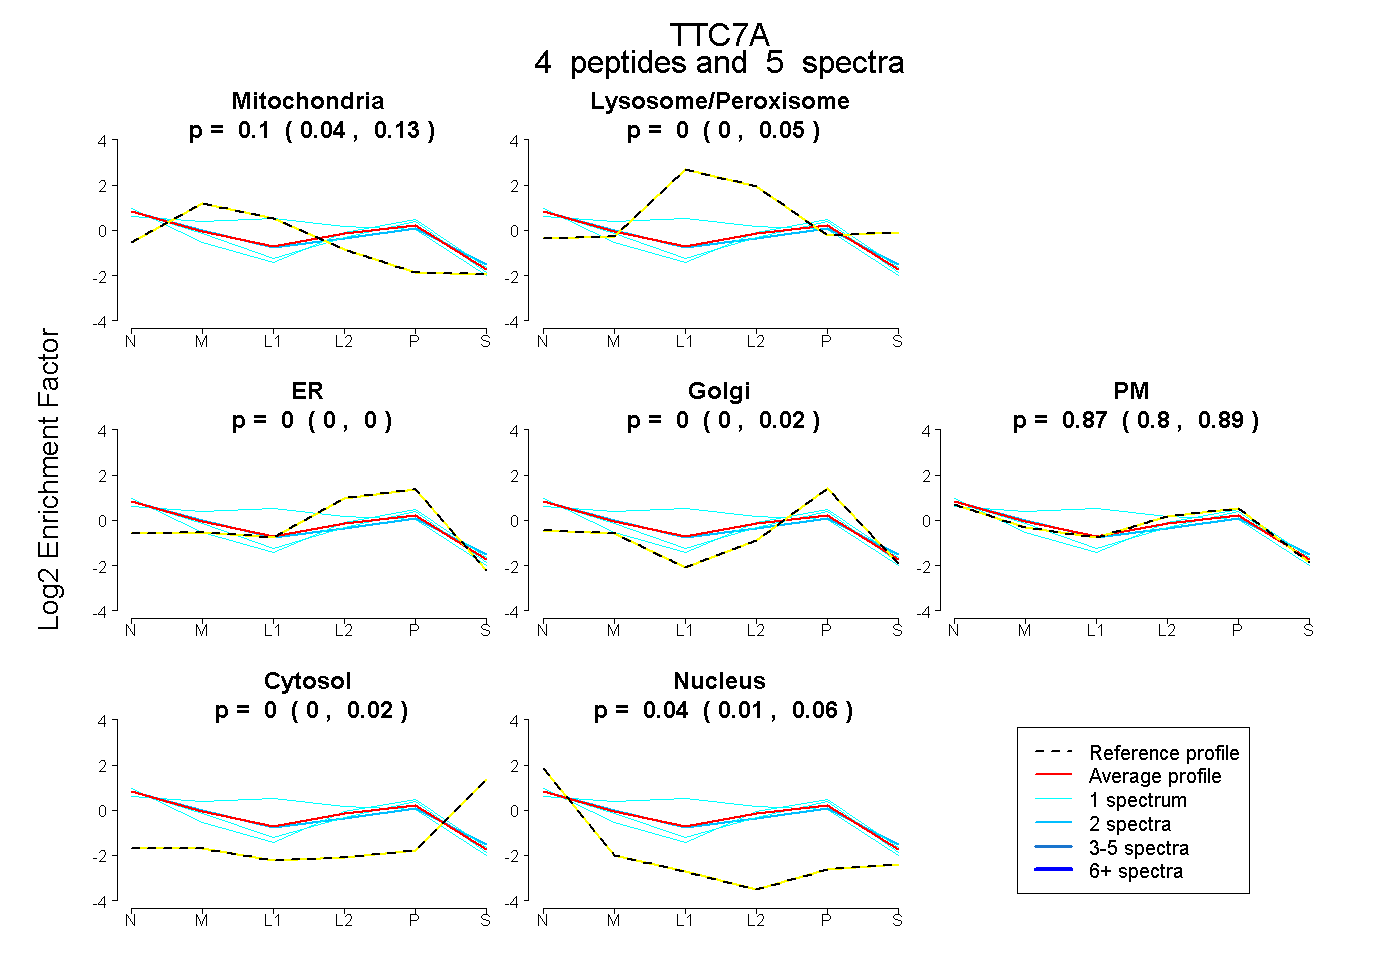 |
0.098
0.035 | 0.133 |
|
0.000
0.000 | 0.046 |
|
0.000
0.000 | 0.000 |
0.000
0.000 | 0.024 |
0.866
0.798 | 0.892 |
0.000
0.000 | 0.015 |
0.037
0.013 | 0.065 |
|
| 1 spectrum, QISSAIER |
0.007 |
|
0.000 |
|
0.000 |
0.101 |
0.811 |
0.000 |
0.080 |
|
| 2 spectra, EENSFITQTLR |
0.119 |
|
0.000 |
|
0.000 |
0.000 |
0.798 |
0.033 |
0.050 |
|
| 1 spectrum, DVVLSR |
0.250 |
|
0.167 |
|
0.000 |
0.000 |
0.583 |
0.000 |
0.000 |
|
| 1 spectrum, FISLDTDDFGK |
0.000 |
|
0.000 |
|
0.000 |
0.102 |
0.814 |
0.008 |
0.076 |
|
| | | Plot |
|
Lyso |
|
|
|
|
|
|
|
Other |
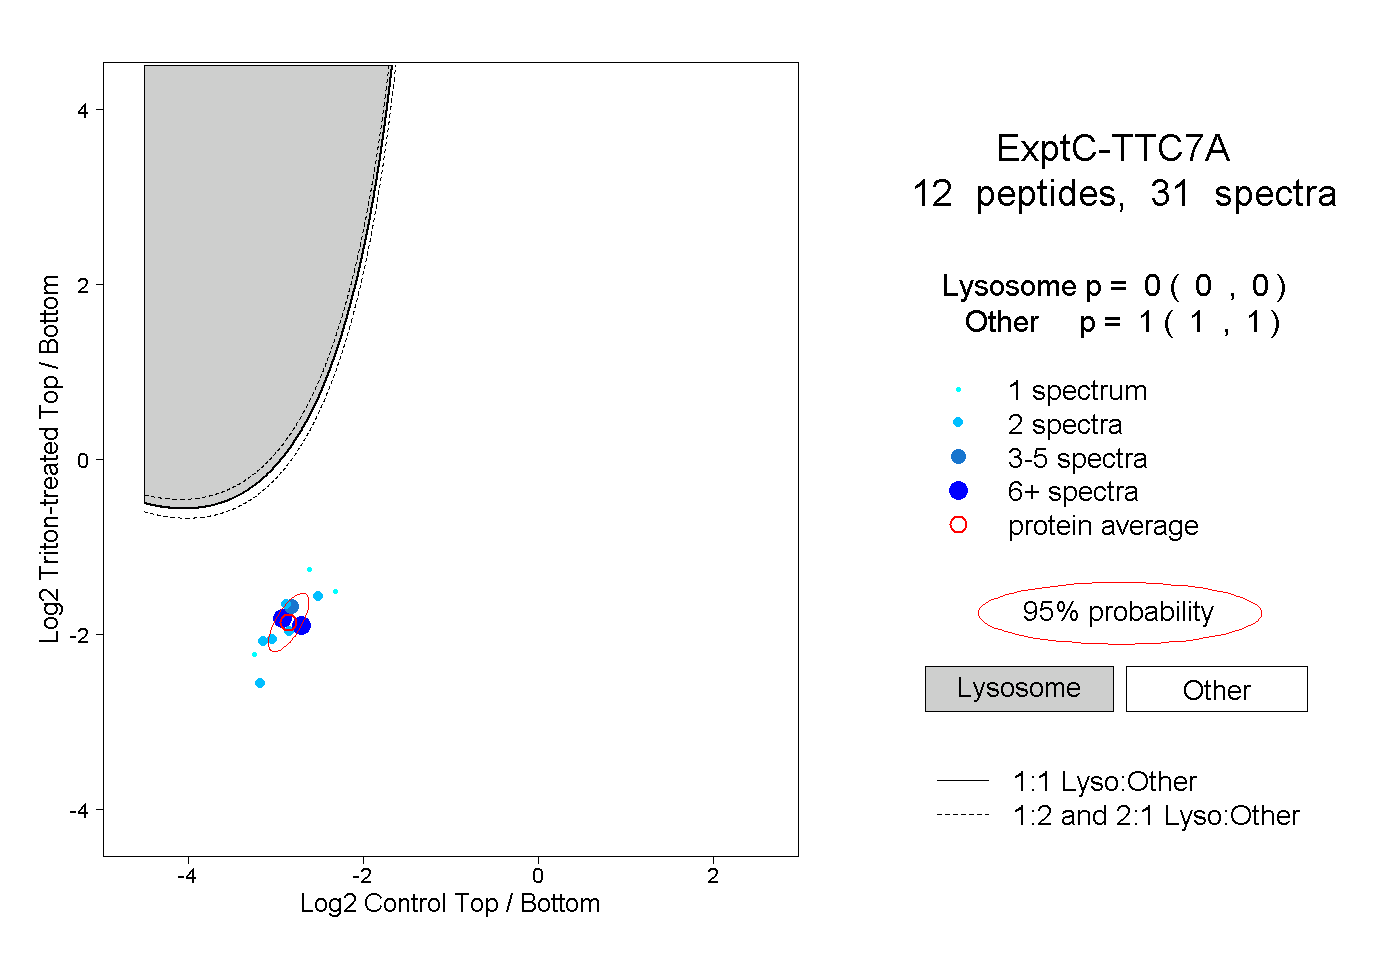
| Expt C |
12
peptides |
31
spectra |
 |
|
0.000
0.000 | 0.000 |
|
|
|
|
|
|
|
1.000
1.000 | 1.000 |
| | | Plot |
|
Lyso |
|
|
|
|
|
|
|
Other |
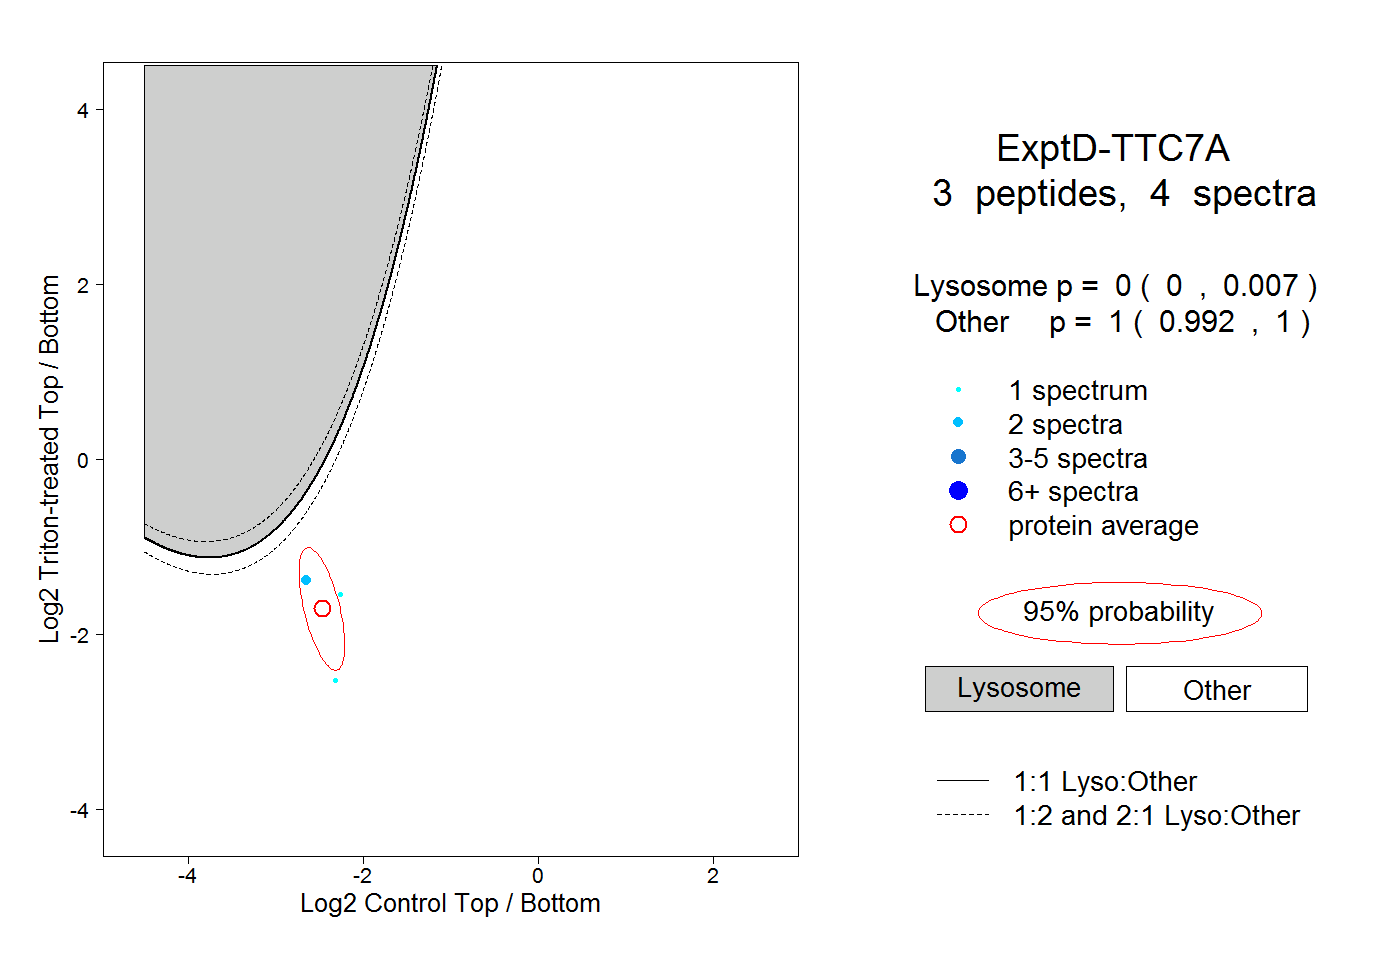
| Expt D |
3
peptides |
4
spectra |
 |
|
0.000
0.000 | 0.007 |
|
|
|
|
|
|
|
1.000
0.992 | 1.000 |