 17
17peptides
spectra
0.000 | 0.000
0.000 | 0.000
0.056 | 0.072
0.127 | 0.156
0.000 | 0.000
0.674 | 0.714
0.063 | 0.081
0.017 | 0.030
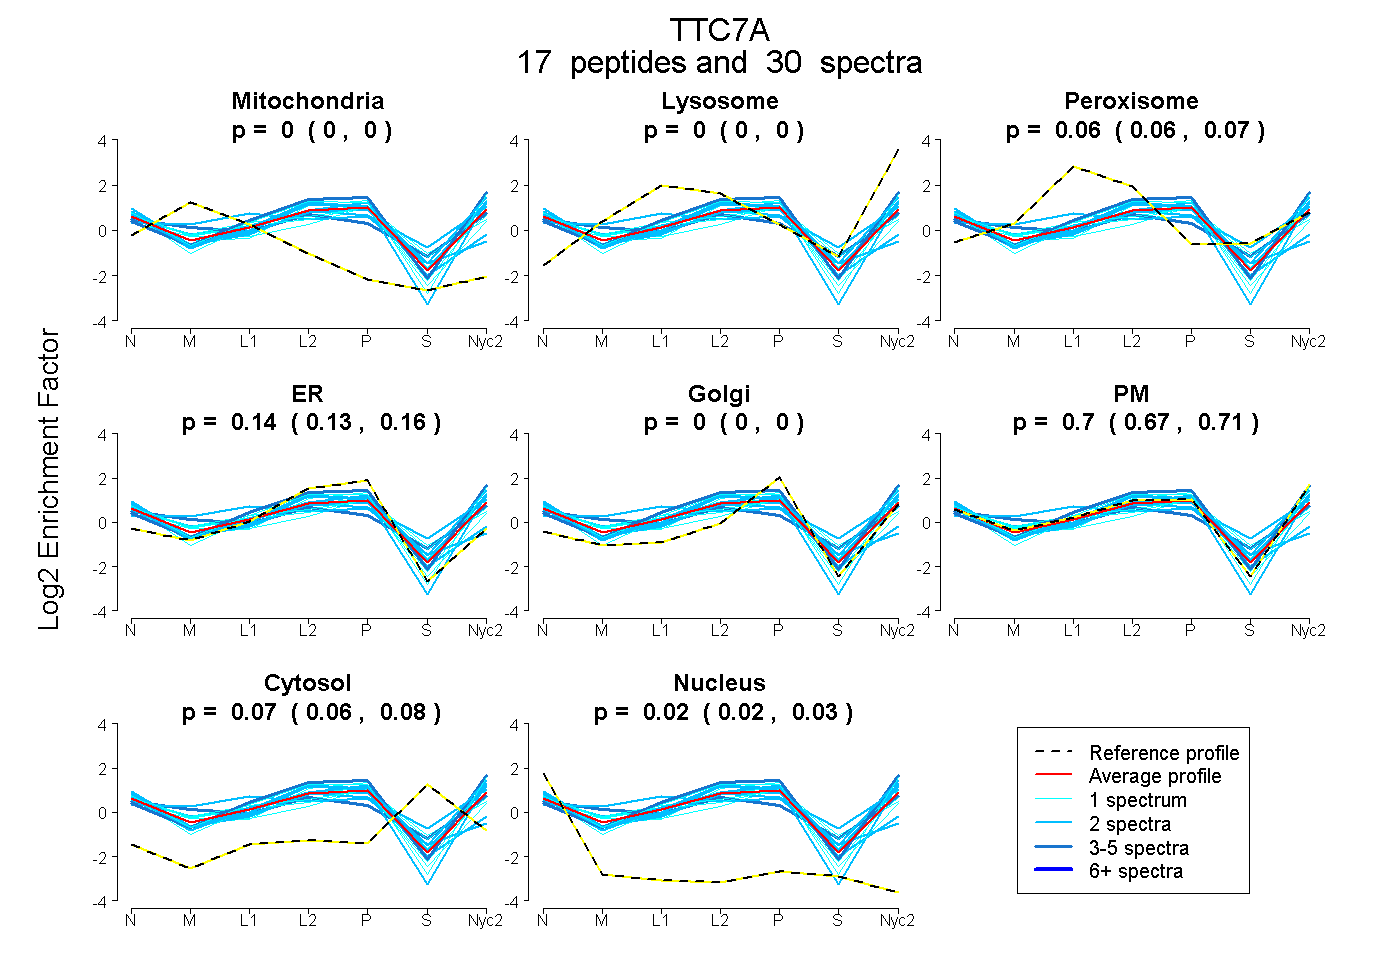
| Plot | Mito | Lyso | Perox | ER | Golgi | PM | Cytosol | Nucleus | |||||
| Expt A |
17 peptides |
30 spectra |
|
0.000 0.000 | 0.000 |
0.000 0.000 | 0.000 |
0.065 0.056 | 0.072 |
0.143 0.127 | 0.156 |
0.000 0.000 | 0.000 |
0.696 0.674 | 0.714 |
0.073 0.063 | 0.081 |
0.024 0.017 | 0.030 |
| 4 spectra, MFQLVR | 0.000 | 0.101 | 0.000 | 0.181 | 0.000 | 0.718 | 0.000 | 0.000 | ||
| 1 spectrum, DDANALHLLALLFSAQK | 0.000 | 0.000 | 0.000 | 0.341 | 0.000 | 0.543 | 0.116 | 0.000 | ||
| 2 spectra, EENSFITQTLR | 0.000 | 0.000 | 0.086 | 0.000 | 0.000 | 0.687 | 0.227 | 0.000 | ||
| 1 spectrum, ALAGTELR | 0.028 | 0.000 | 0.048 | 0.037 | 0.063 | 0.812 | 0.013 | 0.000 | ||
| 2 spectra, ASWVAQVFLQELEK | 0.000 | 0.000 | 0.040 | 0.032 | 0.000 | 0.825 | 0.095 | 0.008 | ||
| 1 spectrum, HLQVLGISGGGSSNR | 0.000 | 0.000 | 0.019 | 0.074 | 0.000 | 0.709 | 0.198 | 0.000 | ||
| 1 spectrum, ALQTLER | 0.025 | 0.000 | 0.050 | 0.107 | 0.000 | 0.775 | 0.000 | 0.043 | ||
| 3 spectra, ATQNFK | 0.107 | 0.000 | 0.121 | 0.000 | 0.000 | 0.626 | 0.146 | 0.000 | ||
| 1 spectrum, ASSIAASR | 0.039 | 0.000 | 0.083 | 0.046 | 0.241 | 0.413 | 0.179 | 0.000 | ||
| 1 spectrum, VESEMER | 0.000 | 0.000 | 0.000 | 0.094 | 0.000 | 0.906 | 0.000 | 0.000 | ||
| 2 spectra, GQYVMLSECLER | 0.215 | 0.000 | 0.295 | 0.282 | 0.159 | 0.020 | 0.000 | 0.029 | ||
| 2 spectra, GPEEALVTCR | 0.000 | 0.000 | 0.098 | 0.421 | 0.000 | 0.340 | 0.000 | 0.141 | ||
| 2 spectra, QDELHR | 0.000 | 0.000 | 0.060 | 0.021 | 0.000 | 0.829 | 0.090 | 0.000 | ||
| 1 spectrum, LQEALTVCR | 0.136 | 0.000 | 0.000 | 0.260 | 0.000 | 0.583 | 0.000 | 0.021 | ||
| 2 spectra, LLSEAFVIK | 0.000 | 0.000 | 0.000 | 0.119 | 0.000 | 0.842 | 0.000 | 0.039 | ||
| 2 spectra, DAVSMYAR | 0.000 | 0.000 | 0.005 | 0.089 | 0.000 | 0.811 | 0.095 | 0.000 | ||
| 2 spectra, AEGQWDR | 0.017 | 0.000 | 0.067 | 0.018 | 0.000 | 0.809 | 0.090 | 0.000 |
| Plot | Mito | Lyso or Perox | ER | Golgi | PM | Cytosol | Nucleus | ||||||
| Expt B |
4 peptides |
5 spectra |
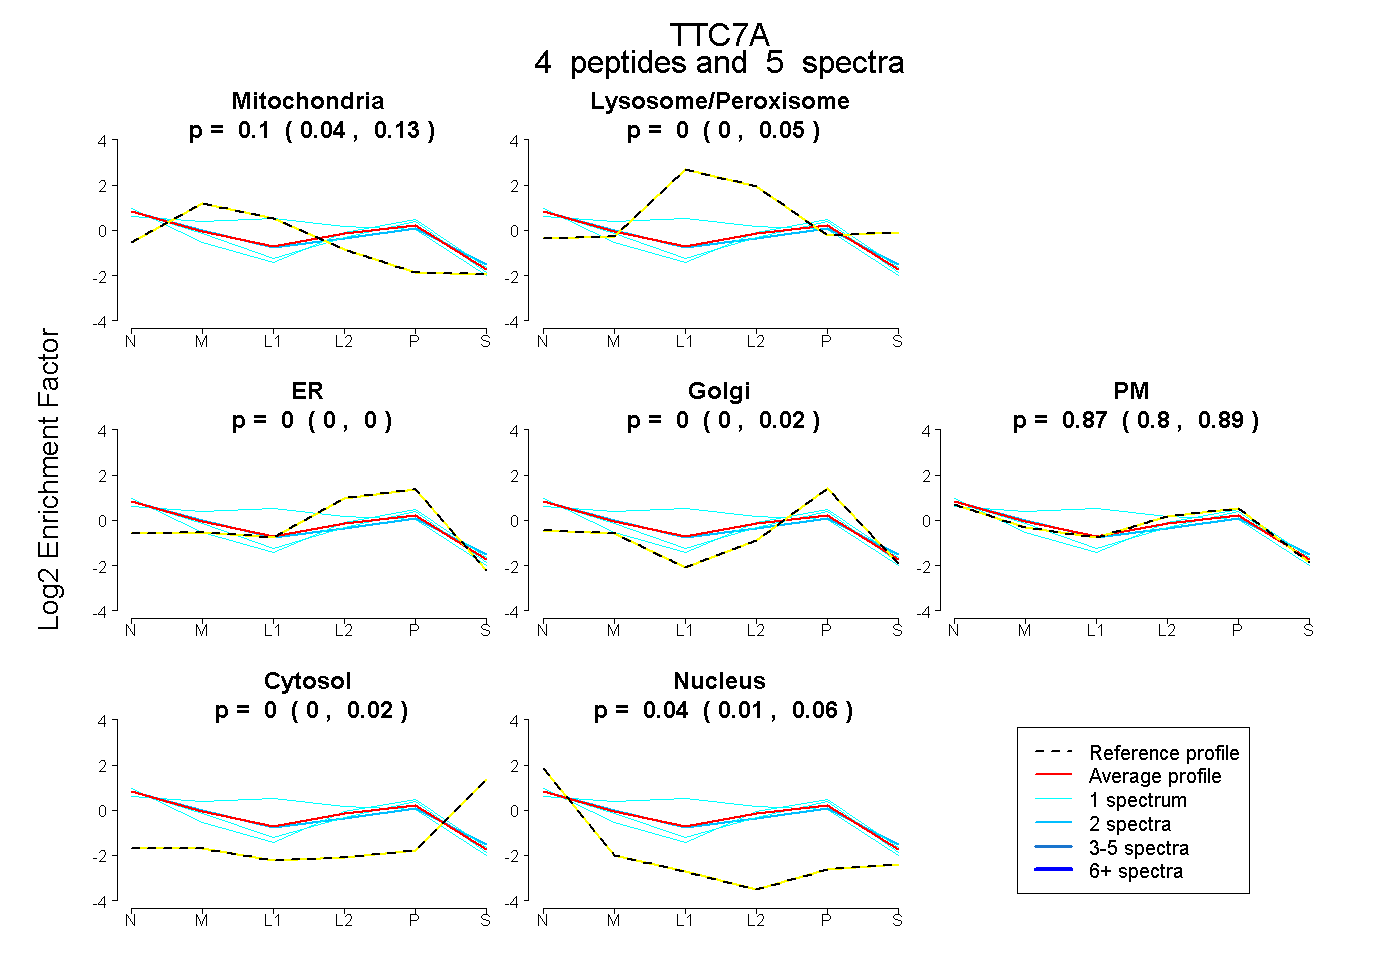 |
0.098 0.035 | 0.133 |
0.000 0.000 | 0.046 |
0.000 0.000 | 0.000 |
0.000 0.000 | 0.024 |
0.866 0.798 | 0.892 |
0.000 0.000 | 0.015 |
0.037 0.013 | 0.065 |
|||
| Plot | Lyso | Other | |||||||||||
| Expt C |
12 peptides |
31 spectra |
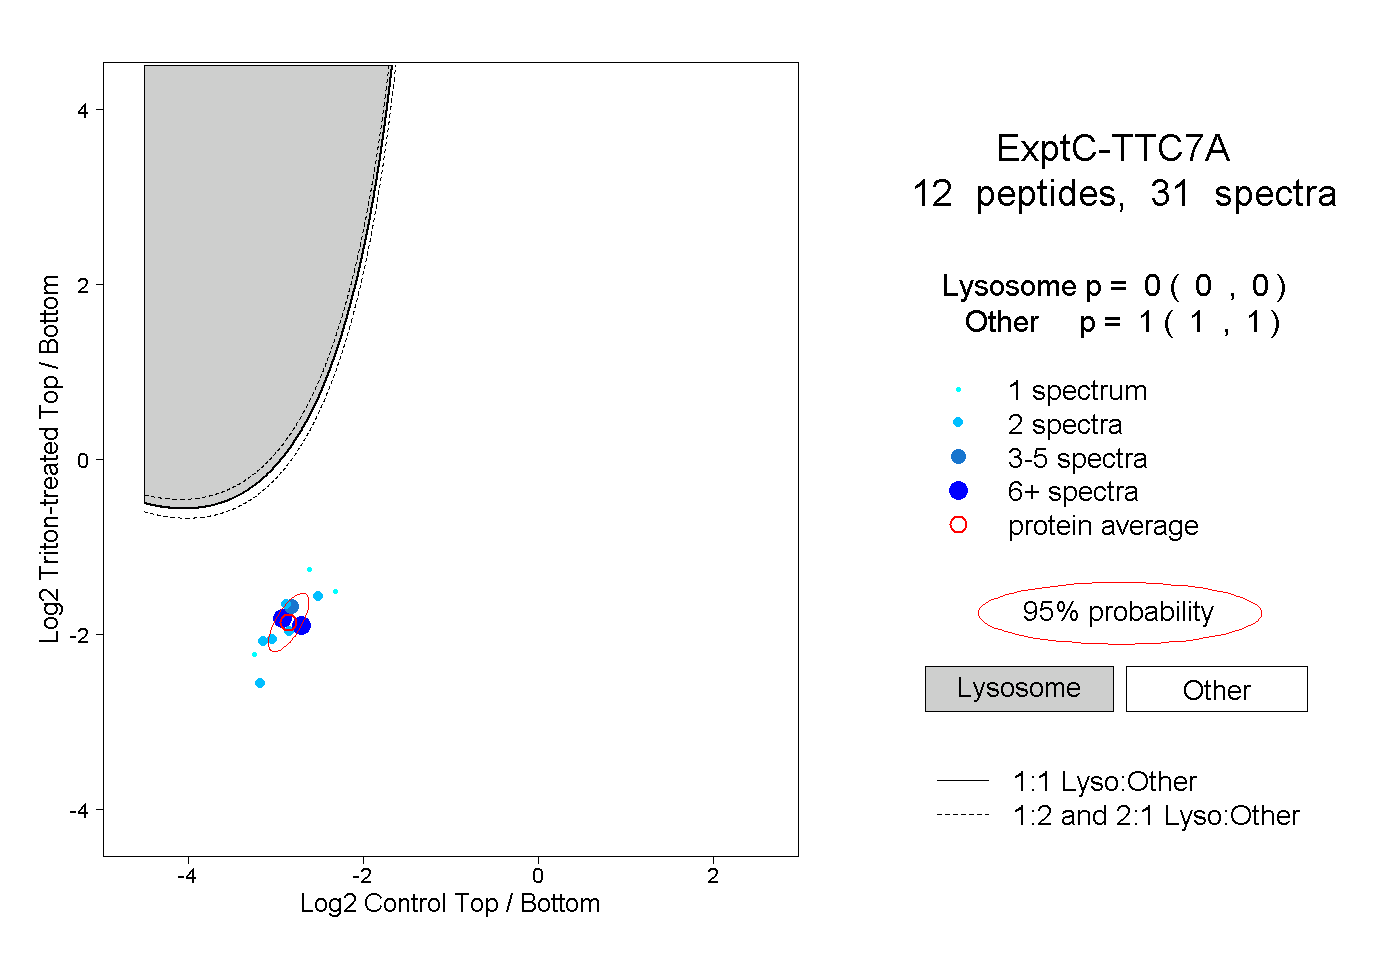 |
0.000 0.000 | 0.000 |
1.000 1.000 | 1.000 |
||||||||
| Plot | Lyso | Other | |||||||||||
| Expt D |
3 peptides |
4 spectra |
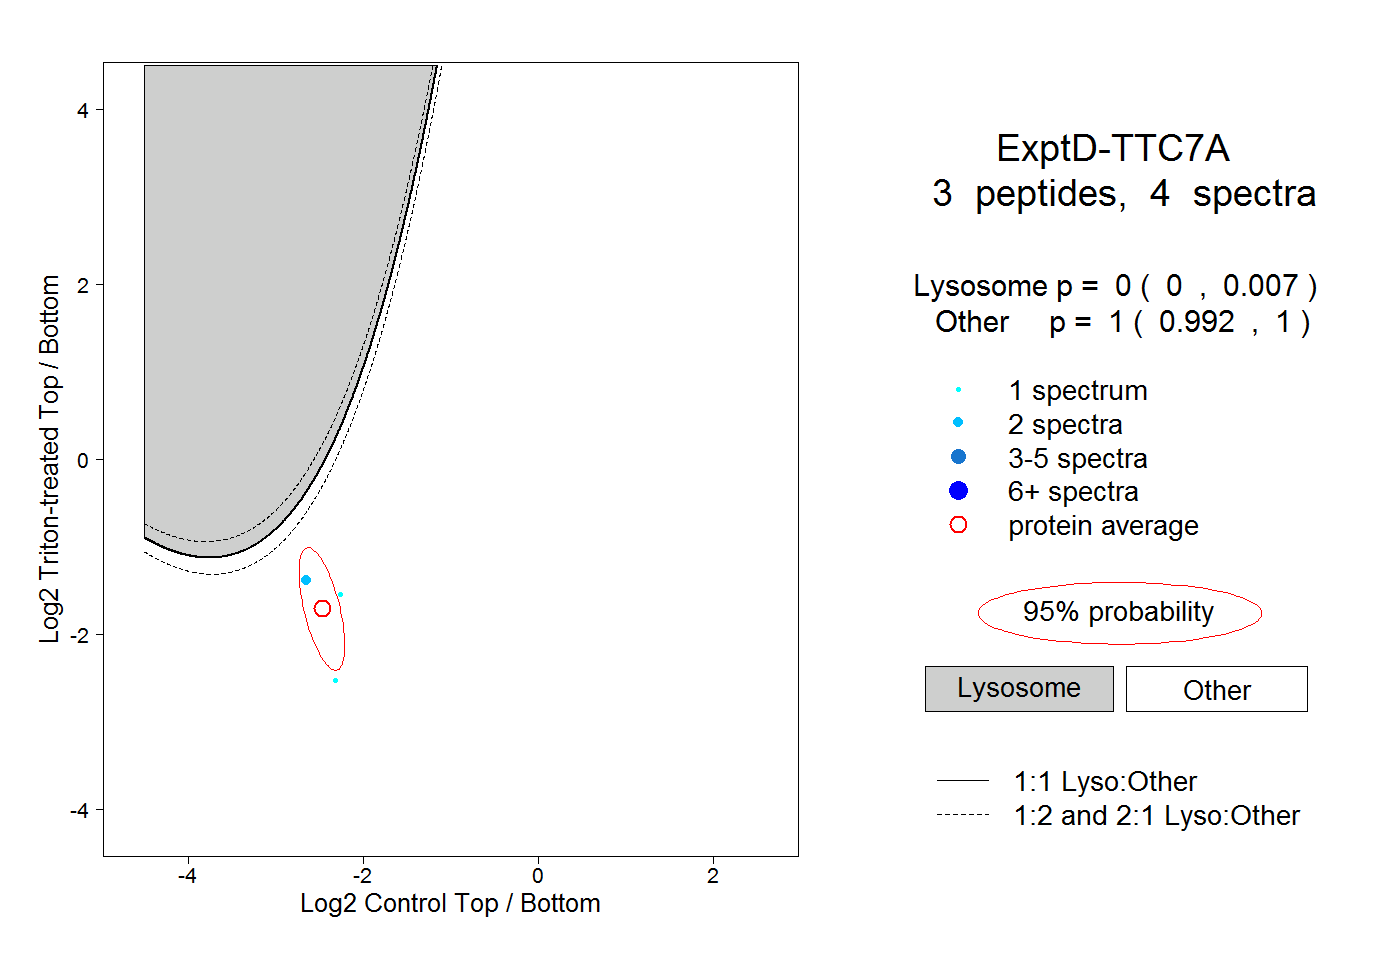 |
0.000 0.000 | 0.007 |
1.000 0.992 | 1.000 |