 29
29peptides
spectra
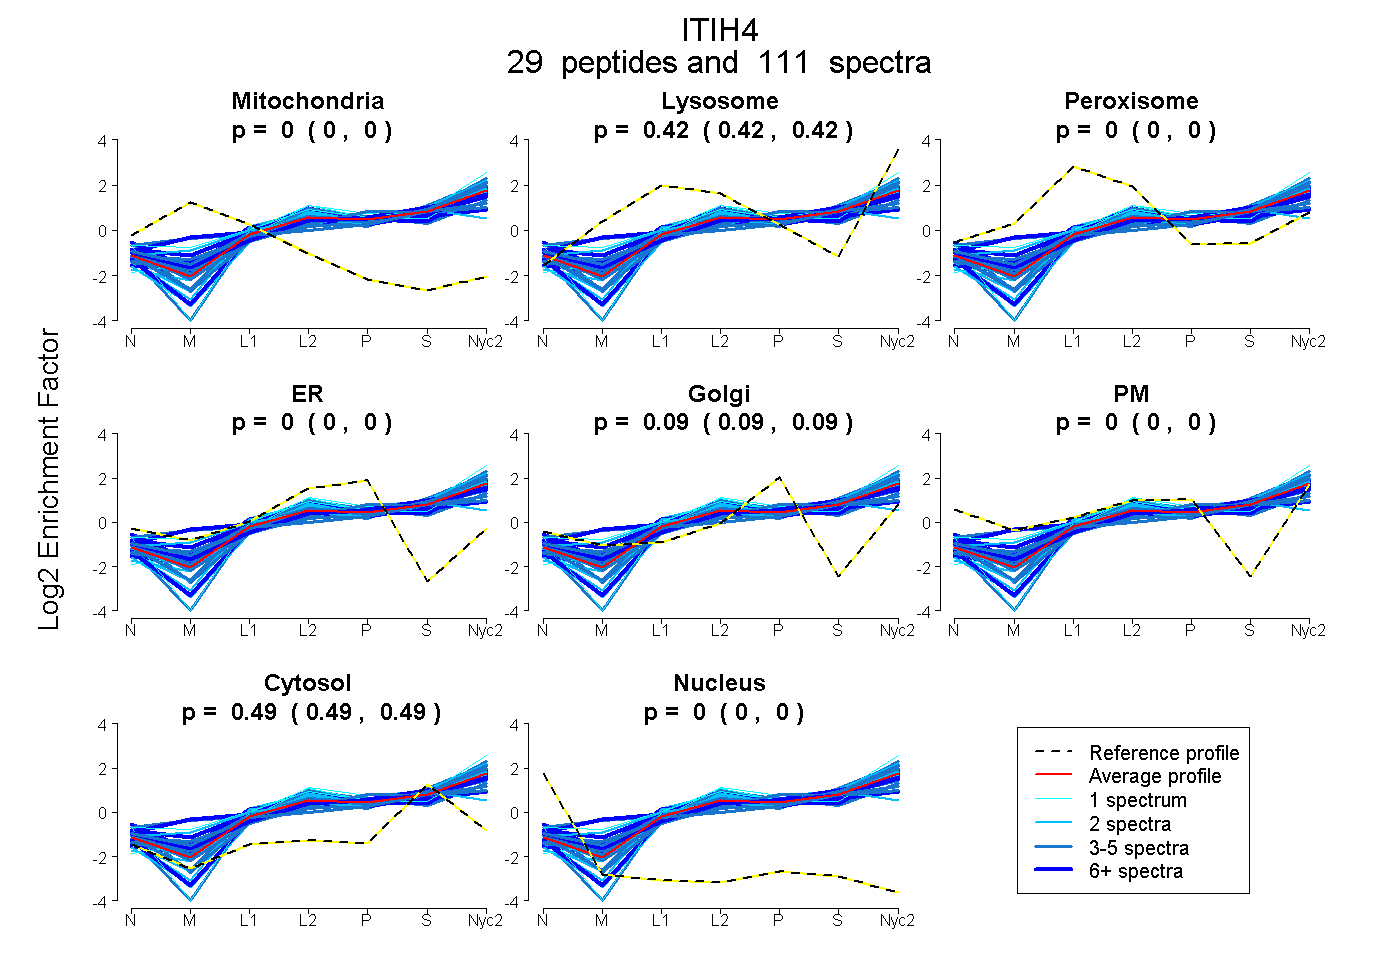
0.000 | 0.000
0.416 | 0.421
0.000 | 0.000
0.000 | 0.000
0.088 | 0.092
0.000 | 0.000
0.489 | 0.493
0.000 | 0.000
13peptides
spectra
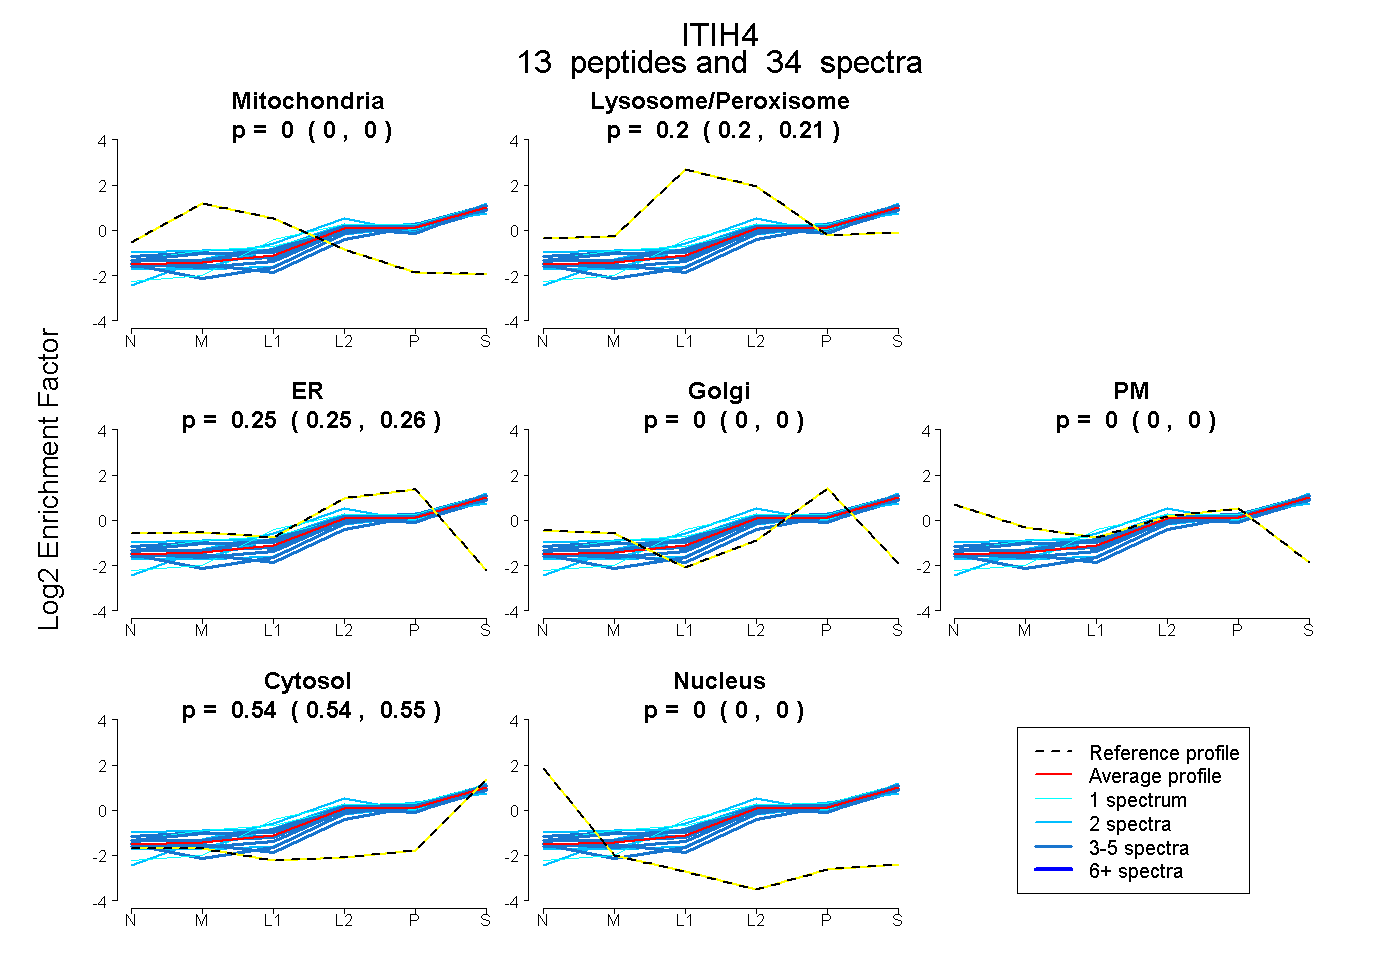
0.000 | 0.000
0.196 | 0.210
0.246 | 0.257
0.000 | 0.000
0.000 | 0.000
0.541 | 0.548
0.000 | 0.000
28peptides
spectra
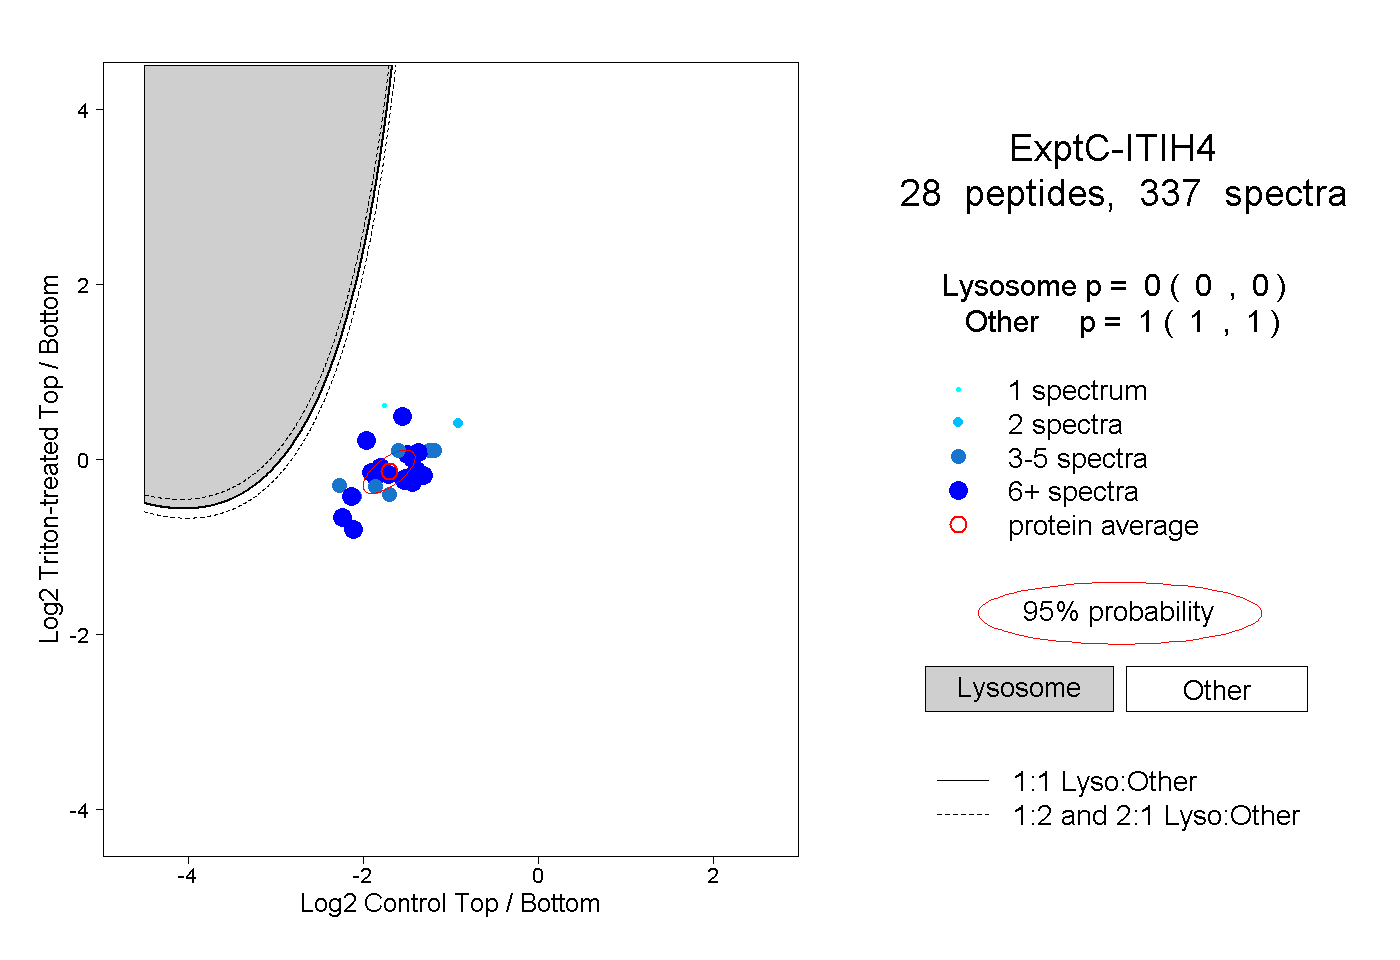
0.000 | 0.000
1.000 | 1.000
13peptides
spectra

0.000 | 0.005
0.995 | 1.000