 5
5peptides
spectra
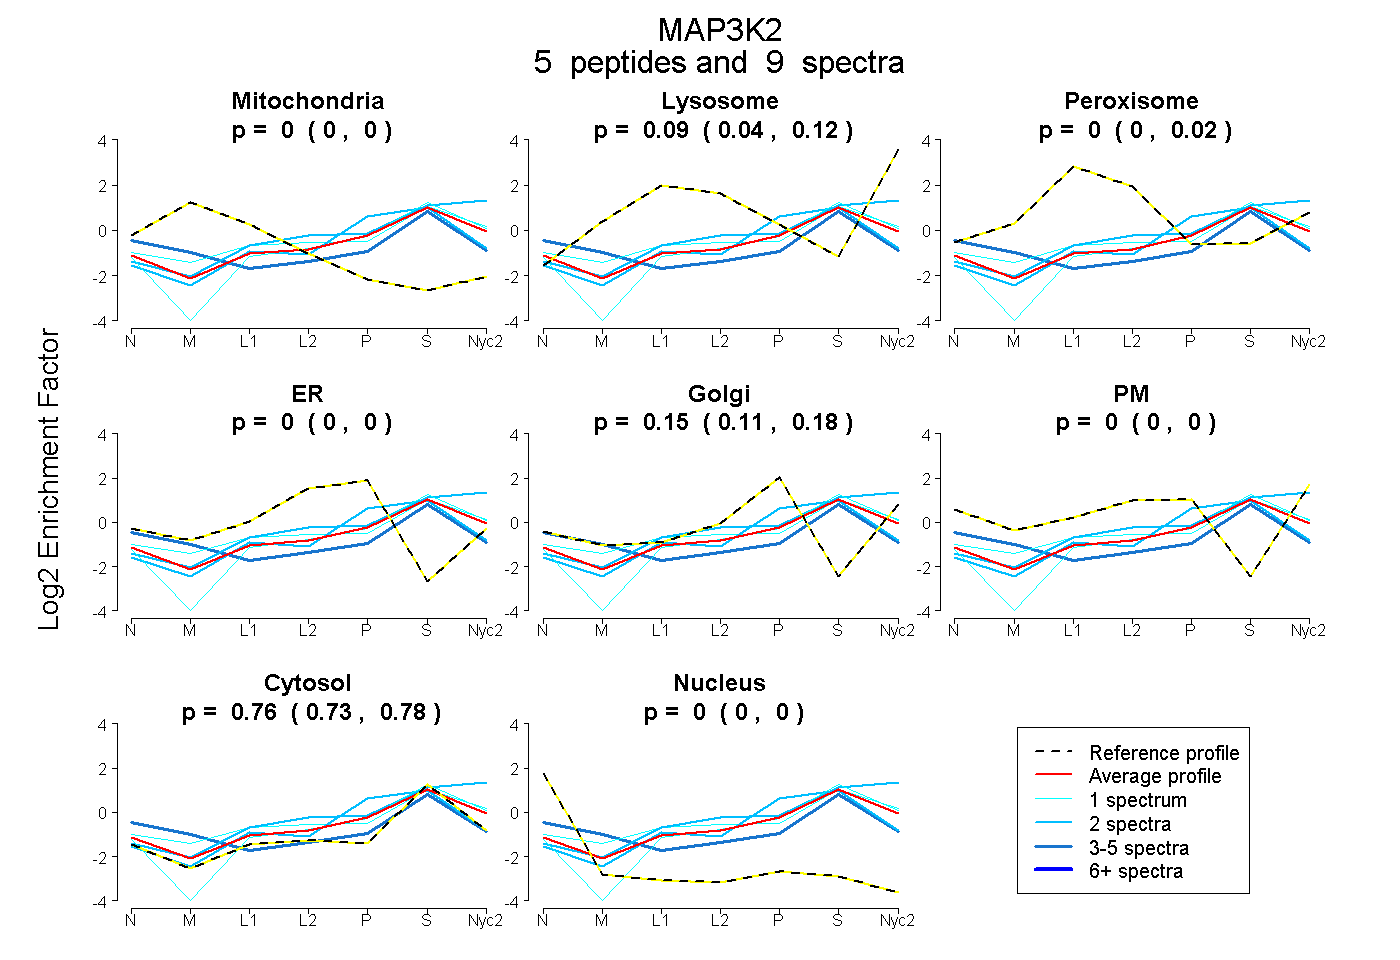
0.000 | 0.000
0.040 | 0.124
0.000 | 0.020
0.000 | 0.000
0.115 | 0.180
0.000 | 0.000
0.728 | 0.782
0.000 | 0.000
2peptides
spectra
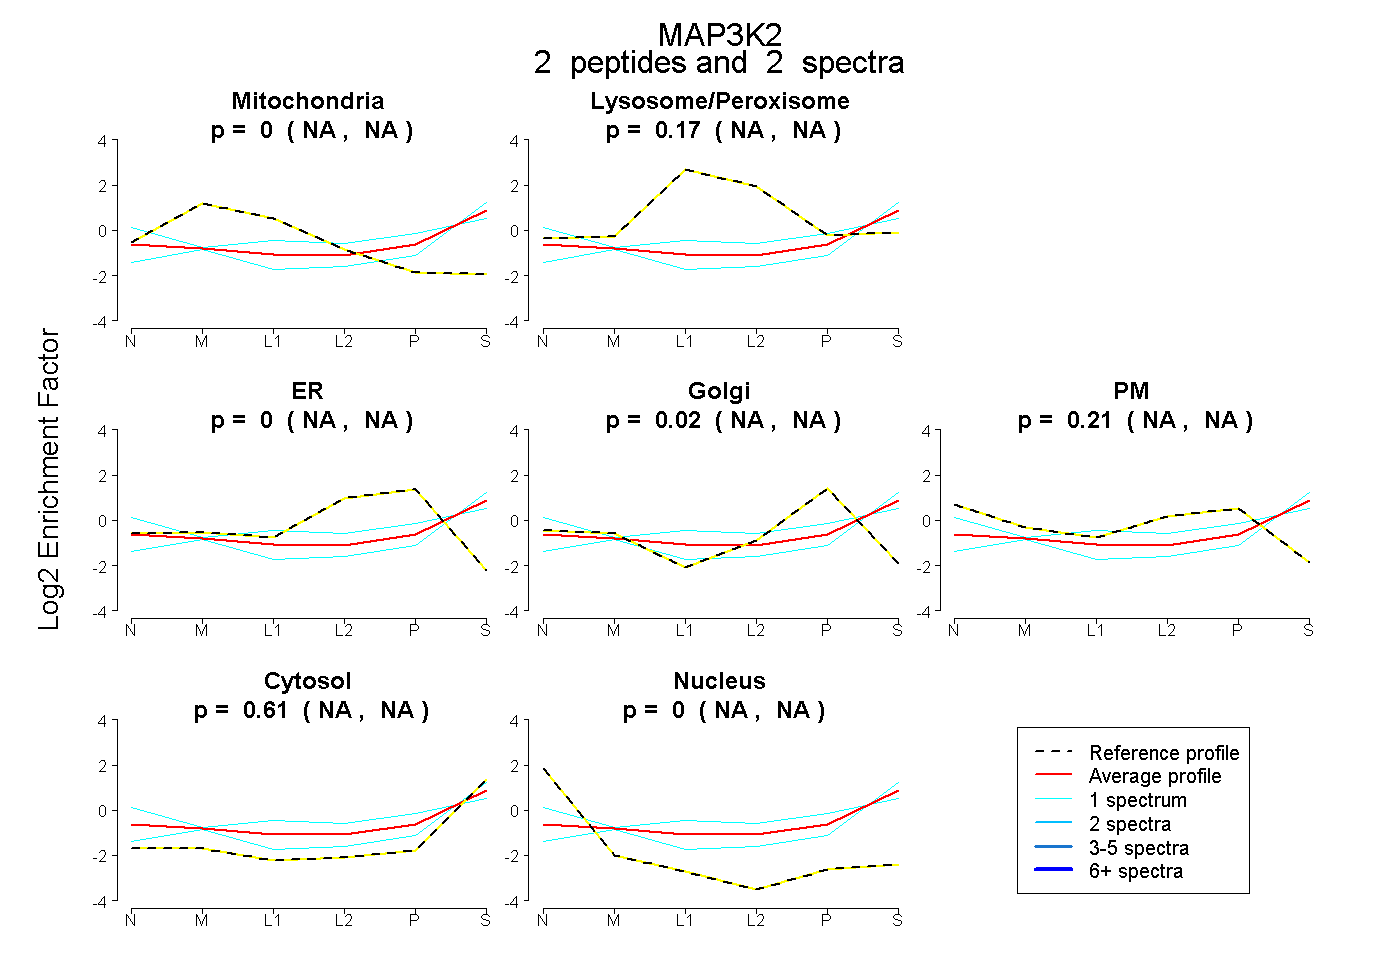
NA | NA
NA | NA
NA | NA
NA | NA
NA | NA
NA | NA
NA | NA
2peptides
spectra
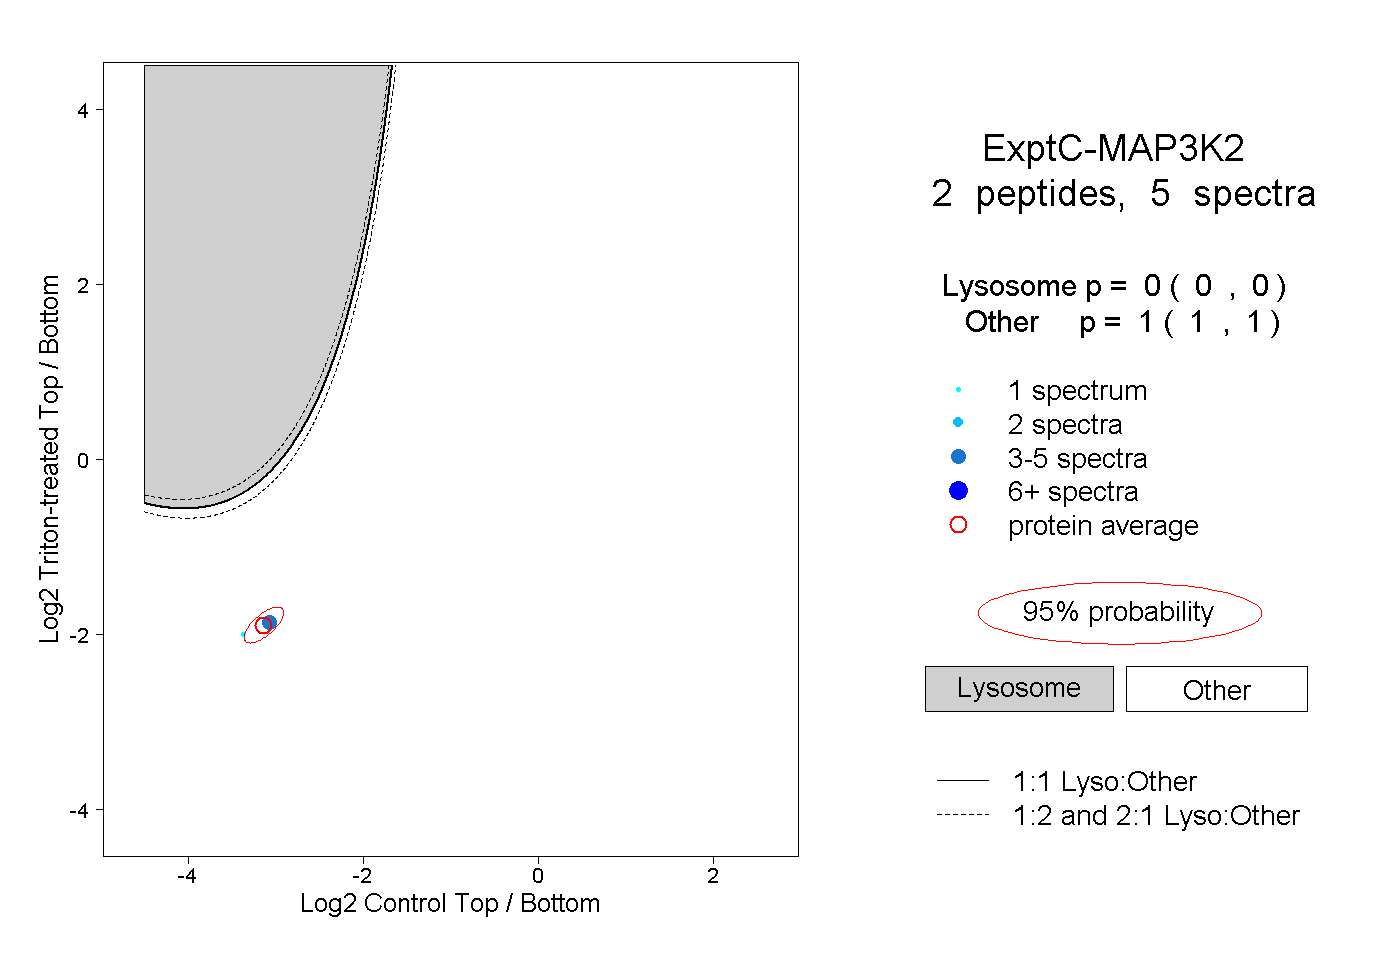
0.000 | 0.000
1.000 | 1.000