 5
5peptides
spectra
0.000 | 0.000
0.040 | 0.124
0.000 | 0.020
0.000 | 0.000
0.115 | 0.180
0.000 | 0.000
0.728 | 0.782
0.000 | 0.000
2peptides
spectra
NA | NA
NA | NA
NA | NA
NA | NA
NA | NA
NA | NA
NA | NA
| Plot | Mito | Lyso | Perox | ER | Golgi | PM | Cytosol | Nucleus | |||||
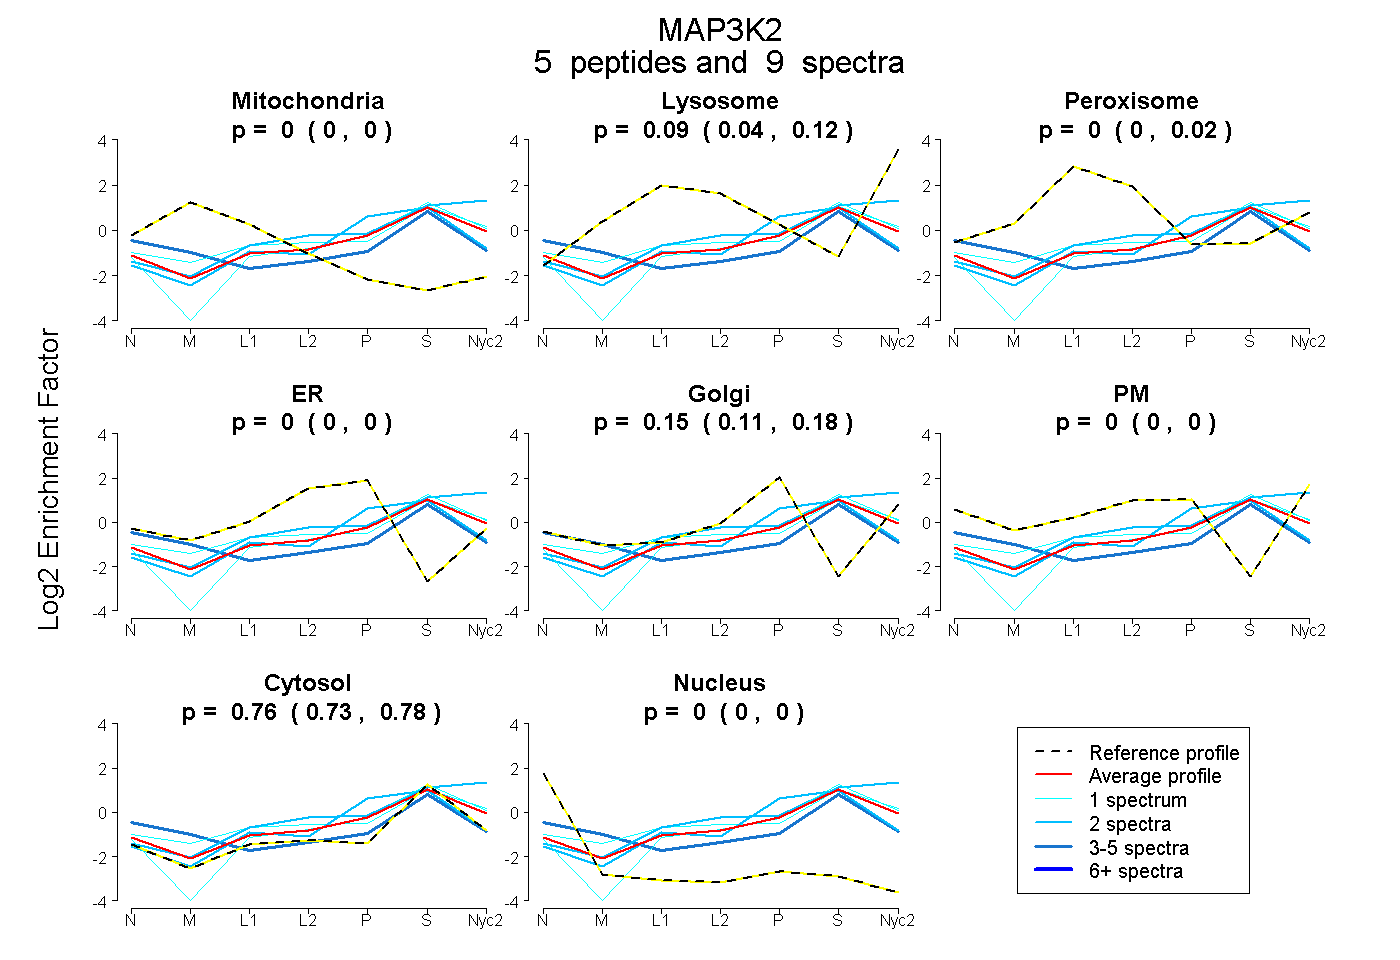
| Expt A |
5 peptides |
9 spectra |
|
0.000 0.000 | 0.000 |
0.091 0.040 | 0.124 |
0.000 0.000 | 0.020 |
0.000 0.000 | 0.000 |
0.150 0.115 | 0.180 |
0.000 0.000 | 0.000 |
0.758 0.728 | 0.782 |
0.000 0.000 | 0.000 |
||
| Plot | Mito | Lyso or Perox | ER | Golgi | PM | Cytosol | Nucleus | ||||||
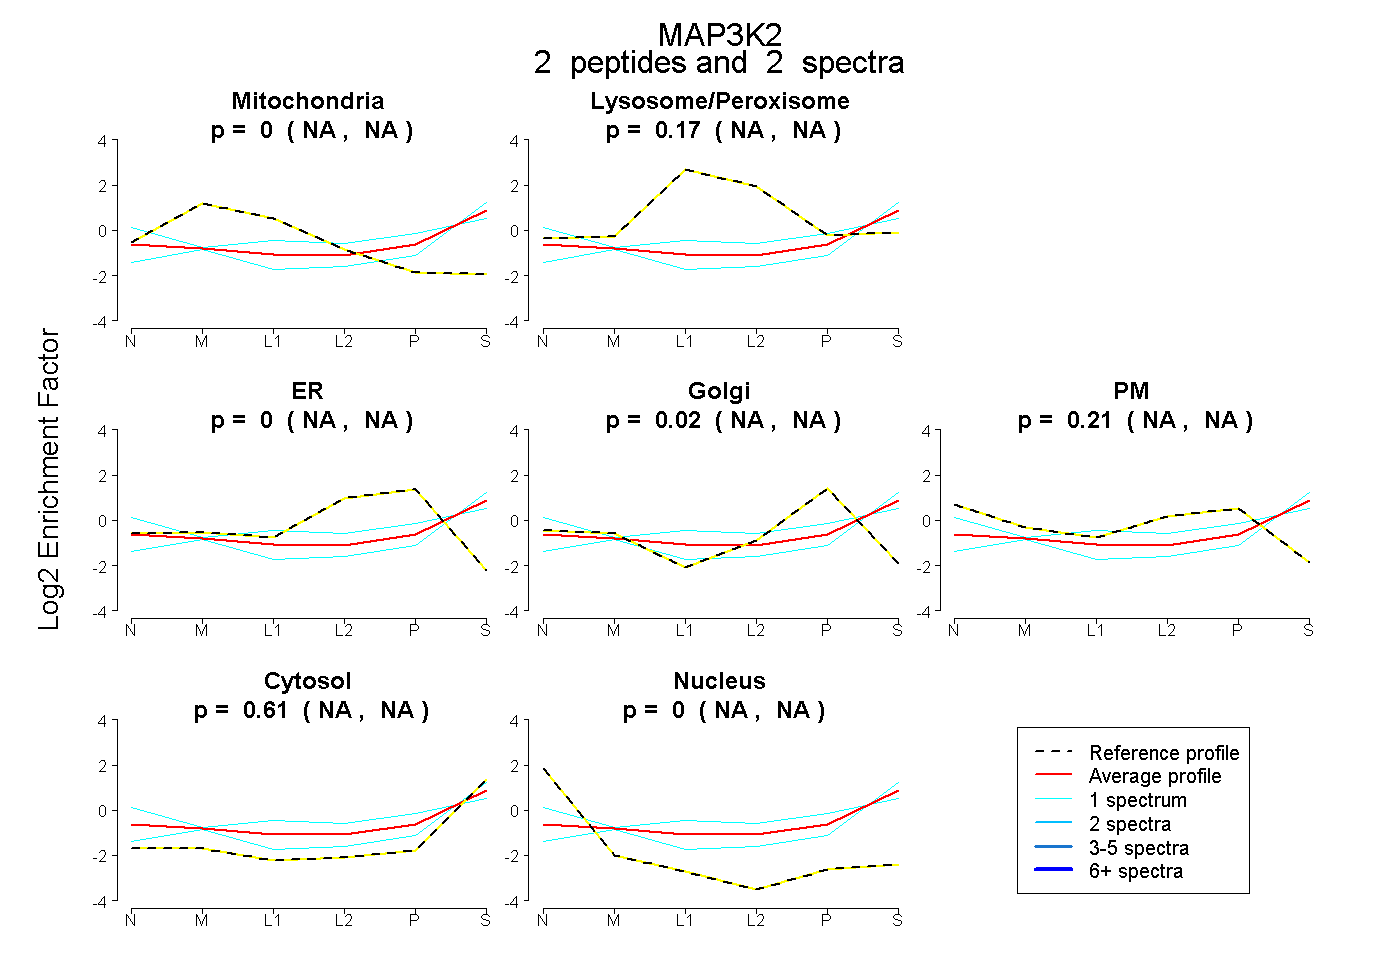
| Expt B |
2 peptides |
2 spectra |
|
0.000 NA | NA |
0.169 NA | NA |
0.000 NA | NA |
0.016 NA | NA |
0.209 NA | NA |
0.606 NA | NA |
0.000 NA | NA |
| 1 spectrum, GADILR | 0.000 | 0.240 | 0.000 | 0.000 | 0.357 | 0.403 | 0.000 | |||
| 1 spectrum, AYGALTENVTR | 0.022 | 0.101 | 0.000 | 0.088 | 0.000 | 0.789 | 0.000 |
| Plot | Lyso | Other | |||||||||||
| Expt C |
2 peptides |
5 spectra |
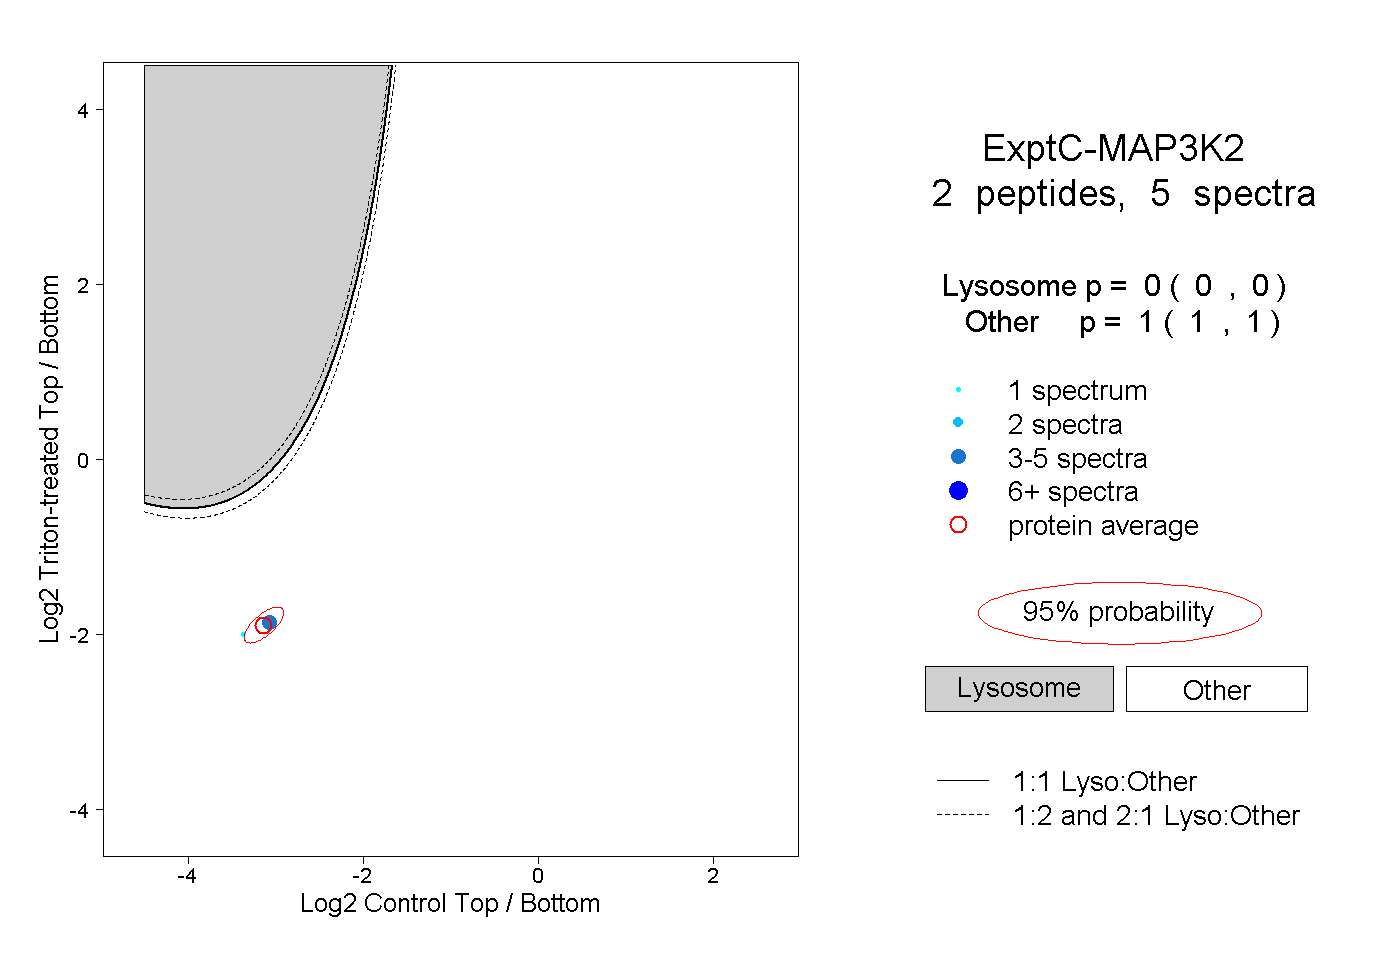 |
0.000 0.000 | 0.000 |
1.000 1.000 | 1.000 |