 33
33peptides
spectra
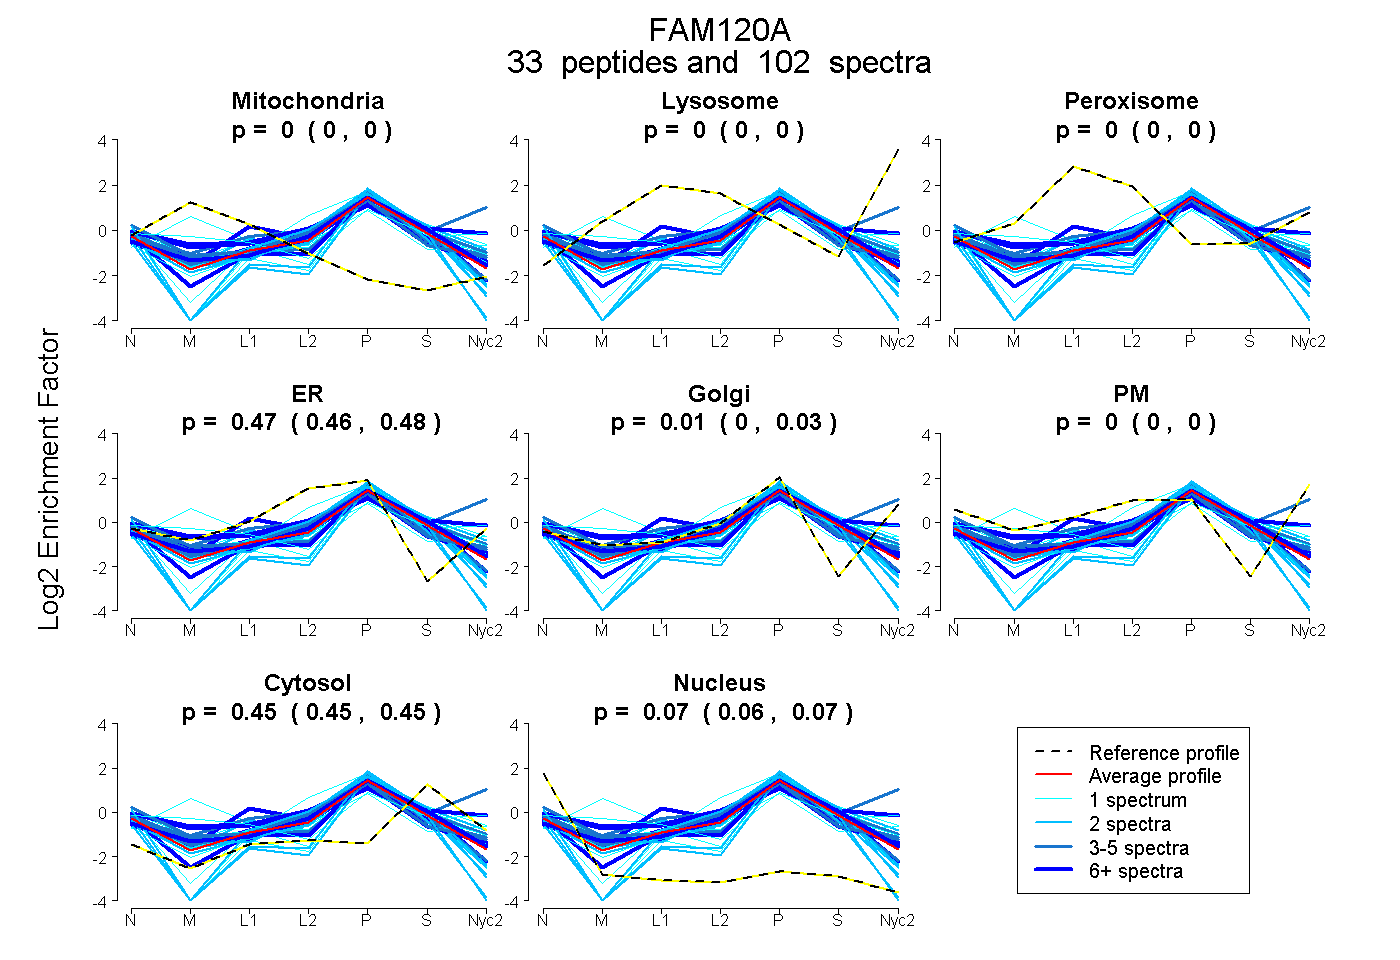
0.000 | 0.000
0.000 | 0.000
0.000 | 0.000
0.460 | 0.481
0.001 | 0.026
0.000 | 0.000
0.447 | 0.451
0.063 | 0.068
17peptides
spectra
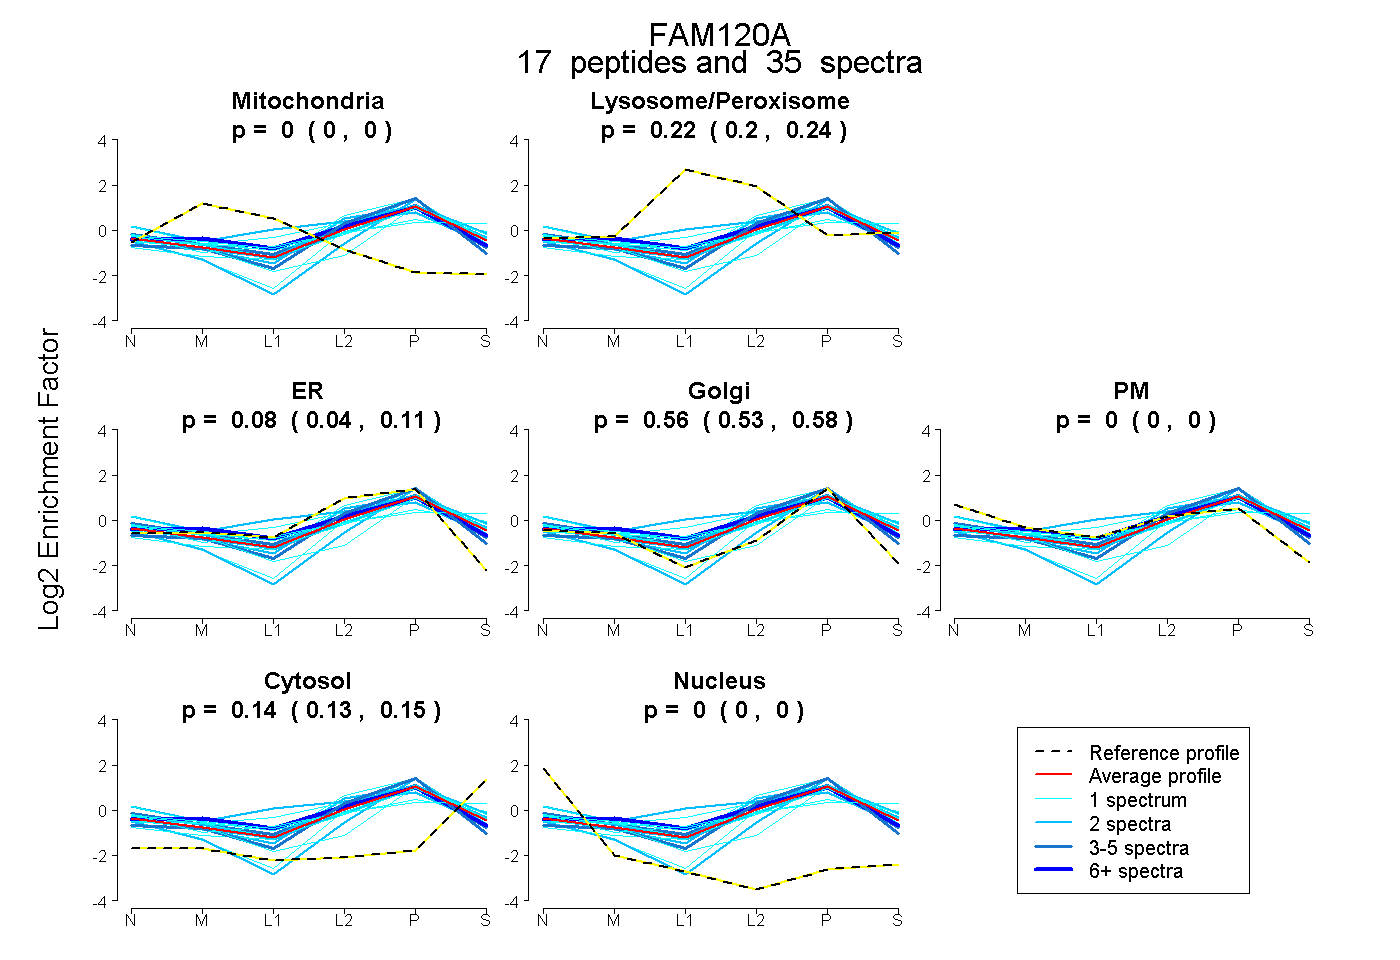
0.000 | 0.000
0.204 | 0.238
0.042 | 0.109
0.526 | 0.581
0.000 | 0.000
0.134 | 0.152
0.000 | 0.000
23peptides
spectra
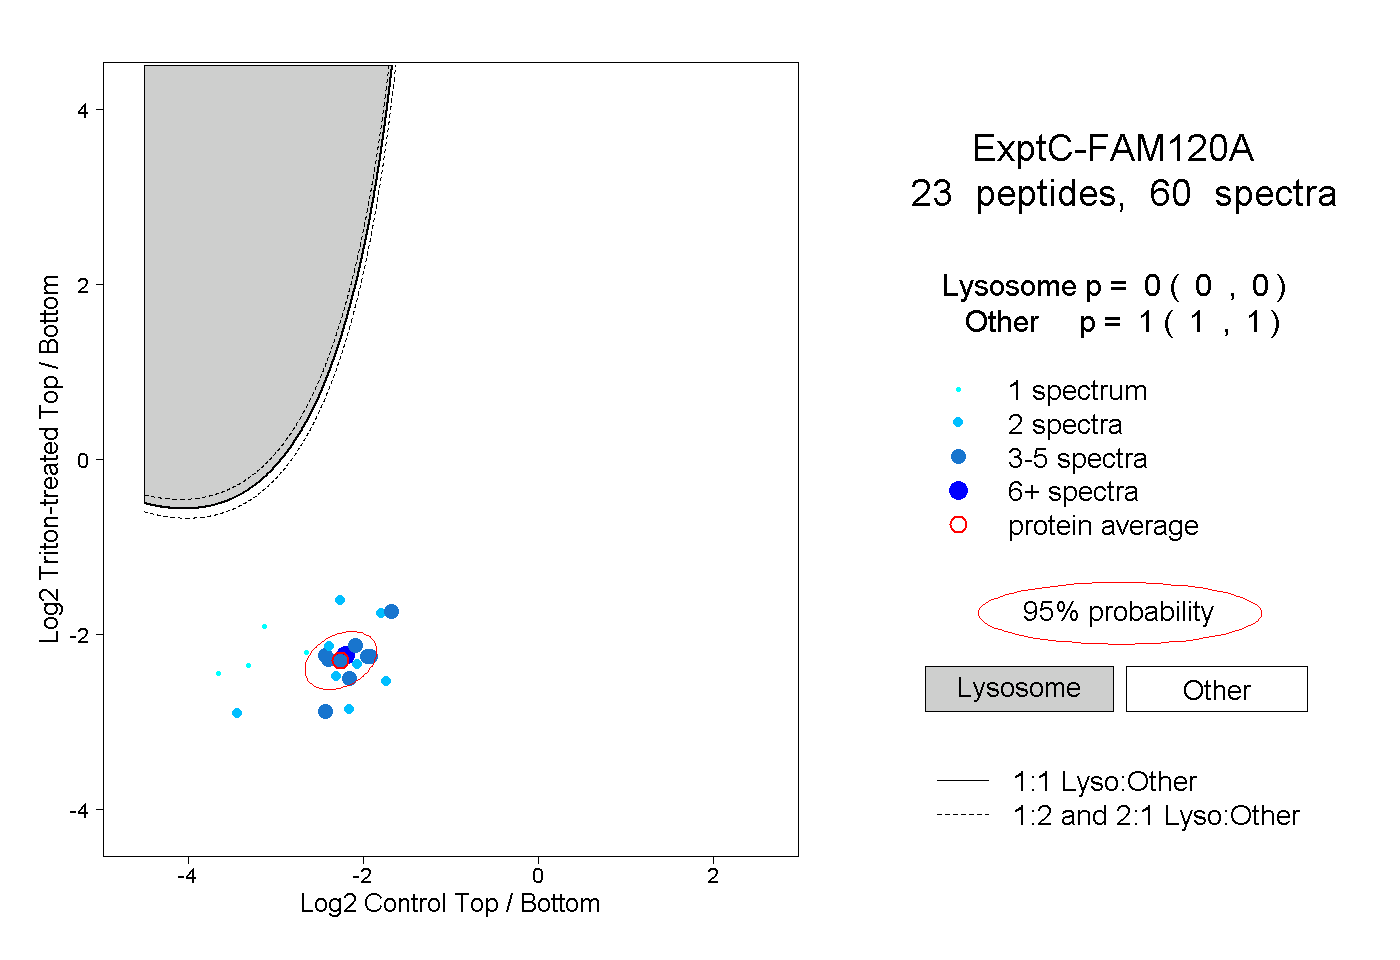
0.000 | 0.000
1.000 | 1.000
4peptides
spectra
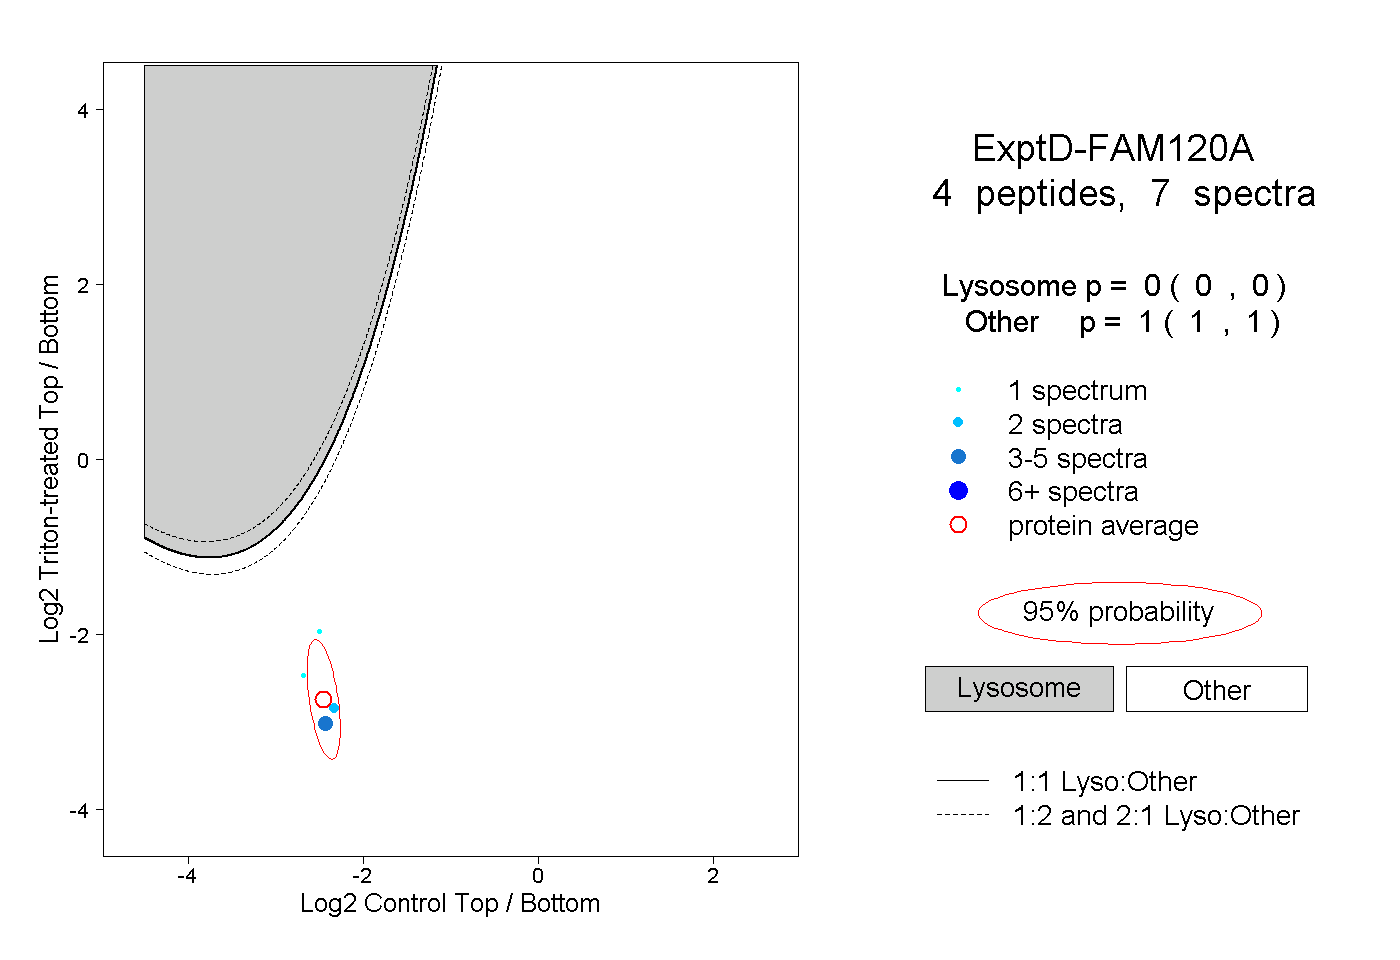
0.000 | 0.000
1.000 | 1.000