 33
33peptides
spectra
0.000 | 0.000
0.000 | 0.000
0.000 | 0.000
0.460 | 0.481
0.001 | 0.026
0.000 | 0.000
0.447 | 0.451
0.063 | 0.068
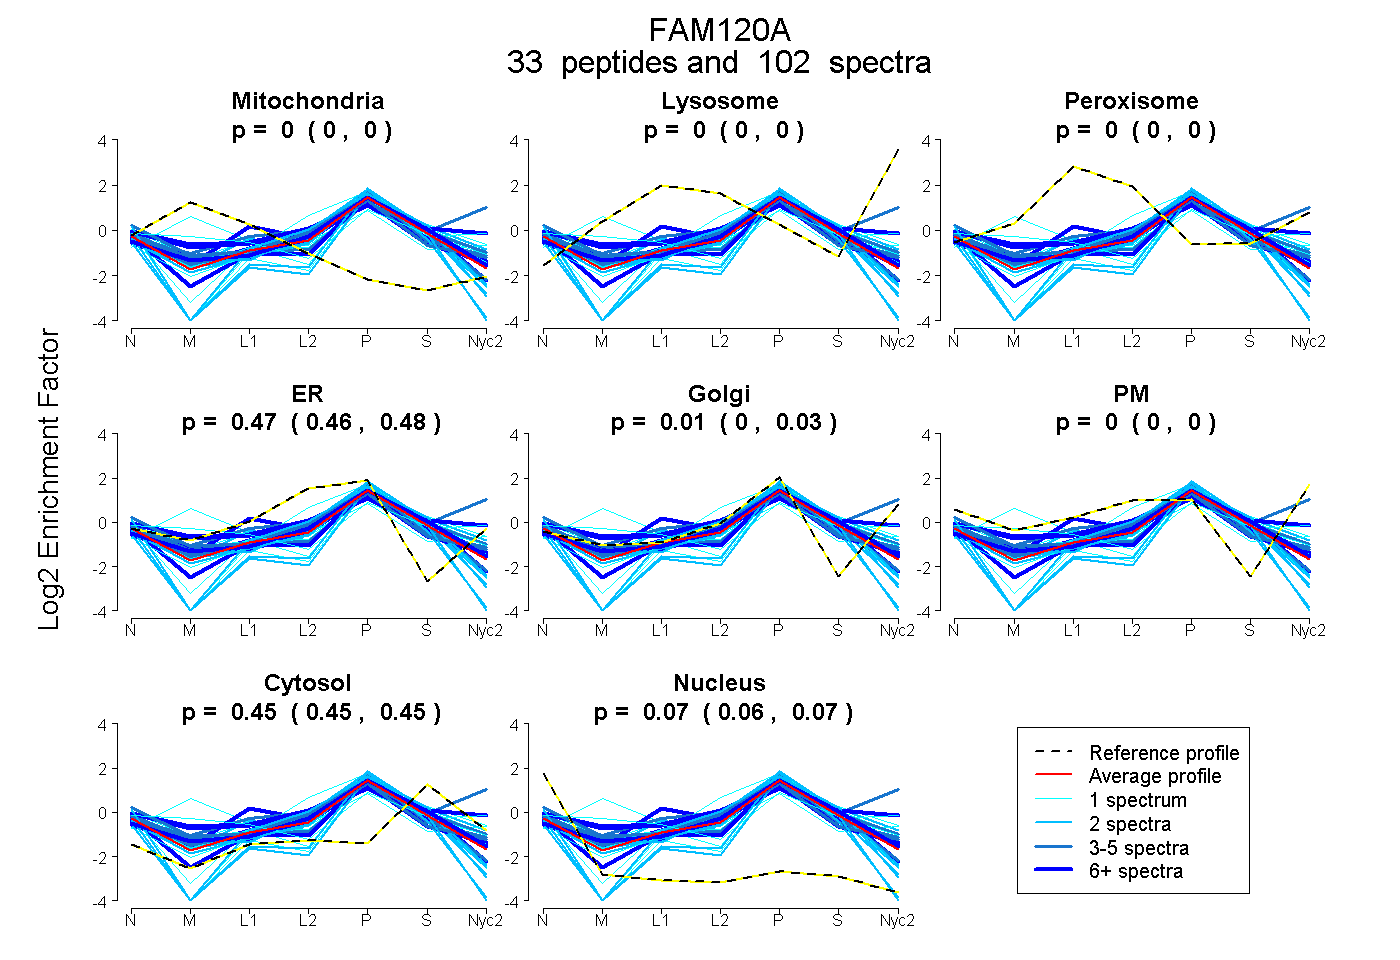
| Plot | Mito | Lyso | Perox | ER | Golgi | PM | Cytosol | Nucleus | |||||
| Expt A |
33 peptides |
102 spectra |
|
0.000 0.000 | 0.000 |
0.000 0.000 | 0.000 |
0.000 0.000 | 0.000 |
0.471 0.460 | 0.481 |
0.014 0.001 | 0.026 |
0.000 0.000 | 0.000 |
0.449 0.447 | 0.451 |
0.066 0.063 | 0.068 |
| 1 spectrum, DVFQHSQSR | 0.285 | 0.000 | 0.093 | 0.000 | 0.467 | 0.000 | 0.155 | 0.000 | ||
| 3 spectra, GSLVGGGR | 0.000 | 0.175 | 0.042 | 0.000 | 0.436 | 0.053 | 0.294 | 0.000 | ||
| 1 spectrum, APSHSESALNNDSK | 0.000 | 0.000 | 0.000 | 0.354 | 0.150 | 0.000 | 0.492 | 0.003 | ||
| 8 spectra, GTPPPK | 0.000 | 0.000 | 0.000 | 0.060 | 0.510 | 0.000 | 0.430 | 0.000 | ||
| 3 spectra, SPQTPELVEALAFR | 0.000 | 0.000 | 0.000 | 0.516 | 0.000 | 0.000 | 0.410 | 0.074 | ||
| 2 spectra, AVADYVR | 0.000 | 0.000 | 0.000 | 0.435 | 0.042 | 0.000 | 0.445 | 0.078 | ||
| 6 spectra, GSHMGTVQPIPCLLSMPTR | 0.000 | 0.000 | 0.000 | 0.569 | 0.000 | 0.000 | 0.418 | 0.014 | ||
| 6 spectra, LEIAGTVVGHWAGSR | 0.000 | 0.000 | 0.000 | 0.365 | 0.019 | 0.000 | 0.481 | 0.135 | ||
| 2 spectra, SQGGVQPIPSQGGK | 0.000 | 0.000 | 0.000 | 0.075 | 0.138 | 0.000 | 0.537 | 0.250 | ||
| 2 spectra, DLPPAALLYRPVR | 0.000 | 0.000 | 0.000 | 0.393 | 0.117 | 0.000 | 0.490 | 0.000 | ||
| 4 spectra, QSILEGLNFSR | 0.000 | 0.000 | 0.000 | 0.404 | 0.202 | 0.000 | 0.357 | 0.037 | ||
| 1 spectrum, VEGSSTASSGSQLAEGK | 0.223 | 0.000 | 0.002 | 0.000 | 0.423 | 0.000 | 0.352 | 0.000 | ||
| 7 spectra, AFLACMR | 0.000 | 0.000 | 0.000 | 0.533 | 0.000 | 0.000 | 0.467 | 0.000 | ||
| 2 spectra, VAQSIEDHHQEVIGFCR | 0.000 | 0.000 | 0.000 | 0.395 | 0.000 | 0.000 | 0.361 | 0.243 | ||
| 1 spectrum, SLTTSQYLMHEVAK | 0.000 | 0.000 | 0.000 | 0.498 | 0.000 | 0.000 | 0.426 | 0.076 | ||
| 2 spectra, TCNTNPHLNALSTDSACR | 0.000 | 0.000 | 0.000 | 0.039 | 0.263 | 0.000 | 0.527 | 0.171 | ||
| 4 spectra, EWAAYK | 0.000 | 0.000 | 0.000 | 0.519 | 0.000 | 0.000 | 0.462 | 0.020 | ||
| 2 spectra, QLDLNPNR | 0.000 | 0.000 | 0.000 | 0.330 | 0.152 | 0.000 | 0.485 | 0.033 | ||
| 6 spectra, YMVQWPGAR | 0.000 | 0.000 | 0.000 | 0.462 | 0.037 | 0.000 | 0.485 | 0.017 | ||
| 1 spectrum, LHEWVK | 0.000 | 0.000 | 0.000 | 0.448 | 0.000 | 0.000 | 0.343 | 0.209 | ||
| 12 spectra, QRPPQTPLR | 0.077 | 0.000 | 0.000 | 0.585 | 0.000 | 0.000 | 0.318 | 0.020 | ||
| 2 spectra, GVQGFQDYIEK | 0.000 | 0.000 | 0.000 | 0.480 | 0.000 | 0.000 | 0.423 | 0.097 | ||
| 2 spectra, EWTCPNLK | 0.000 | 0.000 | 0.000 | 0.483 | 0.000 | 0.000 | 0.394 | 0.123 | ||
| 6 spectra, LLVDADNCLHR | 0.074 | 0.000 | 0.000 | 0.520 | 0.000 | 0.000 | 0.375 | 0.031 | ||
| 1 spectrum, HCPSAVVPVELQK | 0.000 | 0.000 | 0.028 | 0.000 | 0.609 | 0.000 | 0.363 | 0.000 | ||
| 1 spectrum, GDPGDQVK | 0.000 | 0.000 | 0.000 | 0.310 | 0.027 | 0.000 | 0.484 | 0.180 | ||
| 1 spectrum, QTAQQIVSHVQNK | 0.000 | 0.000 | 0.000 | 0.382 | 0.140 | 0.000 | 0.474 | 0.003 | ||
| 3 spectra, TGSHAEPLAR | 0.000 | 0.000 | 0.000 | 0.446 | 0.149 | 0.000 | 0.307 | 0.098 | ||
| 1 spectrum, GLMYPYIFHVLTK | 0.000 | 0.000 | 0.000 | 0.000 | 0.376 | 0.000 | 0.574 | 0.050 | ||
| 2 spectra, IAVSIEDEANK | 0.000 | 0.000 | 0.000 | 0.453 | 0.000 | 0.000 | 0.448 | 0.100 | ||
| 2 spectra, SDTPAMLNPANVPTHLMVLCCVLR | 0.000 | 0.000 | 0.000 | 0.510 | 0.000 | 0.000 | 0.294 | 0.196 | ||
| 3 spectra, HTPLYER | 0.000 | 0.000 | 0.000 | 0.191 | 0.329 | 0.000 | 0.441 | 0.039 | ||
| 2 spectra, LPPEFSPLIIK | 0.000 | 0.000 | 0.000 | 0.497 | 0.000 | 0.000 | 0.386 | 0.117 |
| Plot | Mito | Lyso or Perox | ER | Golgi | PM | Cytosol | Nucleus | ||||||
| Expt B |
17 peptides |
35 spectra |
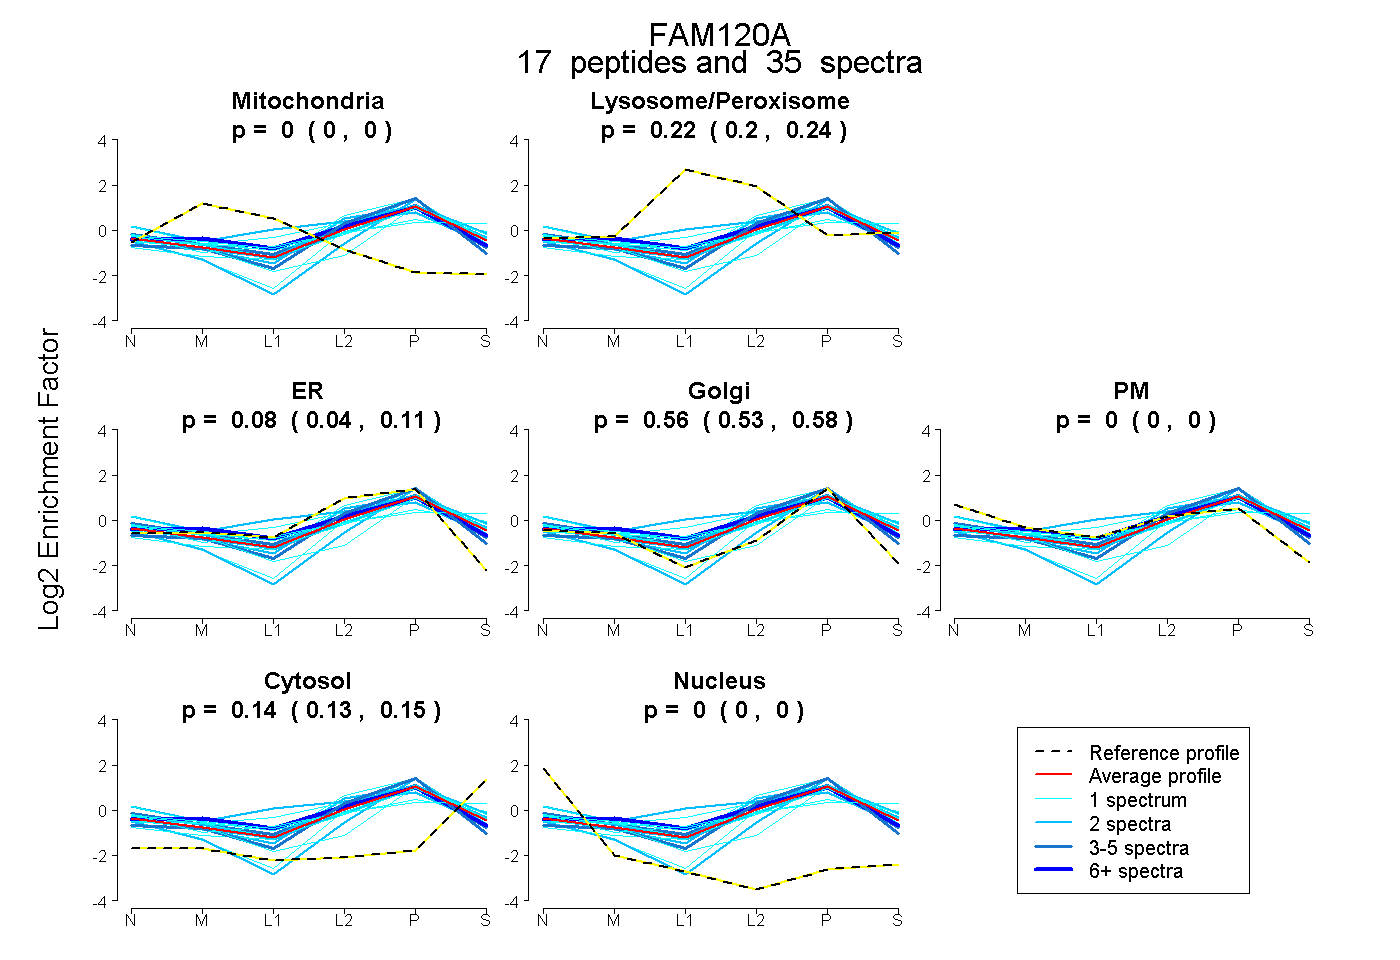 |
0.000 0.000 | 0.000 |
0.223 0.204 | 0.238 |
0.077 0.042 | 0.109 |
0.556 0.526 | 0.581 |
0.000 0.000 | 0.000 |
0.143 0.134 | 0.152 |
0.000 0.000 | 0.000 |
|||
| Plot | Lyso | Other | |||||||||||
| Expt C |
23 peptides |
60 spectra |
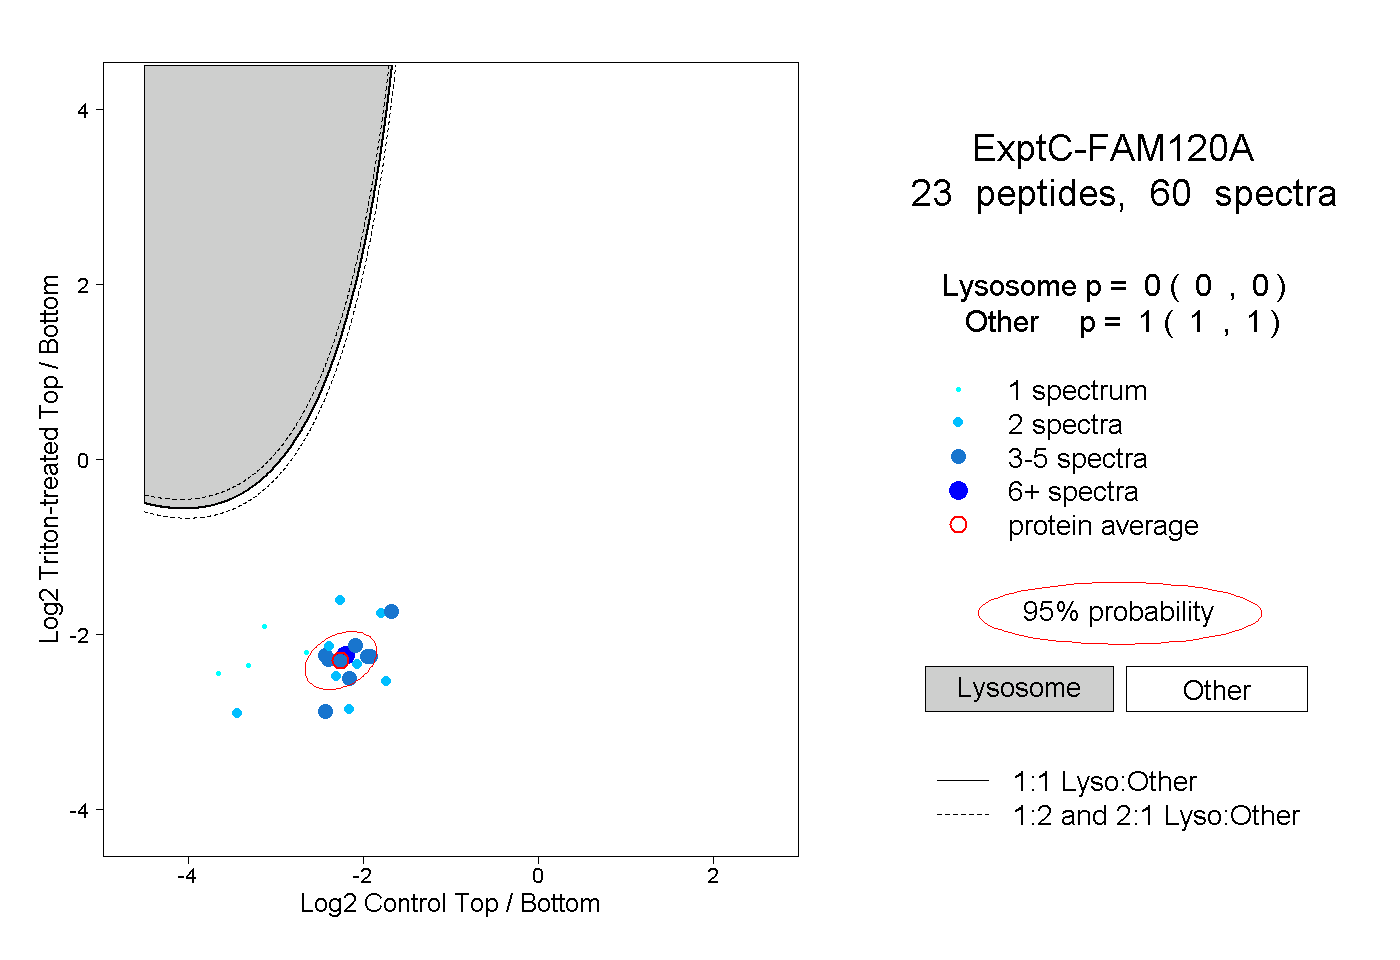 |
0.000 0.000 | 0.000 |
1.000 1.000 | 1.000 |
||||||||
| Plot | Lyso | Other | |||||||||||
| Expt D |
4 peptides |
7 spectra |
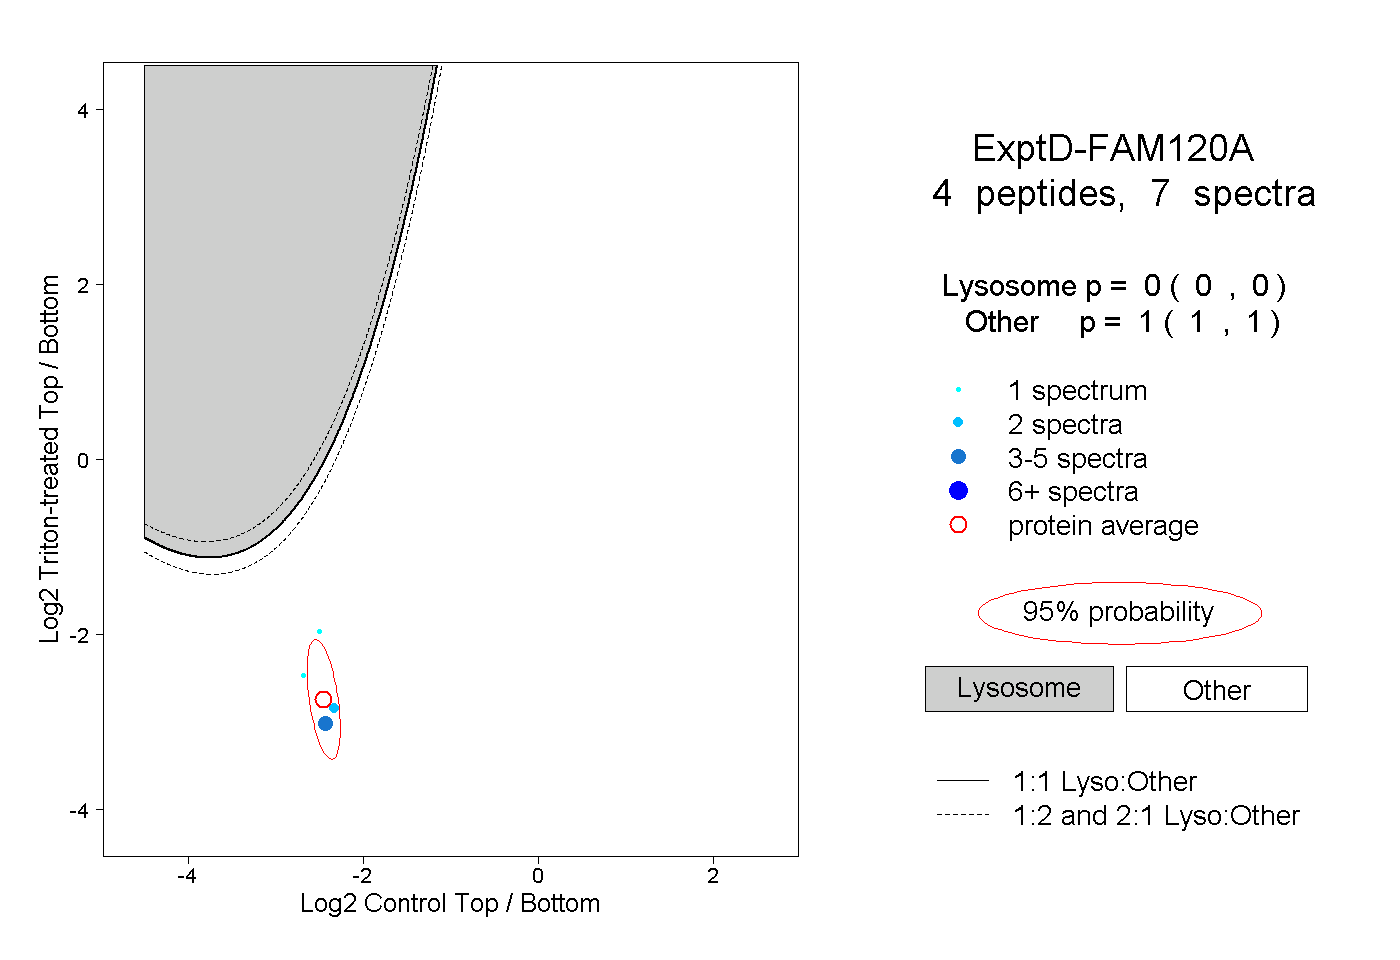 |
0.000 0.000 | 0.000 |
1.000 1.000 | 1.000 |