 5
5peptides
spectra
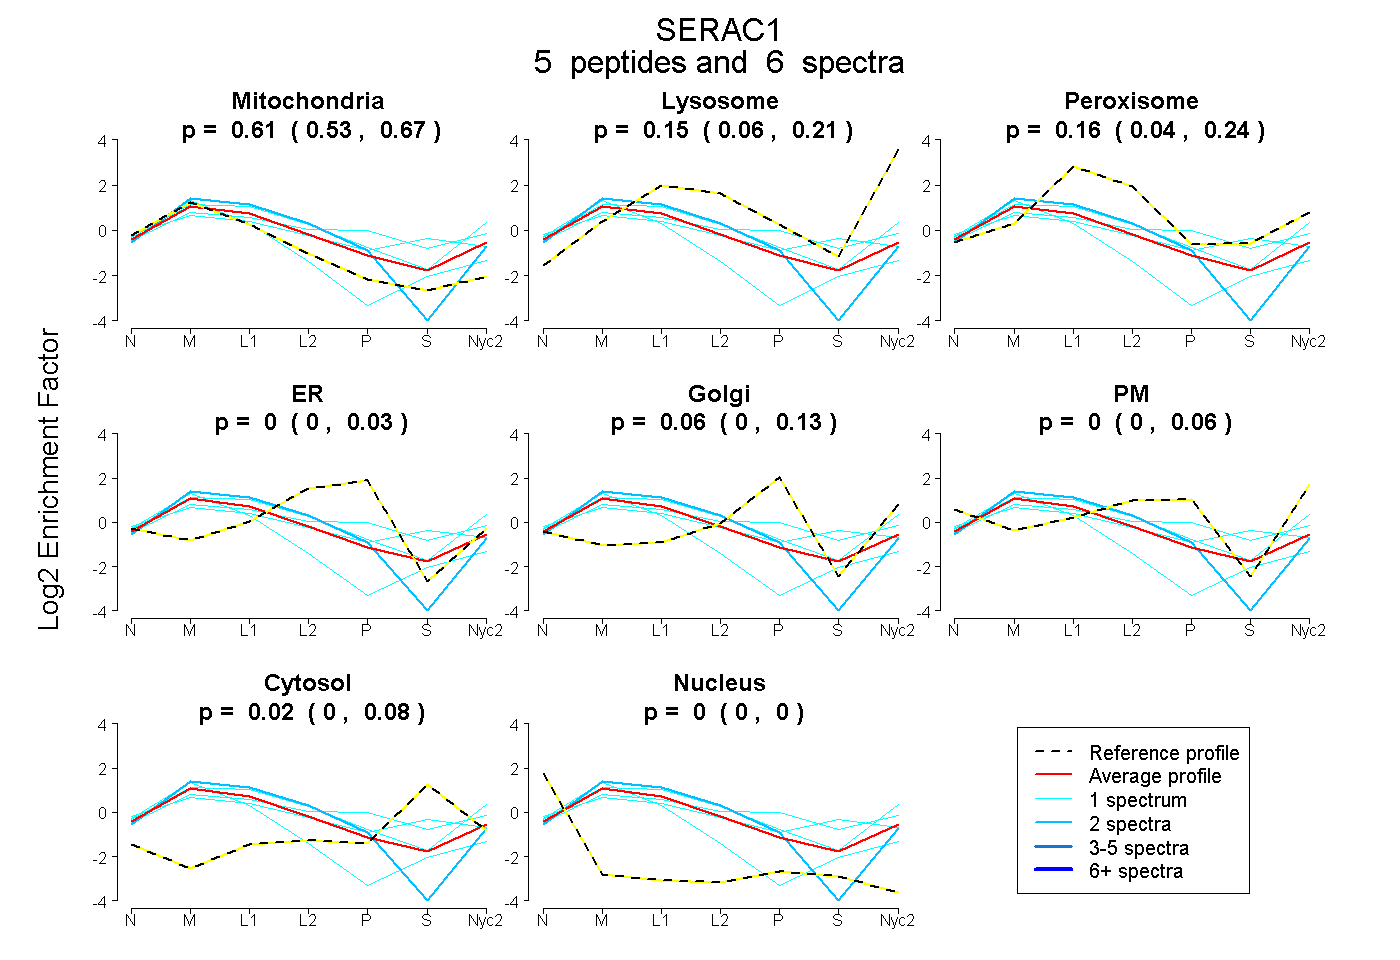
0.526 | 0.672
0.055 | 0.206
0.041 | 0.244
0.000 | 0.027
0.000 | 0.129
0.000 | 0.065
0.000 | 0.076
0.000 | 0.000
16peptides
spectra
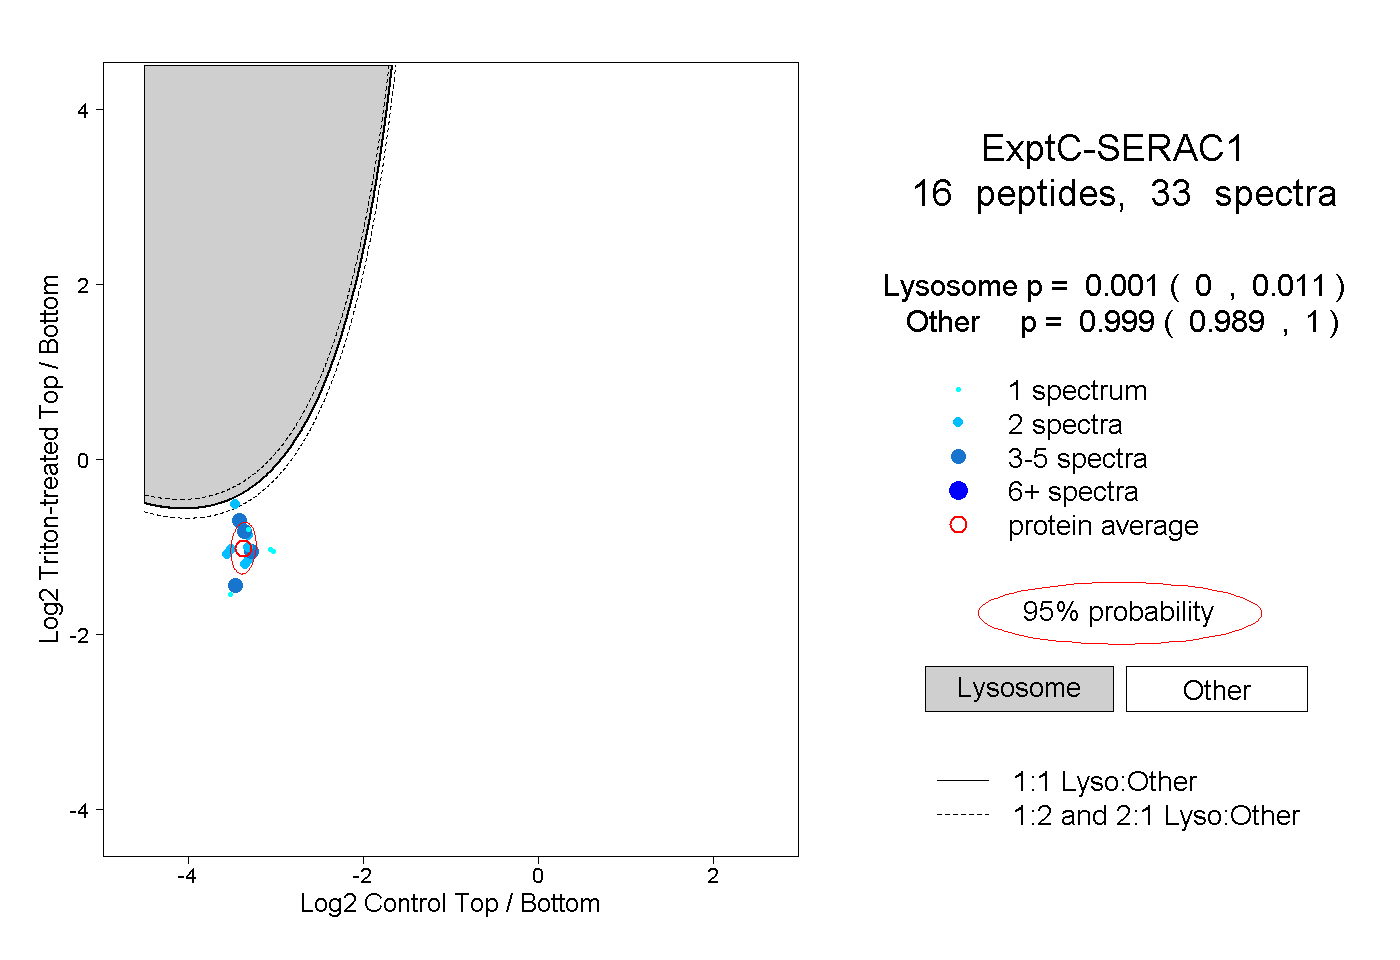
0.000 | 0.011
0.989 | 1.000
1peptide
spectrum
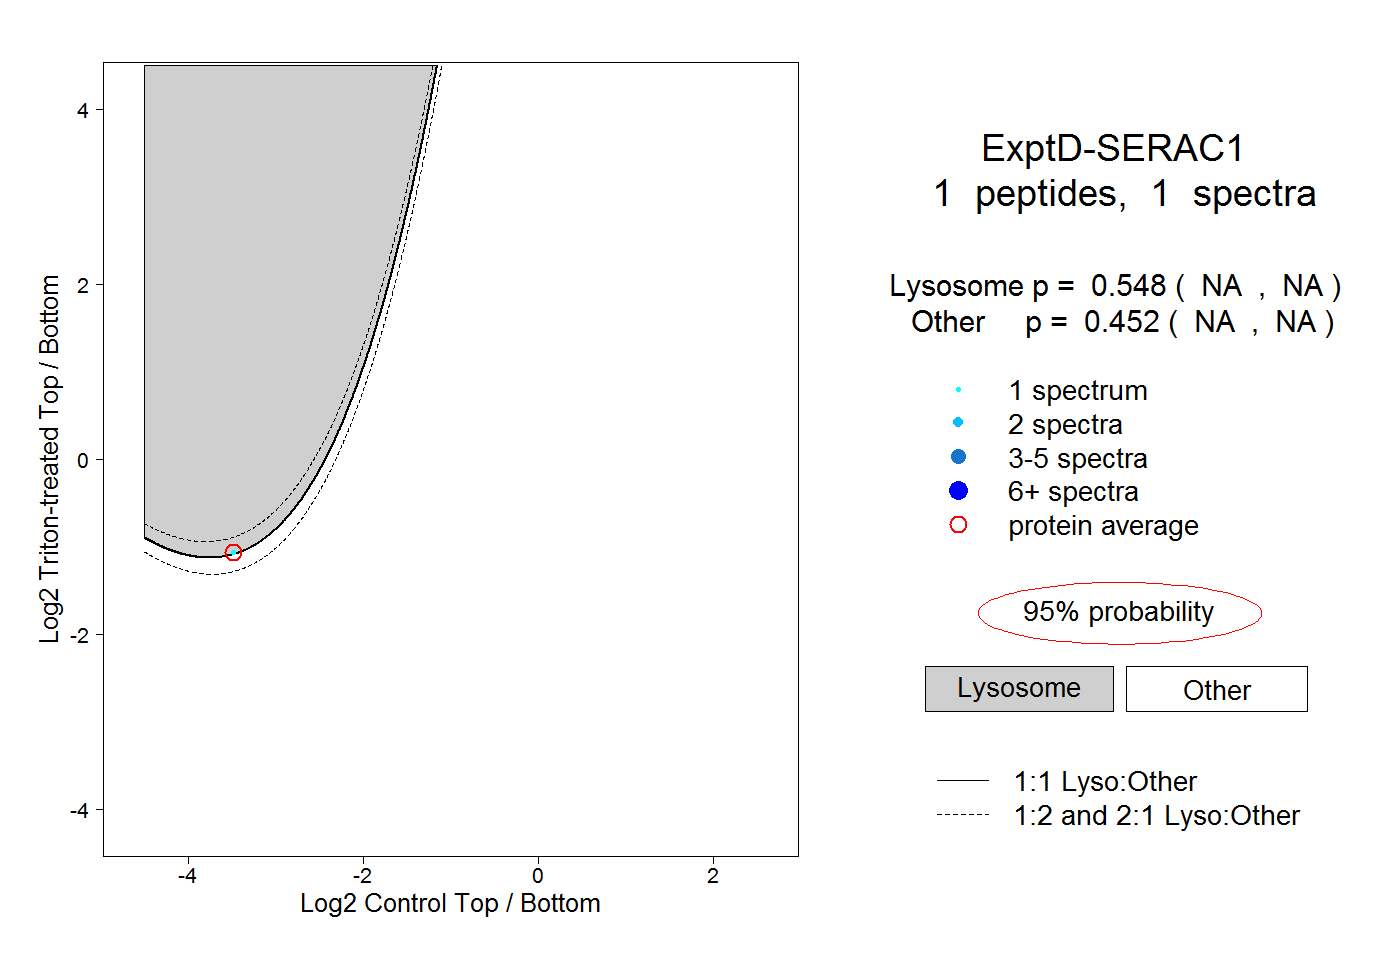
NA | NA
NA | NA