 5
5peptides
spectra
0.526 | 0.672
0.055 | 0.206
0.041 | 0.244
0.000 | 0.027
0.000 | 0.129
0.000 | 0.065
0.000 | 0.076
0.000 | 0.000
| Plot | Mito | Lyso | Perox | ER | Golgi | PM | Cytosol | Nucleus | |||||
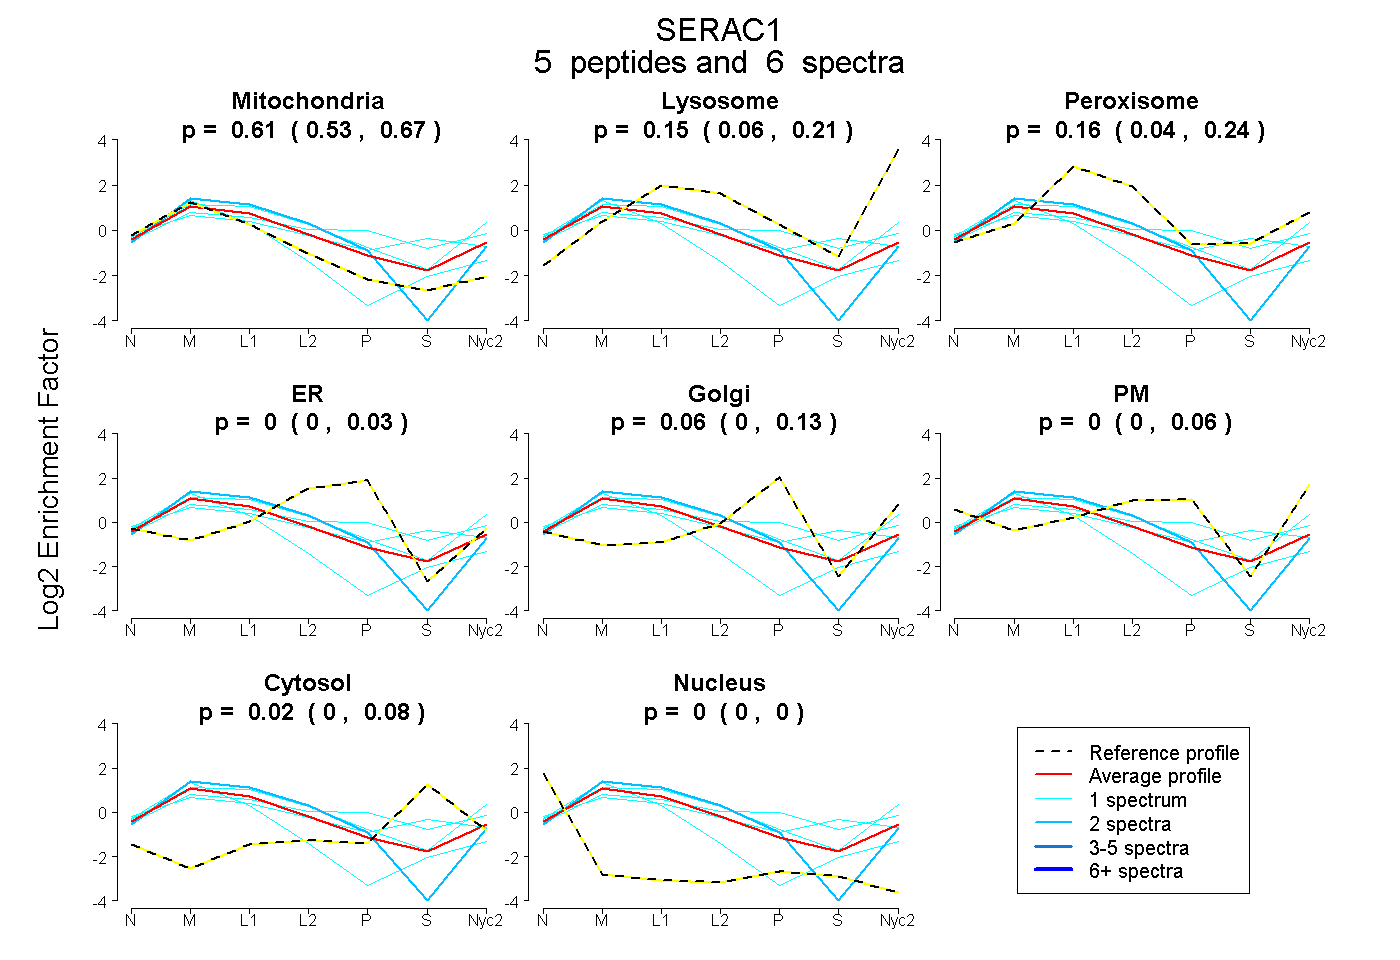
| Expt A |
5 peptides |
6 spectra |
|
0.611 0.526 | 0.672 |
0.150 0.055 | 0.206 |
0.157 0.041 | 0.244 |
0.000 0.000 | 0.027 |
0.064 0.000 | 0.129 |
0.000 0.000 | 0.065 |
0.019 0.000 | 0.076 |
0.000 0.000 | 0.000 |
| 1 spectrum, DAFLYQR | 0.938 | 0.007 | 0.000 | 0.000 | 0.000 | 0.000 | 0.055 | 0.000 | ||
| 1 spectrum, IIAQACDPR | 0.295 | 0.051 | 0.322 | 0.000 | 0.232 | 0.000 | 0.100 | 0.000 | ||
| 2 spectra, MLQDEFLELVK | 0.643 | 0.155 | 0.000 | 0.202 | 0.000 | 0.000 | 0.000 | 0.000 | ||
| 1 spectrum, ADVLFIHGLMGAAFK | 0.471 | 0.269 | 0.143 | 0.000 | 0.000 | 0.117 | 0.000 | 0.000 | ||
| 1 spectrum, LYQLHK | 0.384 | 0.000 | 0.311 | 0.000 | 0.000 | 0.056 | 0.249 | 0.000 |
| Plot | Lyso | Other | |||||||||||
| Expt C |
16 peptides |
33 spectra |
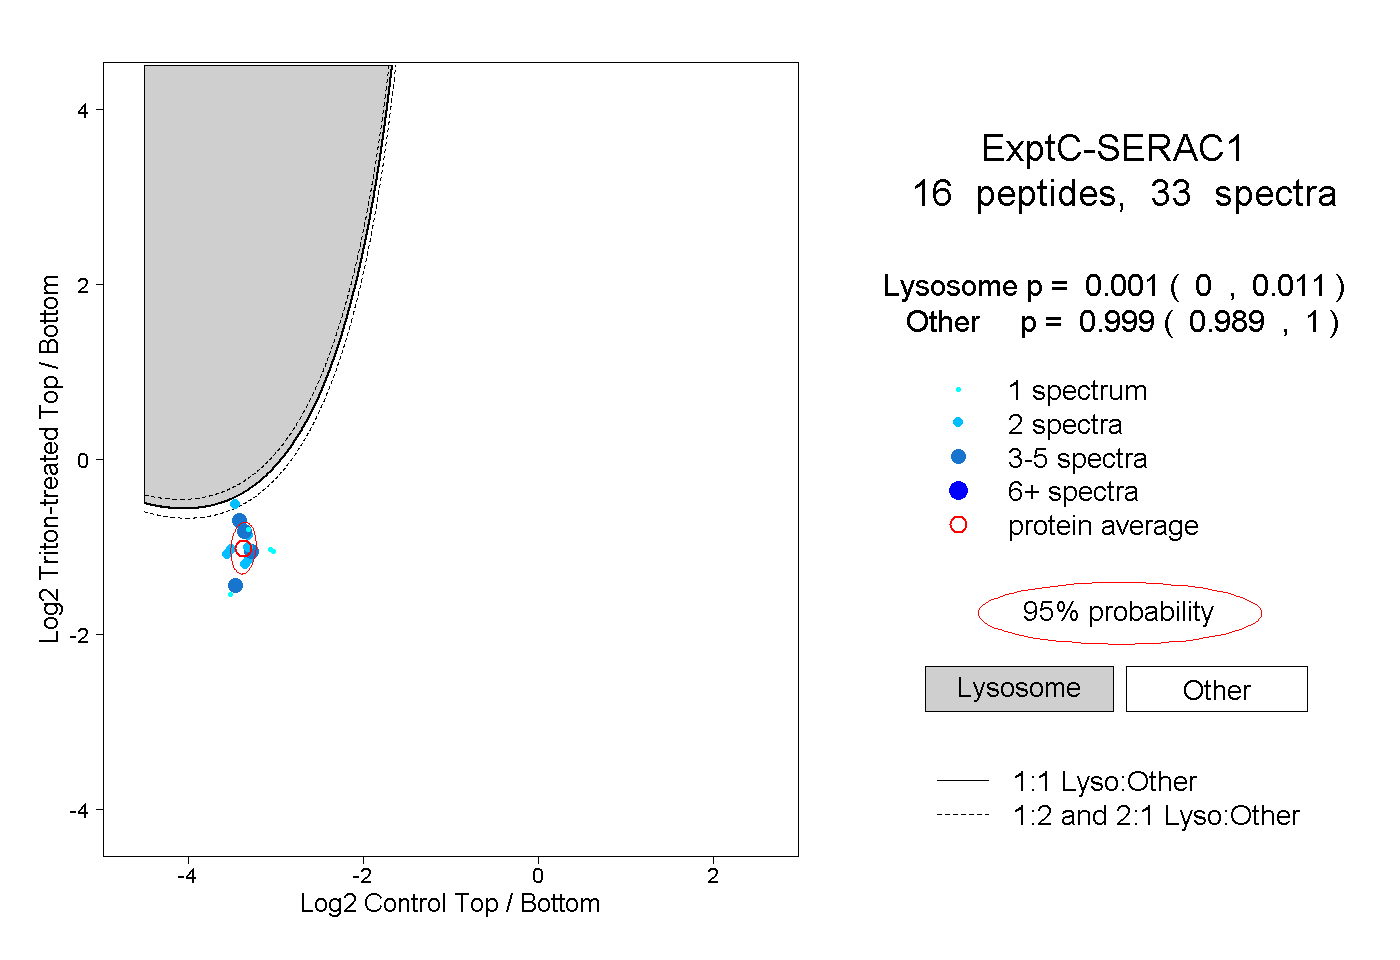 |
0.001 0.000 | 0.011 |
0.999 0.989 | 1.000 |
||||||||
| Plot | Lyso | Other | |||||||||||
| Expt D |
1 peptide |
1 spectrum |
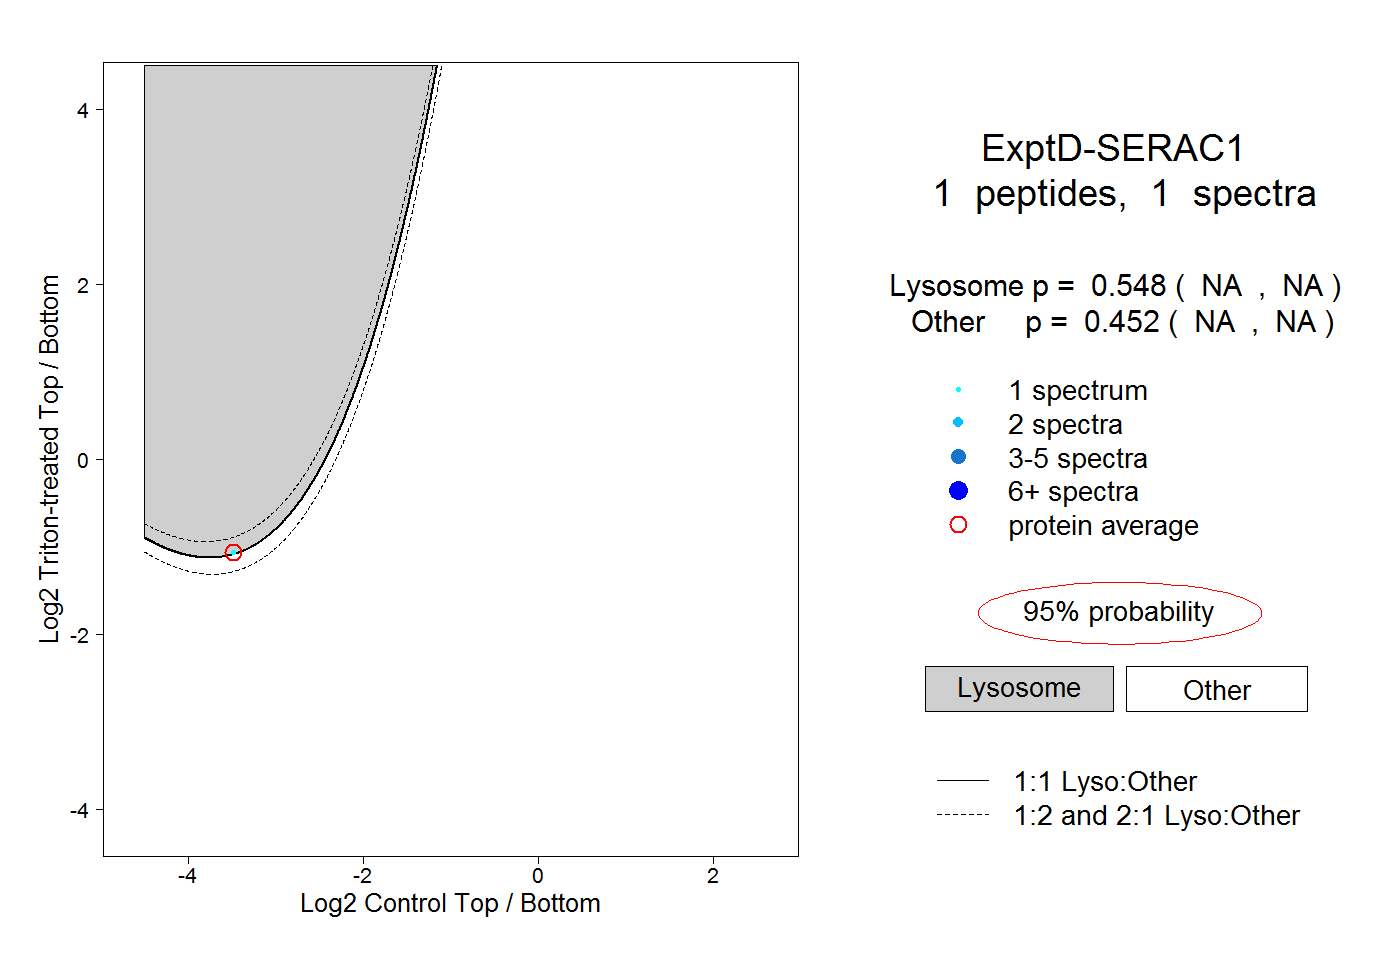 |
0.548 NA | NA |
0.452 NA | NA |