 5
5peptides
spectra
0.526 | 0.672
0.055 | 0.206
0.041 | 0.244
0.000 | 0.027
0.000 | 0.129
0.000 | 0.065
0.000 | 0.076
0.000 | 0.000
16peptides
spectra
0.000 | 0.011
0.989 | 1.000
| Plot | Mito | Lyso | Perox | ER | Golgi | PM | Cytosol | Nucleus | |||||
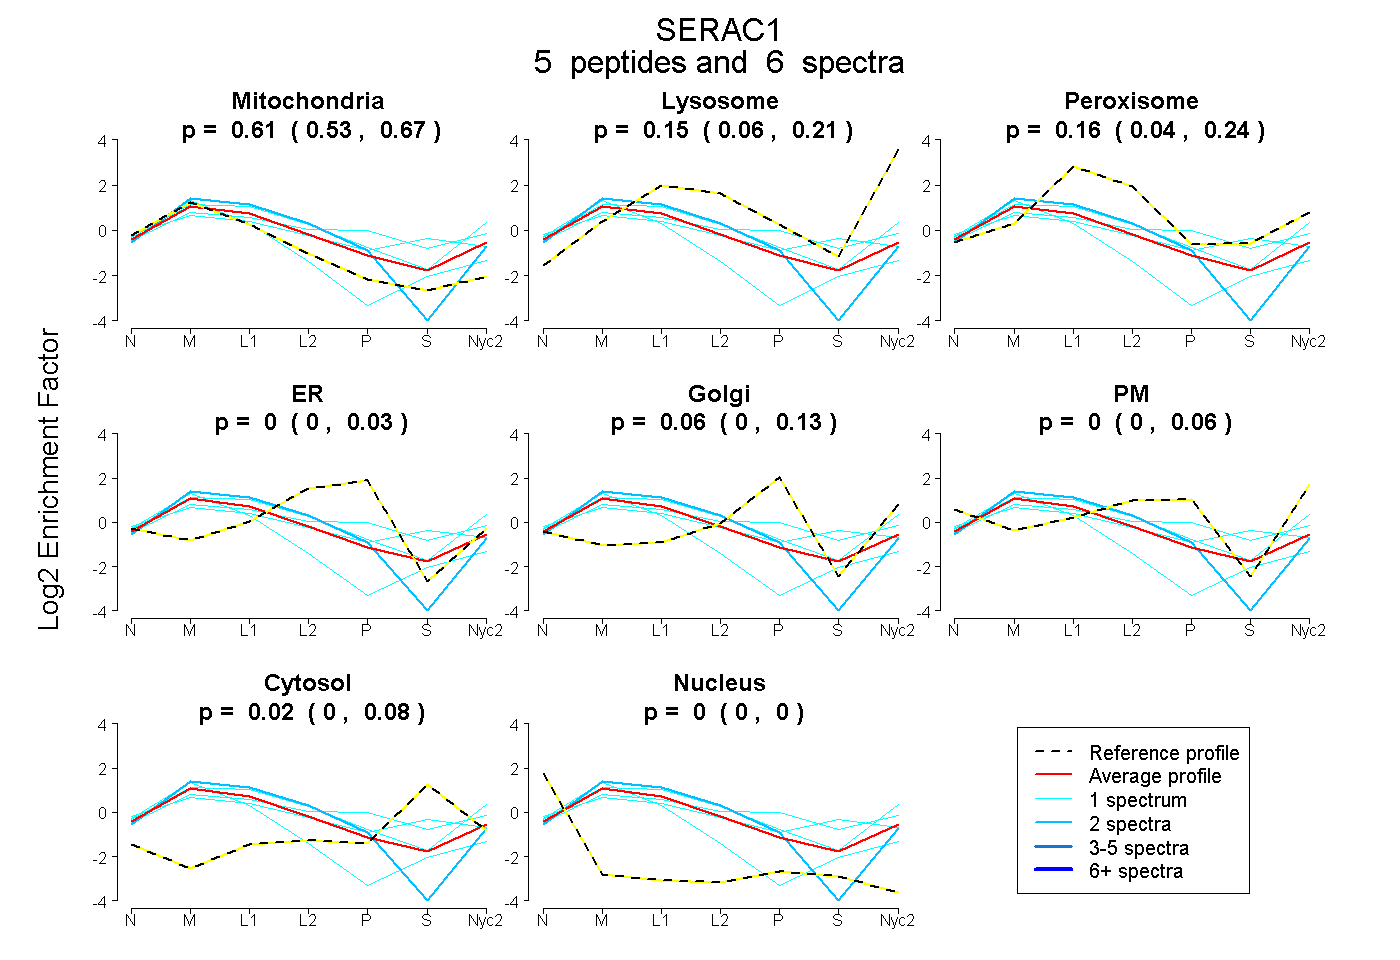
| Expt A |
5 peptides |
6 spectra |
|
0.611 0.526 | 0.672 |
0.150 0.055 | 0.206 |
0.157 0.041 | 0.244 |
0.000 0.000 | 0.027 |
0.064 0.000 | 0.129 |
0.000 0.000 | 0.065 |
0.019 0.000 | 0.076 |
0.000 0.000 | 0.000 |
||
| Plot | Lyso | Other | |||||||||||
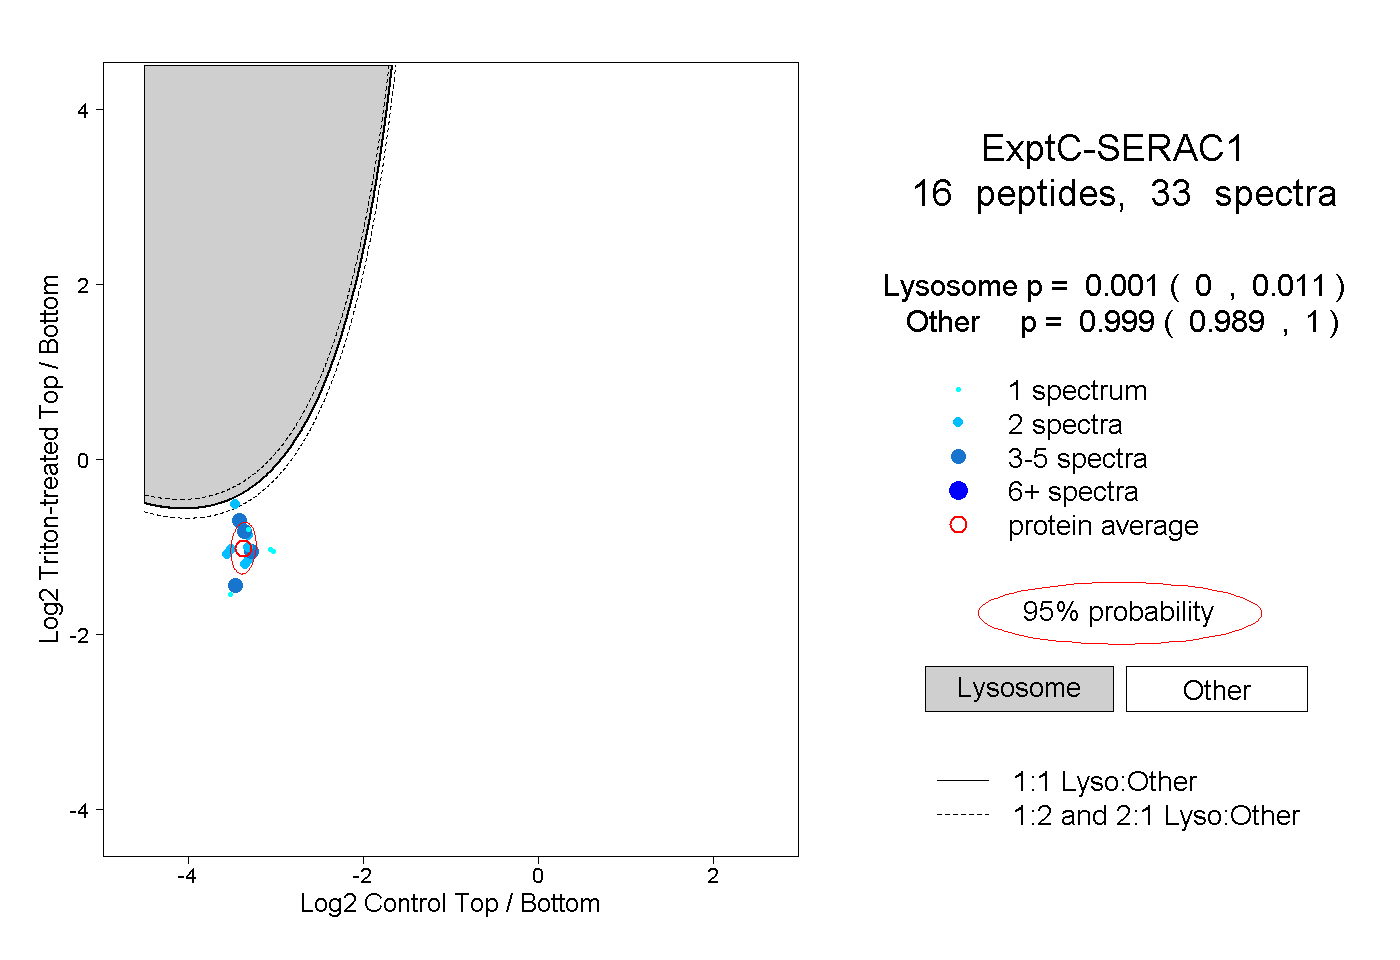
| Expt C |
16 peptides |
33 spectra |
|
0.001 0.000 | 0.011 |
0.999 0.989 | 1.000 |
| 4 spectra, TSQPIK | 0.000 | 1.000 | ||||||||
| 1 spectrum, YLLFPSLEVK | 0.008 | 0.992 | ||||||||
| 1 spectrum, SYIYVHK | 0.000 | 1.000 | ||||||||
| 2 spectra, LAEYSVNIR | 0.001 | 0.999 | ||||||||
| 2 spectra, VLAAAAK | 0.002 | 0.998 | ||||||||
| 2 spectra, SNELLSK | 0.004 | 0.996 | ||||||||
| 2 spectra, TLQFICETLAR | 0.001 | 0.999 | ||||||||
| 2 spectra, DCPALR | 0.000 | 1.000 | ||||||||
| 1 spectrum, ADVLFIHGLMGAAFK | 0.000 | 1.000 | ||||||||
| 1 spectrum, MLLEASQKPELSALINNTR | 0.008 | 0.992 | ||||||||
| 3 spectra, TLIGLAR | 0.042 | 0.958 | ||||||||
| 2 spectra, IGTFVPR | 0.274 | 0.726 | ||||||||
| 3 spectra, TLANLDR | 0.008 | 0.992 | ||||||||
| 4 spectra, LYQLHK | 0.000 | 1.000 | ||||||||
| 1 spectrum, ETVSEK | 0.000 | 1.000 | ||||||||
| 2 spectra, DSPALK | 0.000 | 1.000 |
| Plot | Lyso | Other | |||||||||||
| Expt D |
1 peptide |
1 spectrum |
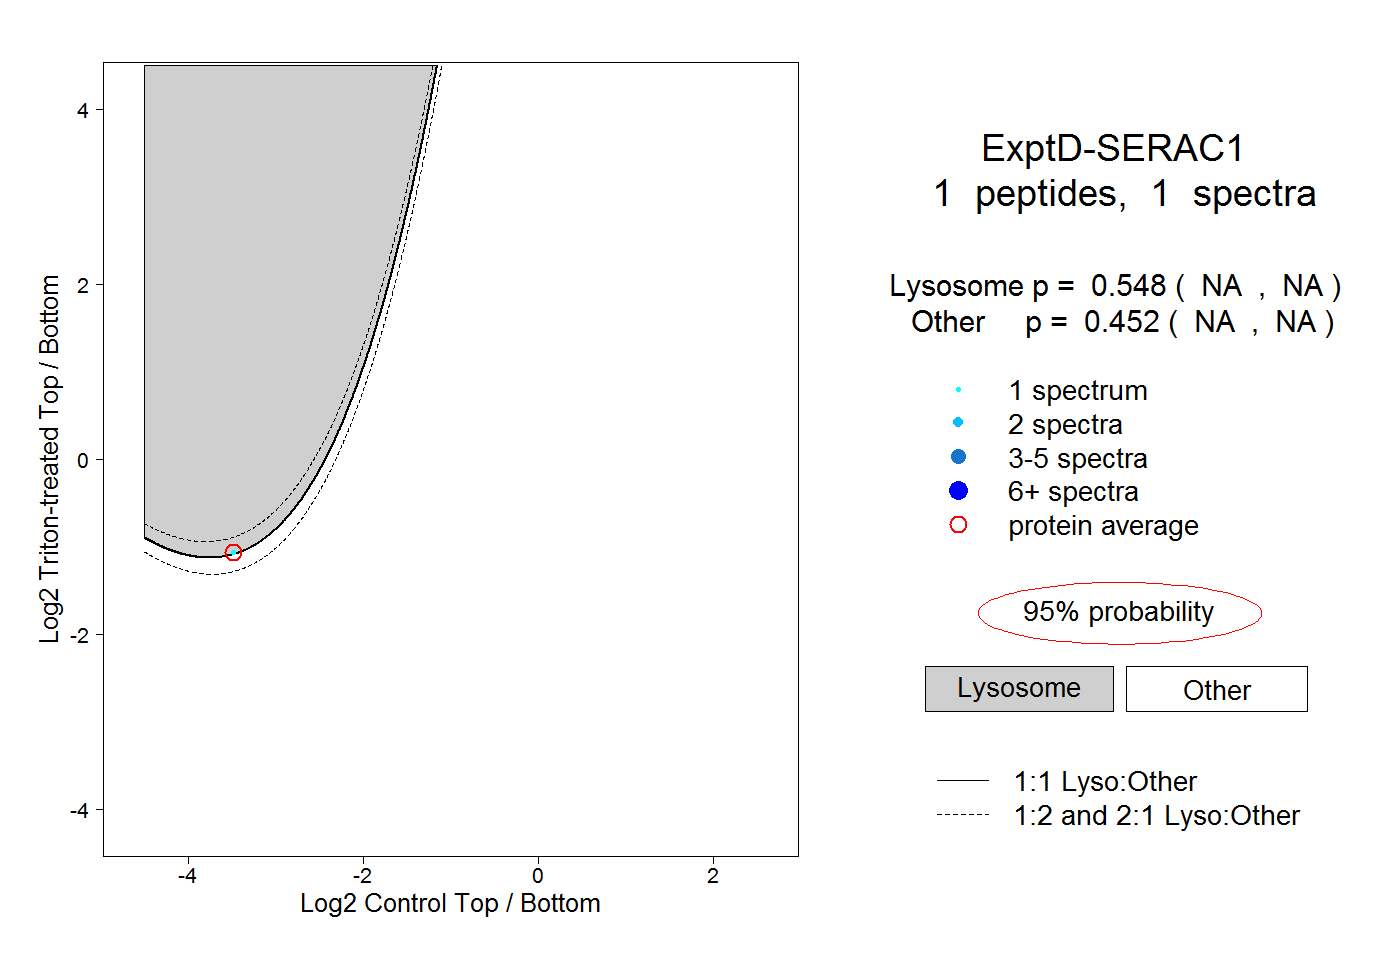 |
0.548 NA | NA |
0.452 NA | NA |