 12
12peptides
spectra
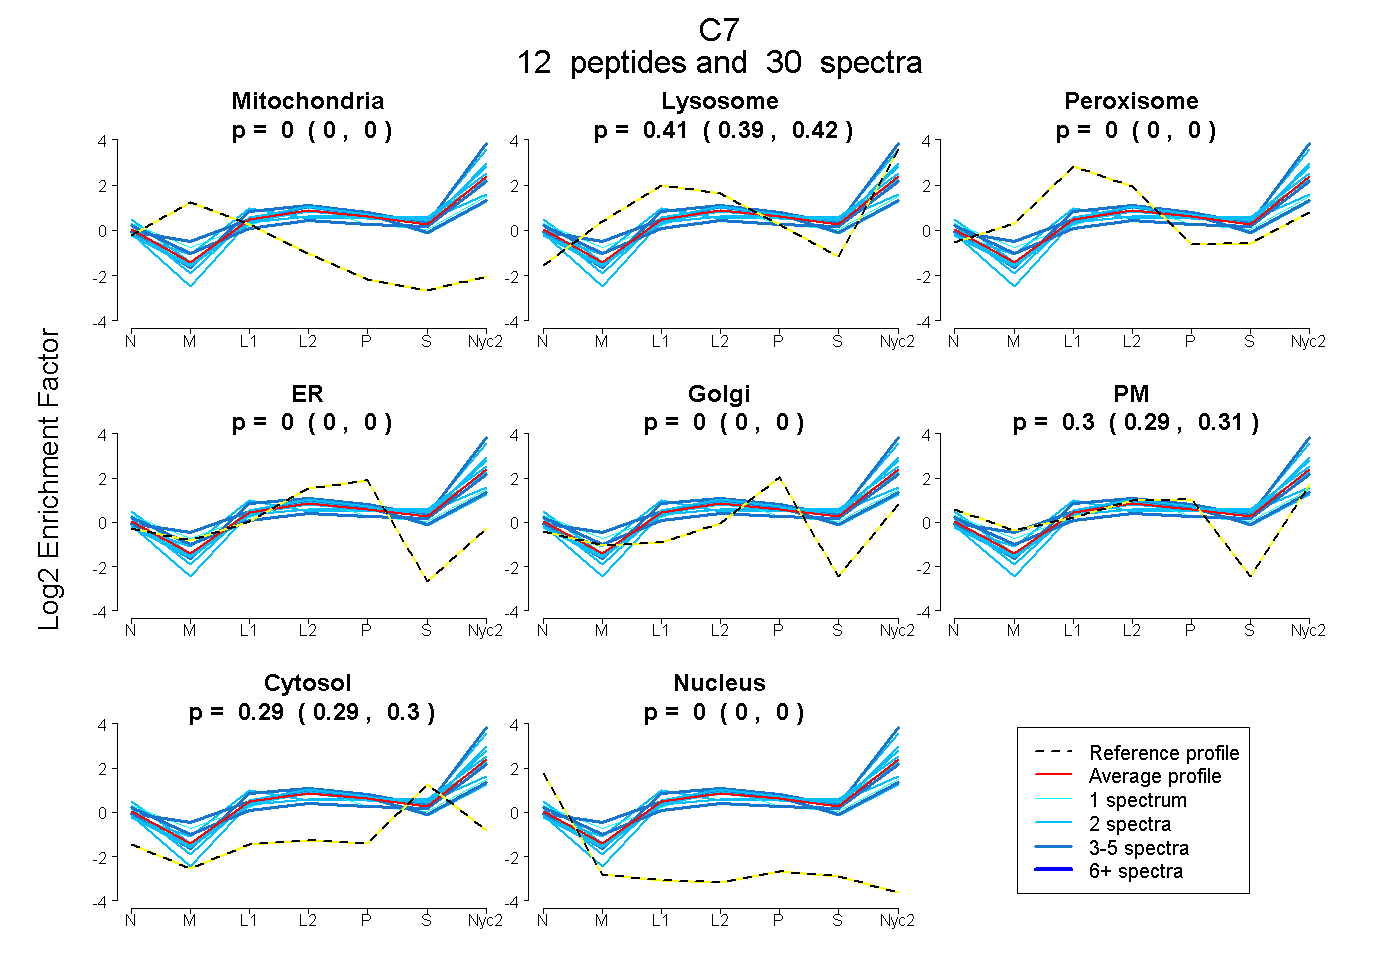
0.000 | 0.000
0.394 | 0.419
0.000 | 0.000
0.000 | 0.000
0.000 | 0.000
0.290 | 0.308
0.286 | 0.299
0.000 | 0.000
2peptides
spectra
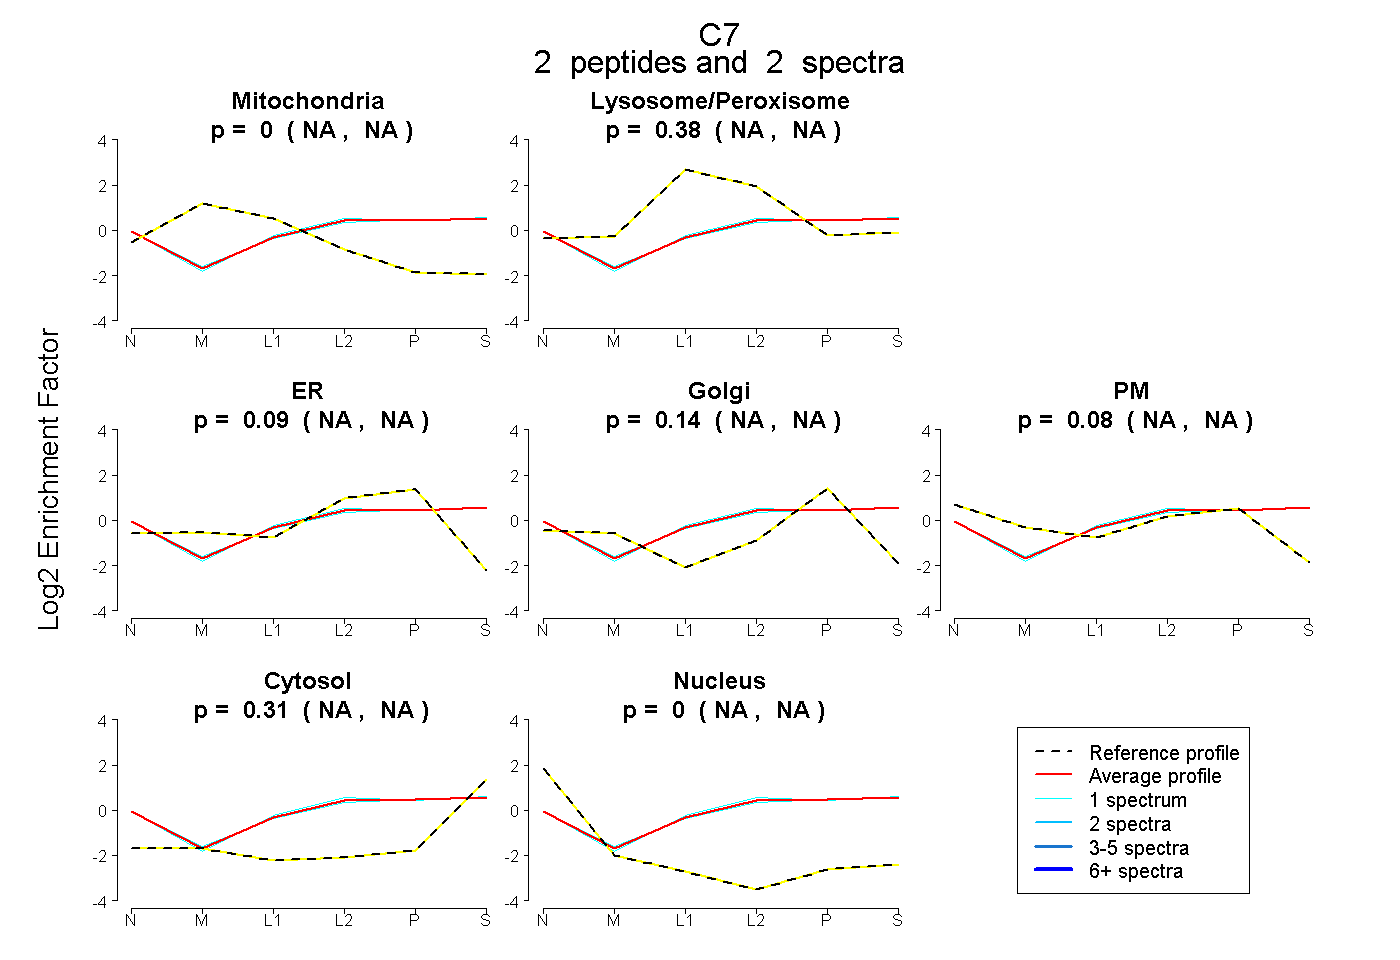
NA | NA
NA | NA
NA | NA
NA | NA
NA | NA
NA | NA
NA | NA
17peptides
spectra
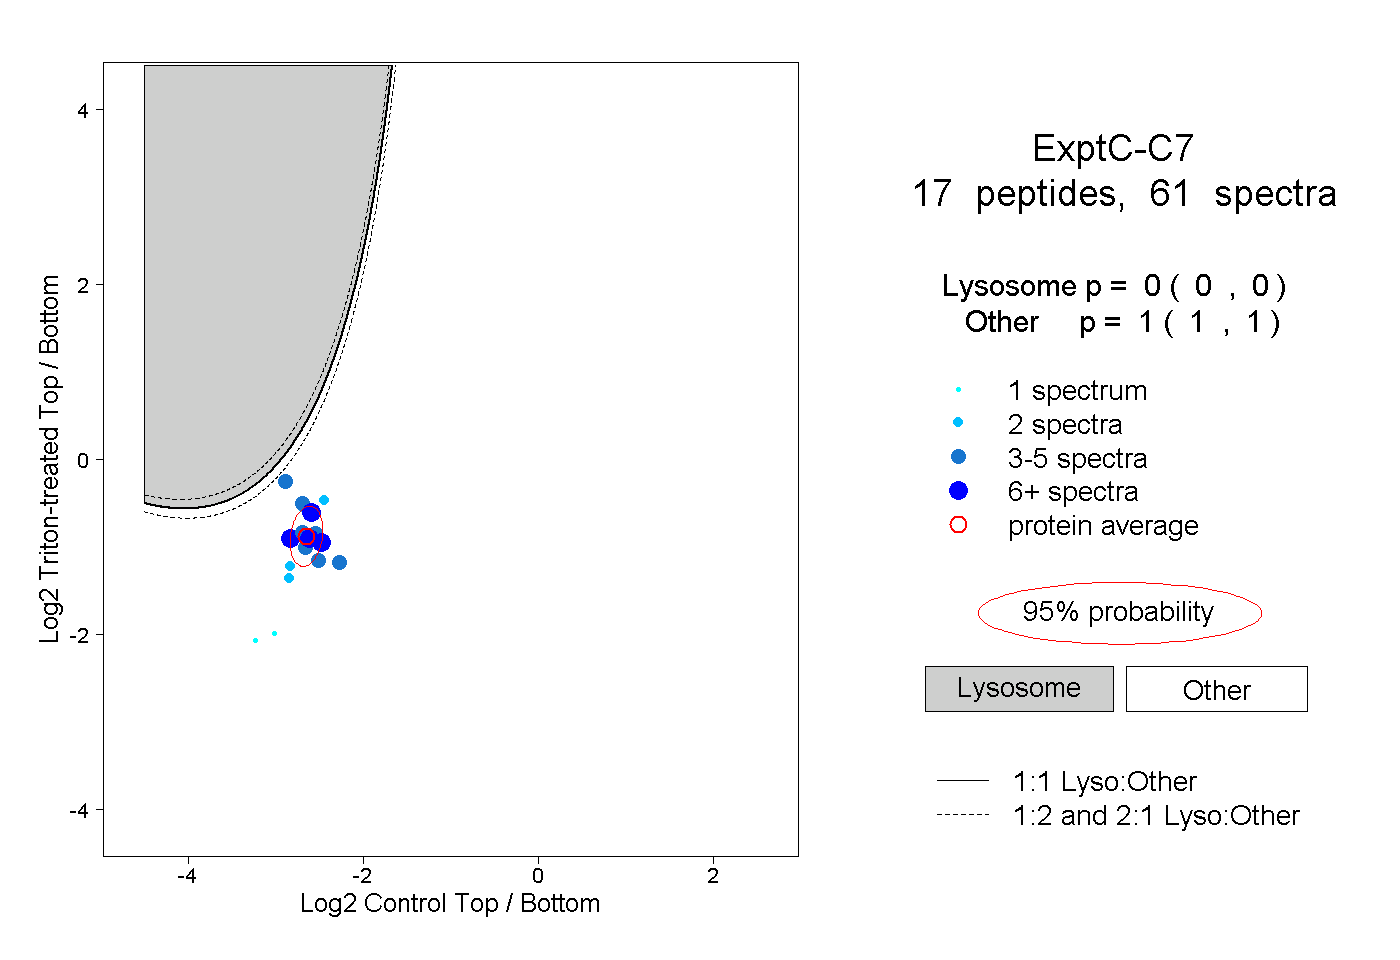
0.000 | 0.000
1.000 | 1.000
5peptides
spectra
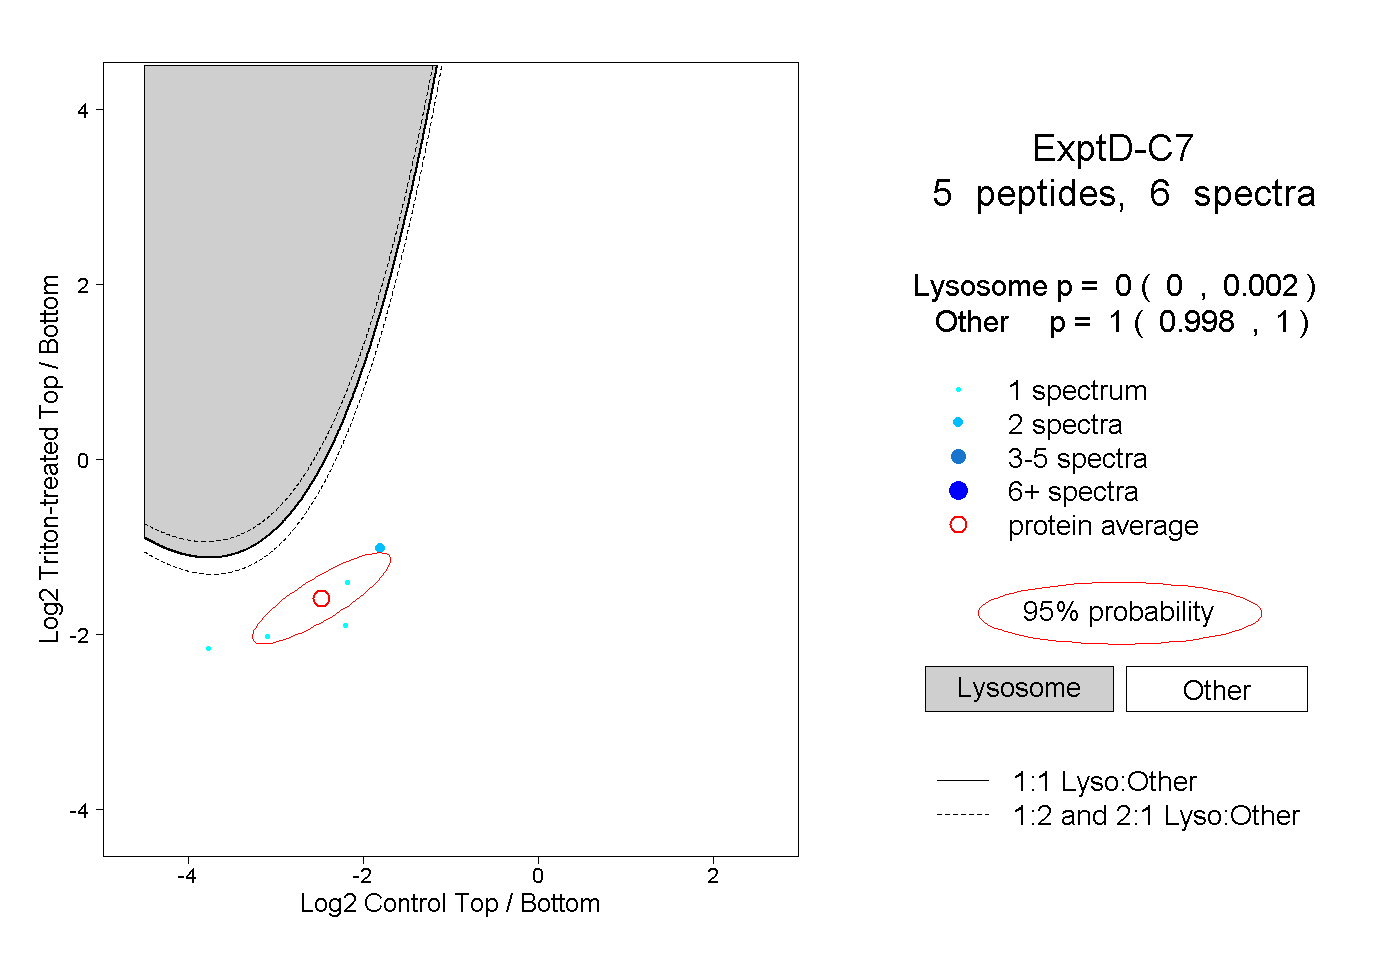
0.000 | 0.002
0.998 | 1.000