 12
12peptides
spectra
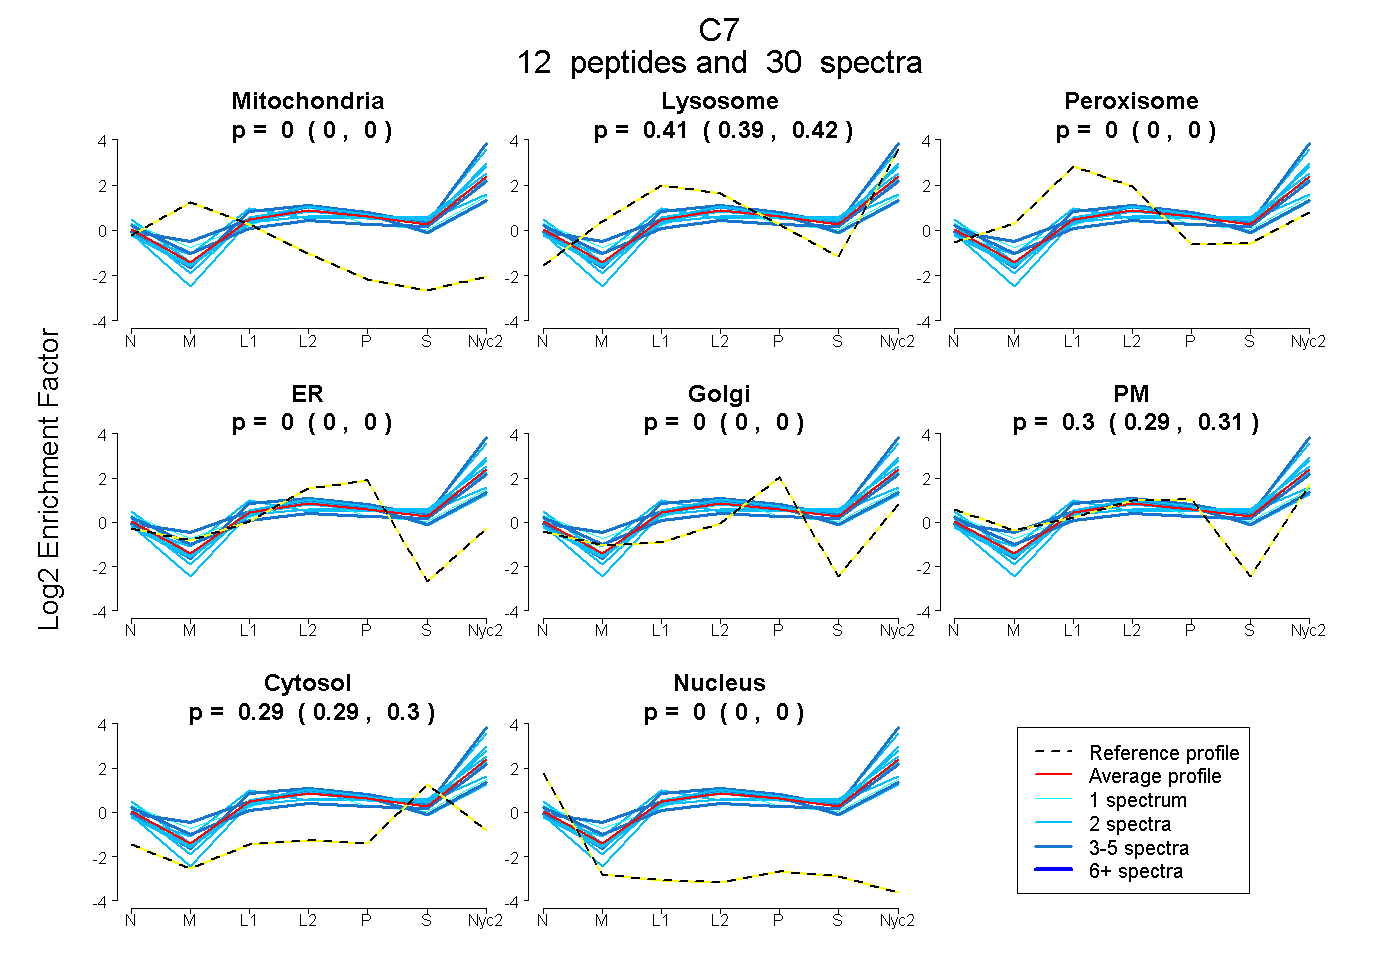
0.000 | 0.000
0.394 | 0.419
0.000 | 0.000
0.000 | 0.000
0.000 | 0.000
0.290 | 0.308
0.286 | 0.299
0.000 | 0.000
2peptides
spectra
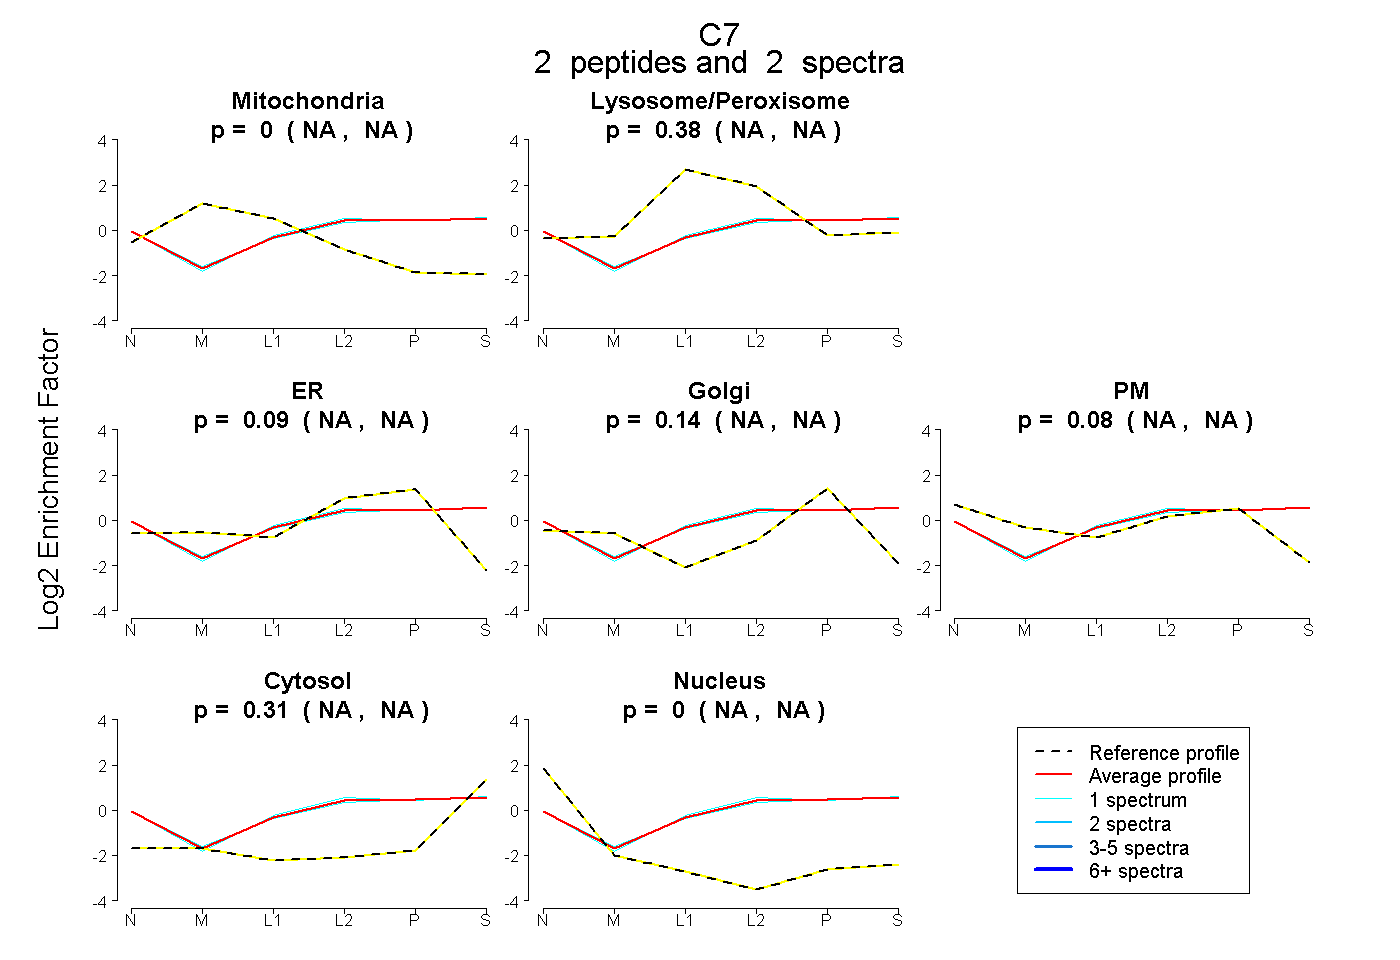
NA | NA
NA | NA
NA | NA
NA | NA
NA | NA
NA | NA
NA | NA
| Plot | Mito | Lyso | Perox | ER | Golgi | PM | Cytosol | Nucleus | |||||
| Expt A |
12 peptides |
30 spectra |
|
0.000 0.000 | 0.000 |
0.407 0.394 | 0.419 |
0.000 0.000 | 0.000 |
0.000 0.000 | 0.000 |
0.000 0.000 | 0.000 |
0.300 0.290 | 0.308 |
0.293 0.286 | 0.299 |
0.000 0.000 | 0.000 |
||
| Plot | Mito | Lyso or Perox | ER | Golgi | PM | Cytosol | Nucleus | ||||||
| Expt B |
2 peptides |
2 spectra |
|
0.000 NA | NA |
0.380 NA | NA |
0.091 NA | NA |
0.138 NA | NA |
0.080 NA | NA |
0.311 NA | NA |
0.000 NA | NA |
| 1 spectrum, LTPLYELVK | 0.000 | 0.391 | 0.003 | 0.233 | 0.084 | 0.288 | 0.000 | |||
| 1 spectrum, FIFVSSANQR | 0.000 | 0.370 | 0.178 | 0.042 | 0.076 | 0.334 | 0.000 |
| Plot | Lyso | Other | |||||||||||
| Expt C |
17 peptides |
61 spectra |
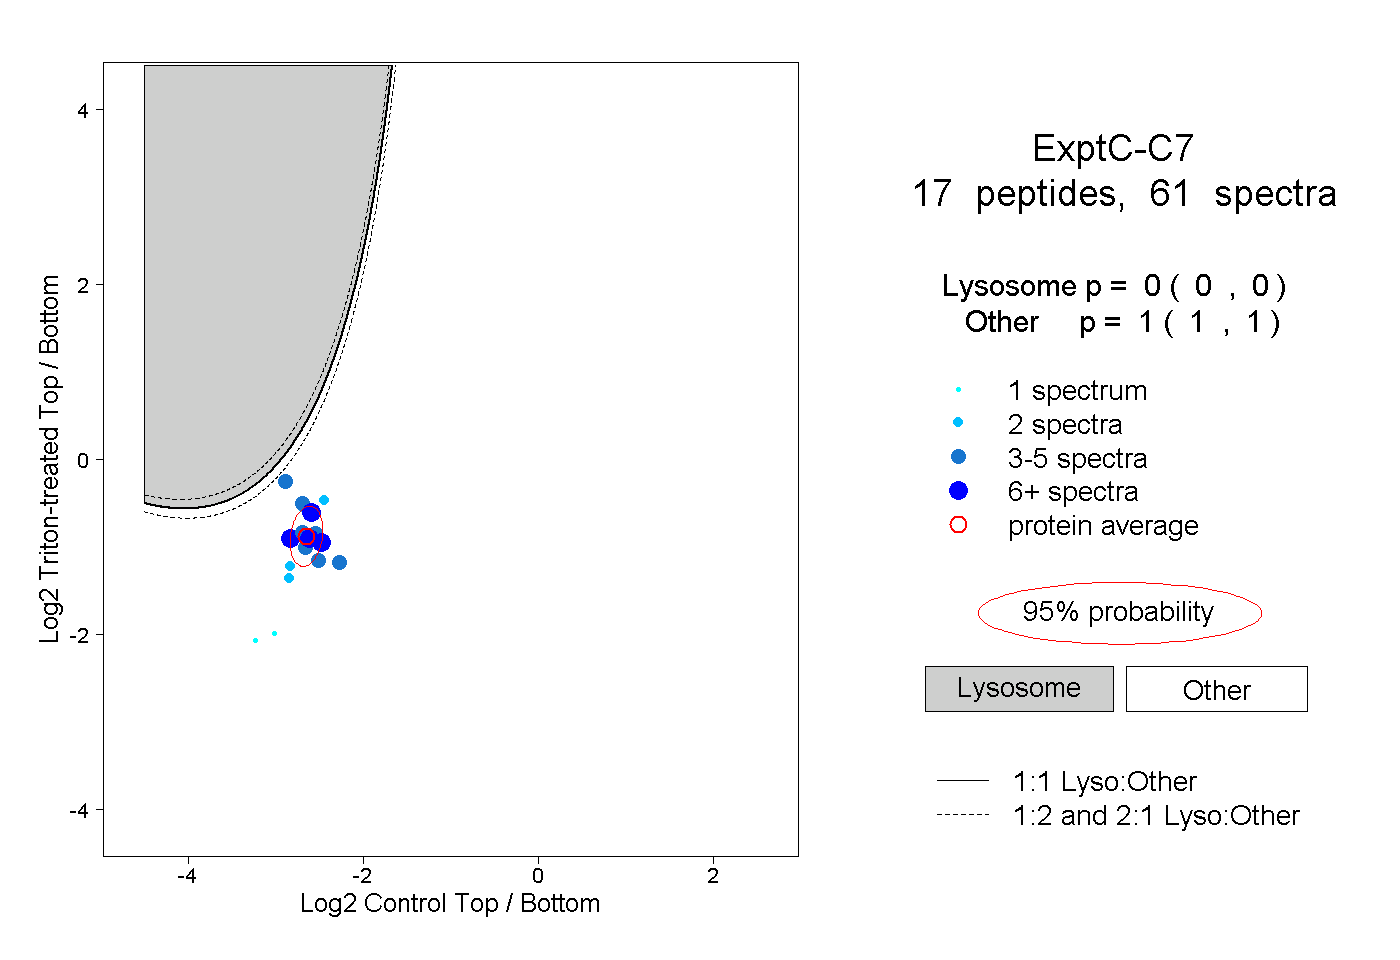 |
0.000 0.000 | 0.000 |
1.000 1.000 | 1.000 |
||||||||
| Plot | Lyso | Other | |||||||||||
| Expt D |
5 peptides |
6 spectra |
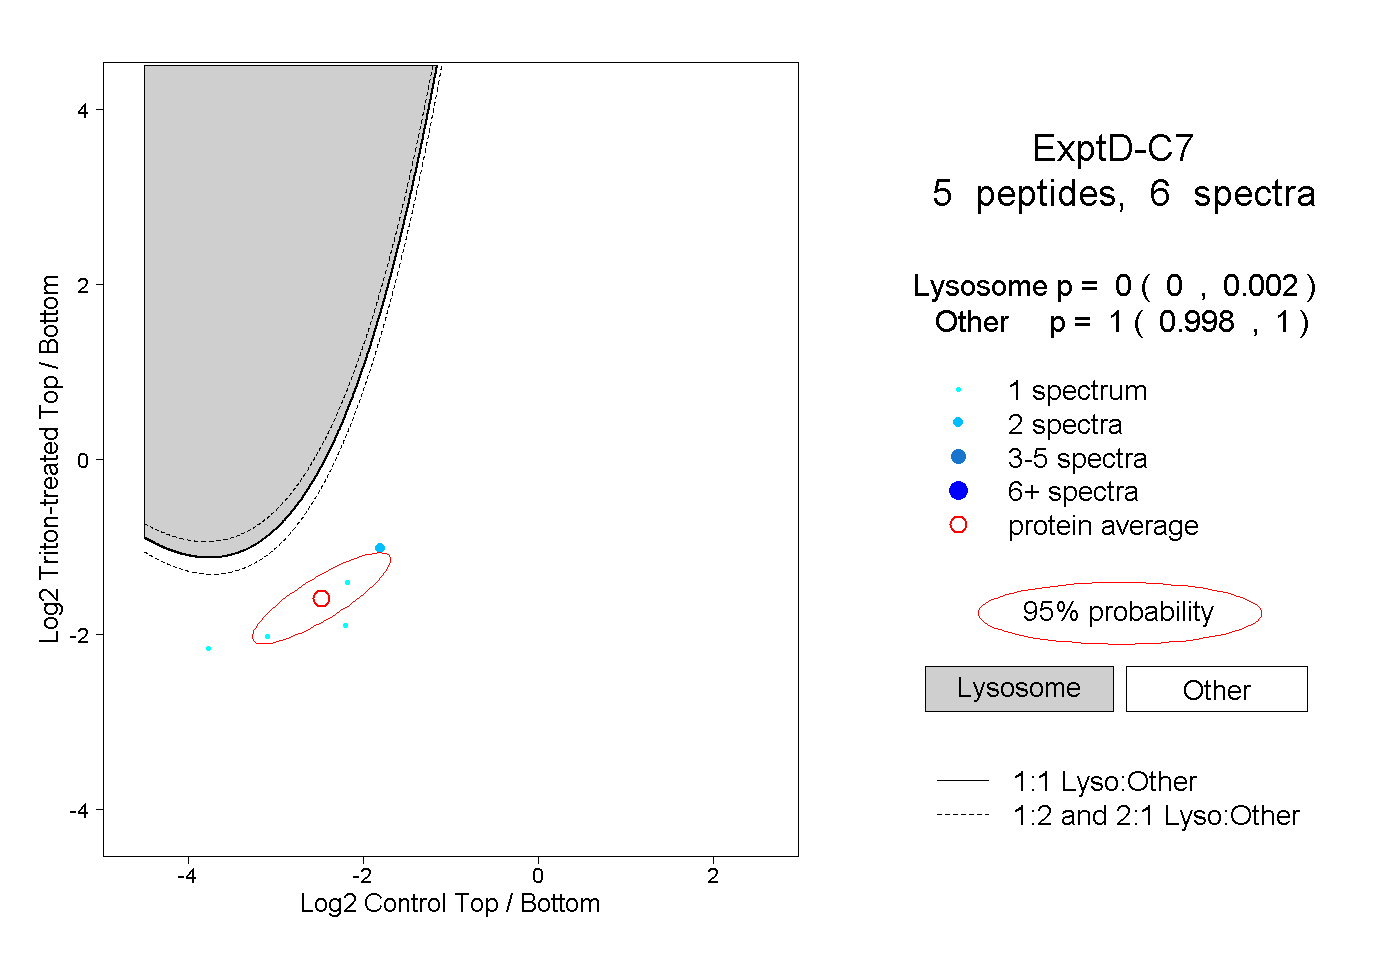 |
0.000 0.000 | 0.002 |
1.000 0.998 | 1.000 |