 12
12peptides
spectra
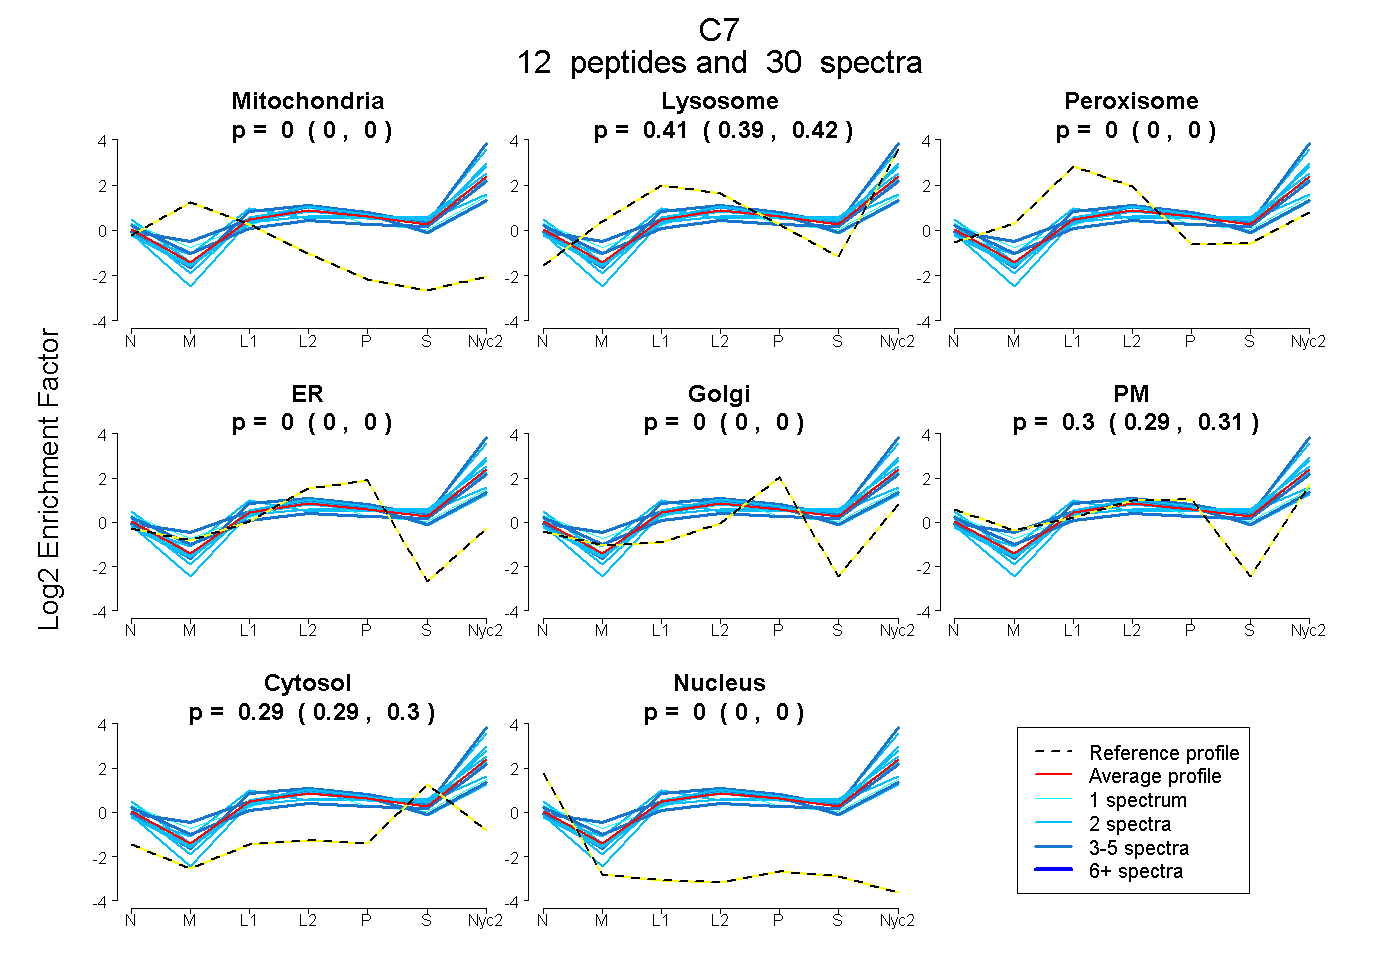
0.000 | 0.000
0.394 | 0.419
0.000 | 0.000
0.000 | 0.000
0.000 | 0.000
0.290 | 0.308
0.286 | 0.299
0.000 | 0.000
| Plot | Mito | Lyso | Perox | ER | Golgi | PM | Cytosol | Nucleus | |||||
| Expt A |
12 peptides |
30 spectra |
|
0.000 0.000 | 0.000 |
0.407 0.394 | 0.419 |
0.000 0.000 | 0.000 |
0.000 0.000 | 0.000 |
0.000 0.000 | 0.000 |
0.300 0.290 | 0.308 |
0.293 0.286 | 0.299 |
0.000 0.000 | 0.000 |
| 2 spectra, ACIGETTESR | 0.000 | 0.467 | 0.000 | 0.000 | 0.000 | 0.261 | 0.272 | 0.000 | ||
| 2 spectra, CVGSAFETQSCNPER | 0.000 | 0.025 | 0.154 | 0.000 | 0.000 | 0.552 | 0.270 | 0.000 | ||
| 2 spectra, GCPTEEGCGDR | 0.000 | 0.410 | 0.000 | 0.000 | 0.000 | 0.209 | 0.381 | 0.000 | ||
| 2 spectra, ILPLTICK | 0.000 | 0.294 | 0.062 | 0.000 | 0.000 | 0.286 | 0.358 | 0.000 | ||
| 2 spectra, ELENIFK | 0.000 | 0.669 | 0.000 | 0.000 | 0.000 | 0.102 | 0.229 | 0.000 | ||
| 5 spectra, SAQCVQK | 0.000 | 0.316 | 0.000 | 0.000 | 0.000 | 0.356 | 0.328 | 0.000 | ||
| 2 spectra, MPYECGSSLDVCAR | 0.000 | 0.411 | 0.000 | 0.000 | 0.000 | 0.231 | 0.358 | 0.000 | ||
| 4 spectra, MHVLQCQGR | 0.000 | 0.162 | 0.205 | 0.000 | 0.000 | 0.404 | 0.229 | 0.000 | ||
| 2 spectra, QCEDQDLENLR | 0.000 | 0.441 | 0.000 | 0.000 | 0.000 | 0.302 | 0.257 | 0.000 | ||
| 1 spectrum, ACGACPIWSK | 0.000 | 0.458 | 0.000 | 0.000 | 0.000 | 0.265 | 0.277 | 0.000 | ||
| 1 spectrum, EVPCASVK | 0.000 | 0.142 | 0.175 | 0.000 | 0.000 | 0.418 | 0.265 | 0.000 | ||
| 5 spectra, FIFVSSANQR | 0.000 | 0.649 | 0.000 | 0.000 | 0.000 | 0.158 | 0.192 | 0.000 |
| Plot | Mito | Lyso or Perox | ER | Golgi | PM | Cytosol | Nucleus | ||||||
| Expt B |
2 peptides |
2 spectra |
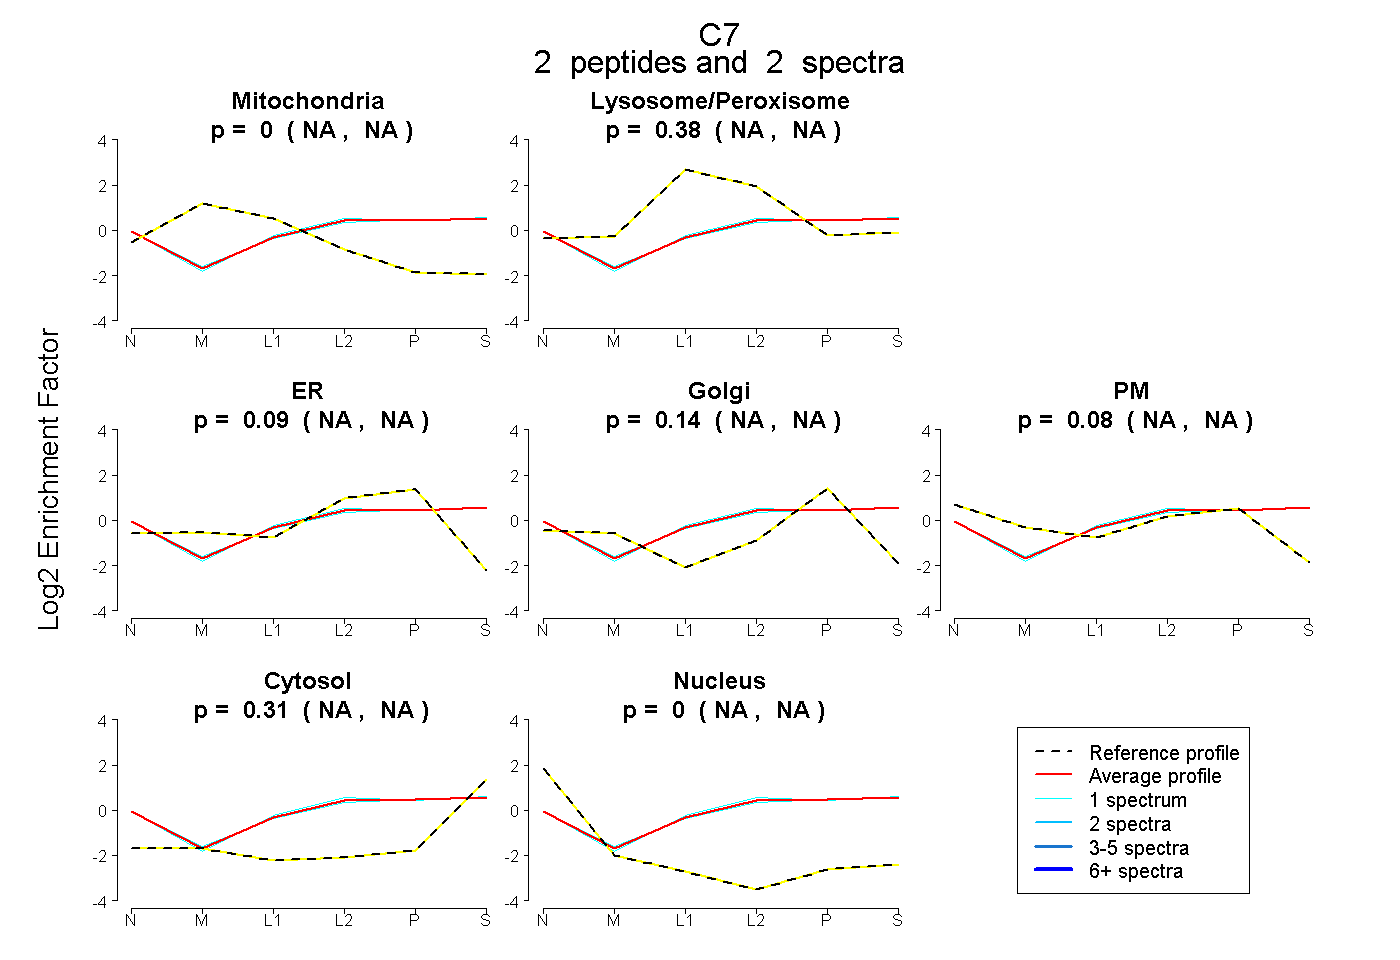 |
0.000 NA | NA |
0.380 NA | NA |
0.091 NA | NA |
0.138 NA | NA |
0.080 NA | NA |
0.311 NA | NA |
0.000 NA | NA |
|||
| Plot | Lyso | Other | |||||||||||
| Expt C |
17 peptides |
61 spectra |
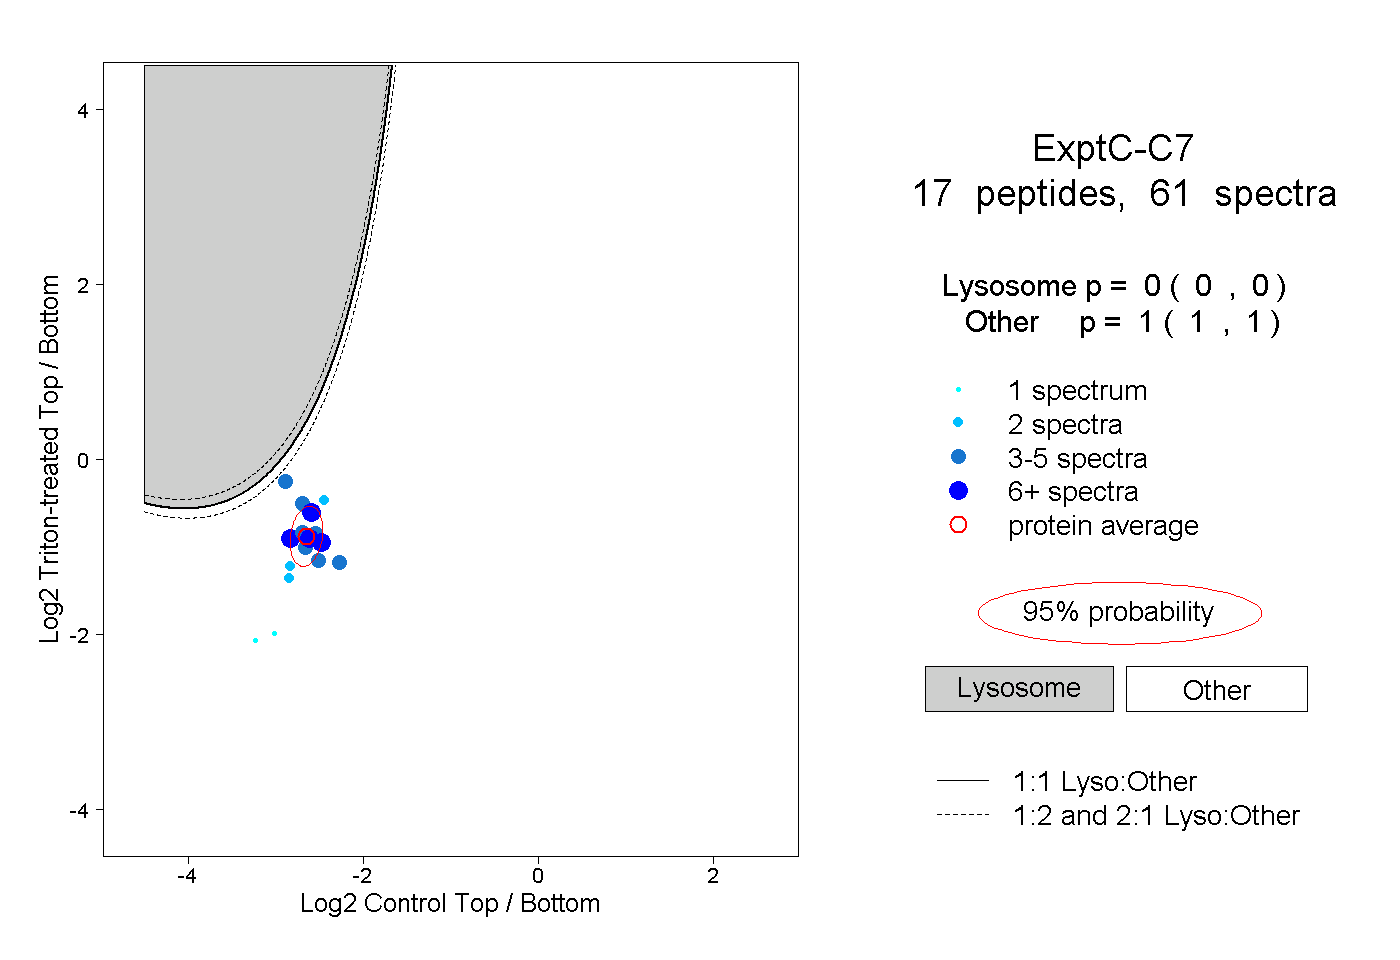 |
0.000 0.000 | 0.000 |
1.000 1.000 | 1.000 |
||||||||
| Plot | Lyso | Other | |||||||||||
| Expt D |
5 peptides |
6 spectra |
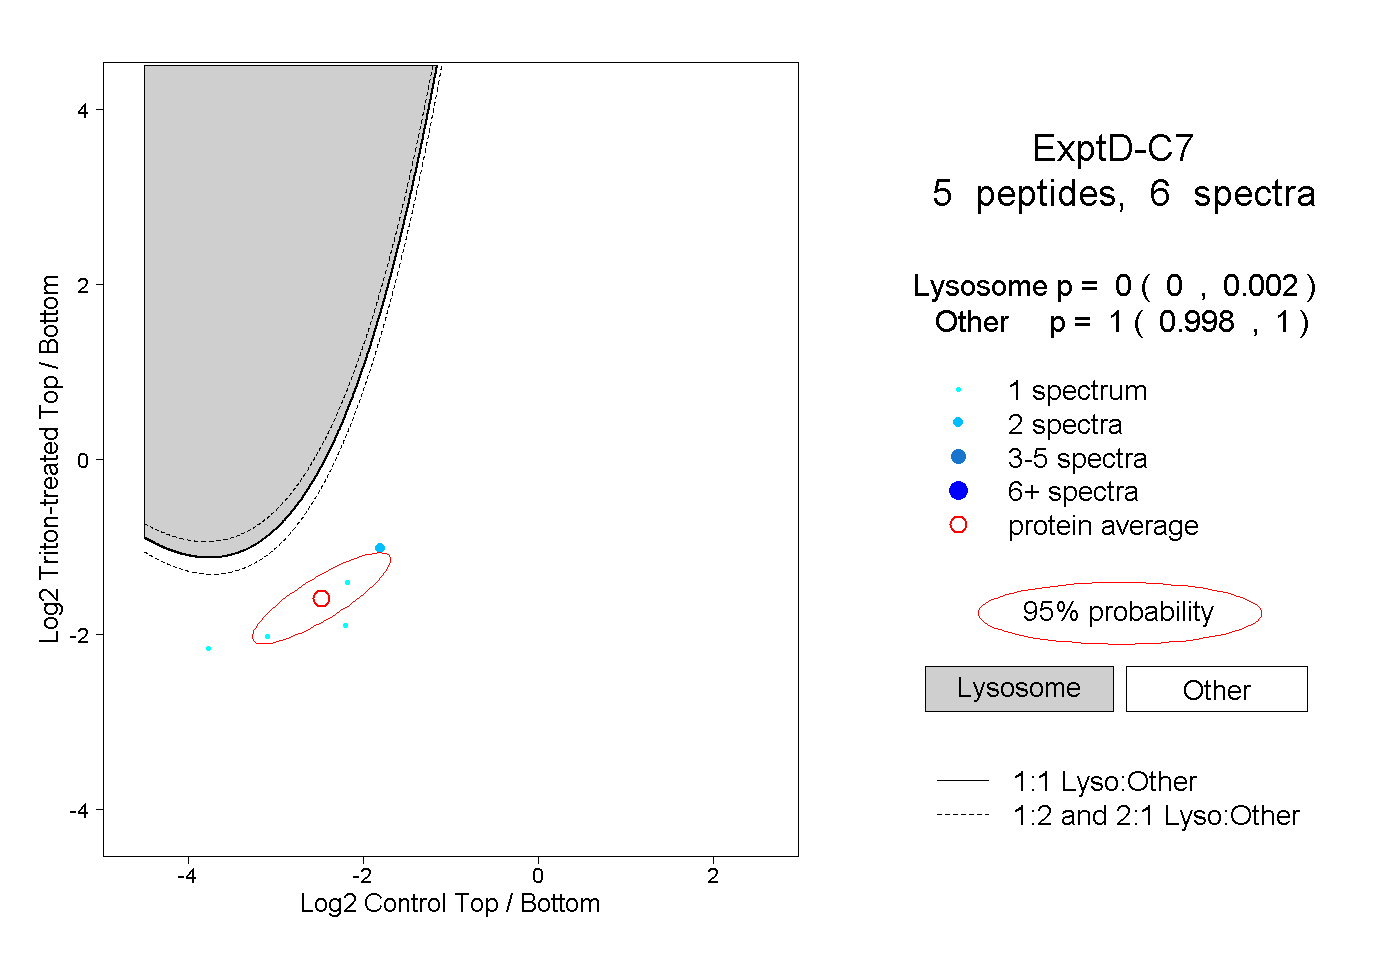 |
0.000 0.000 | 0.002 |
1.000 0.998 | 1.000 |