 30
30peptides
spectra
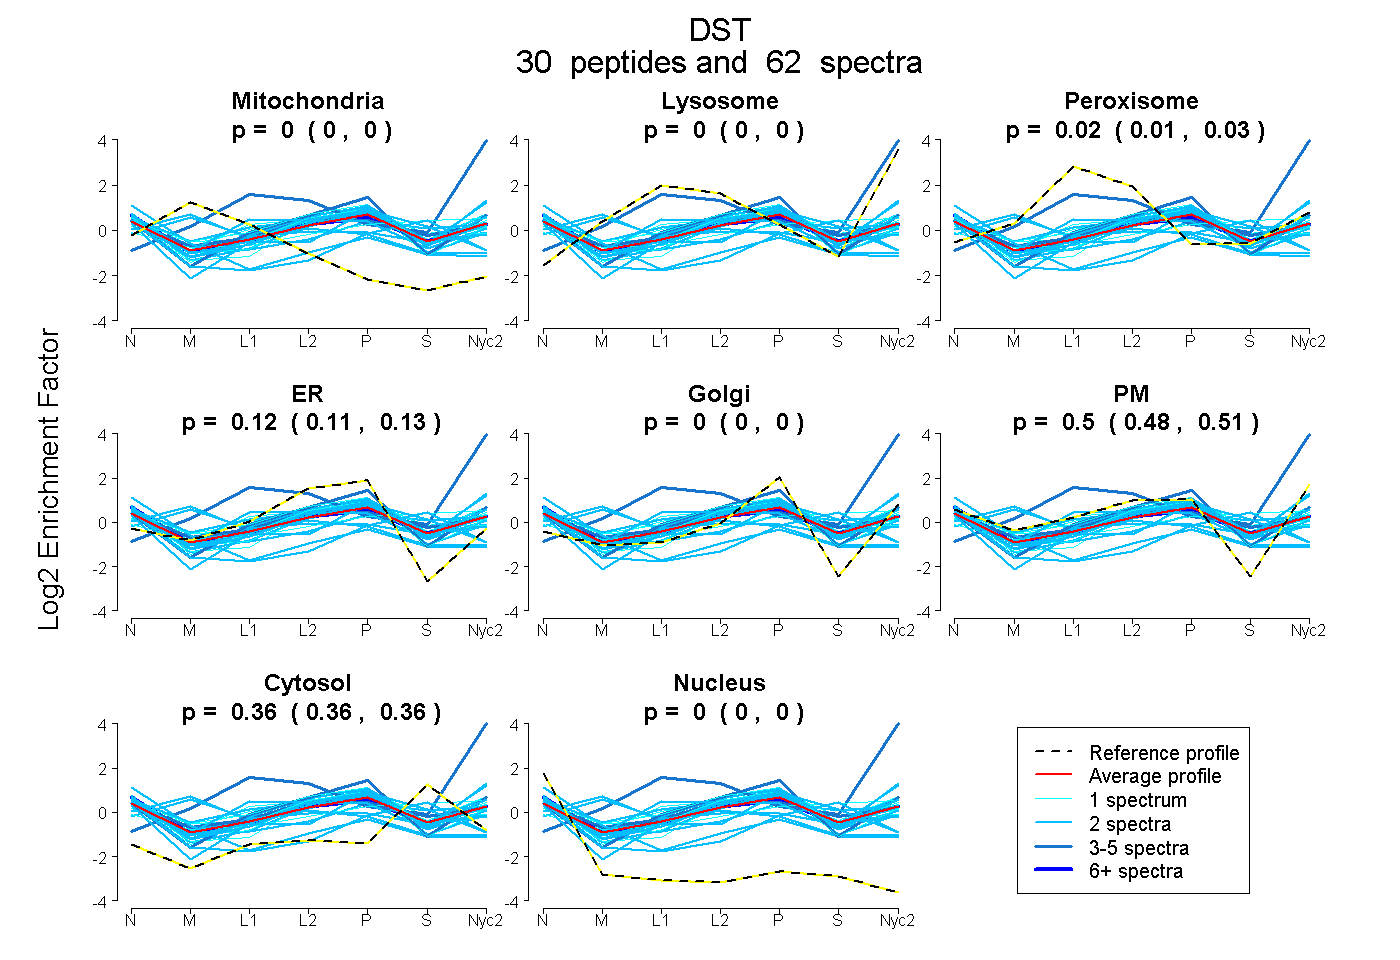
0.000 | 0.000
0.000 | 0.000
0.013 | 0.025
0.108 | 0.134
0.000 | 0.000
0.482 | 0.511
0.356 | 0.363
0.000 | 0.000
7peptides
spectra
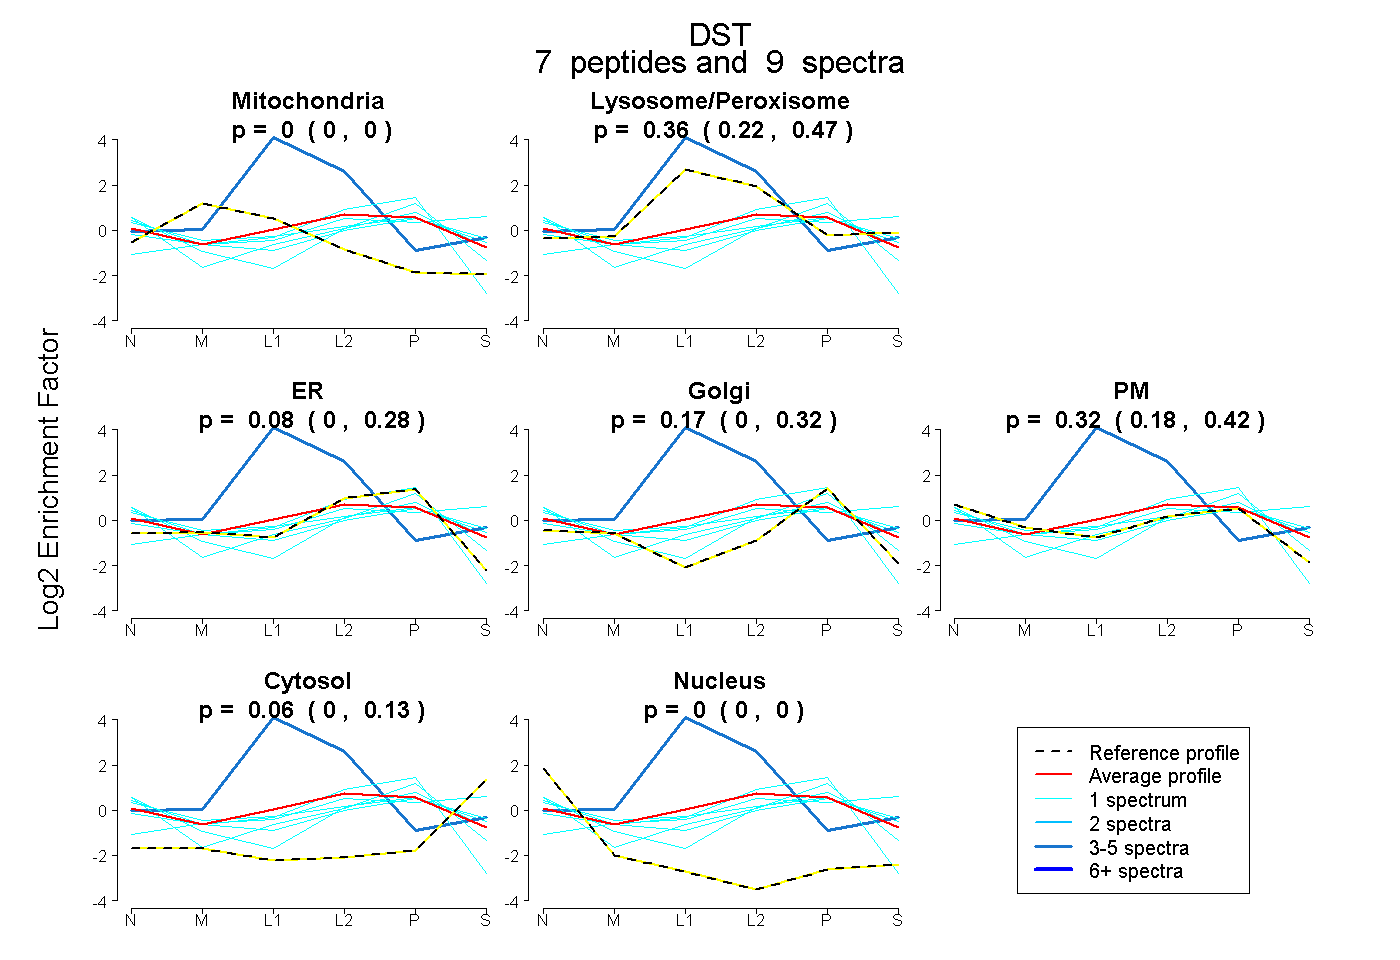
0.000 | 0.000
0.216 | 0.471
0.000 | 0.281
0.000 | 0.320
0.176 | 0.421
0.000 | 0.126
0.000 | 0.000
23peptides
spectra
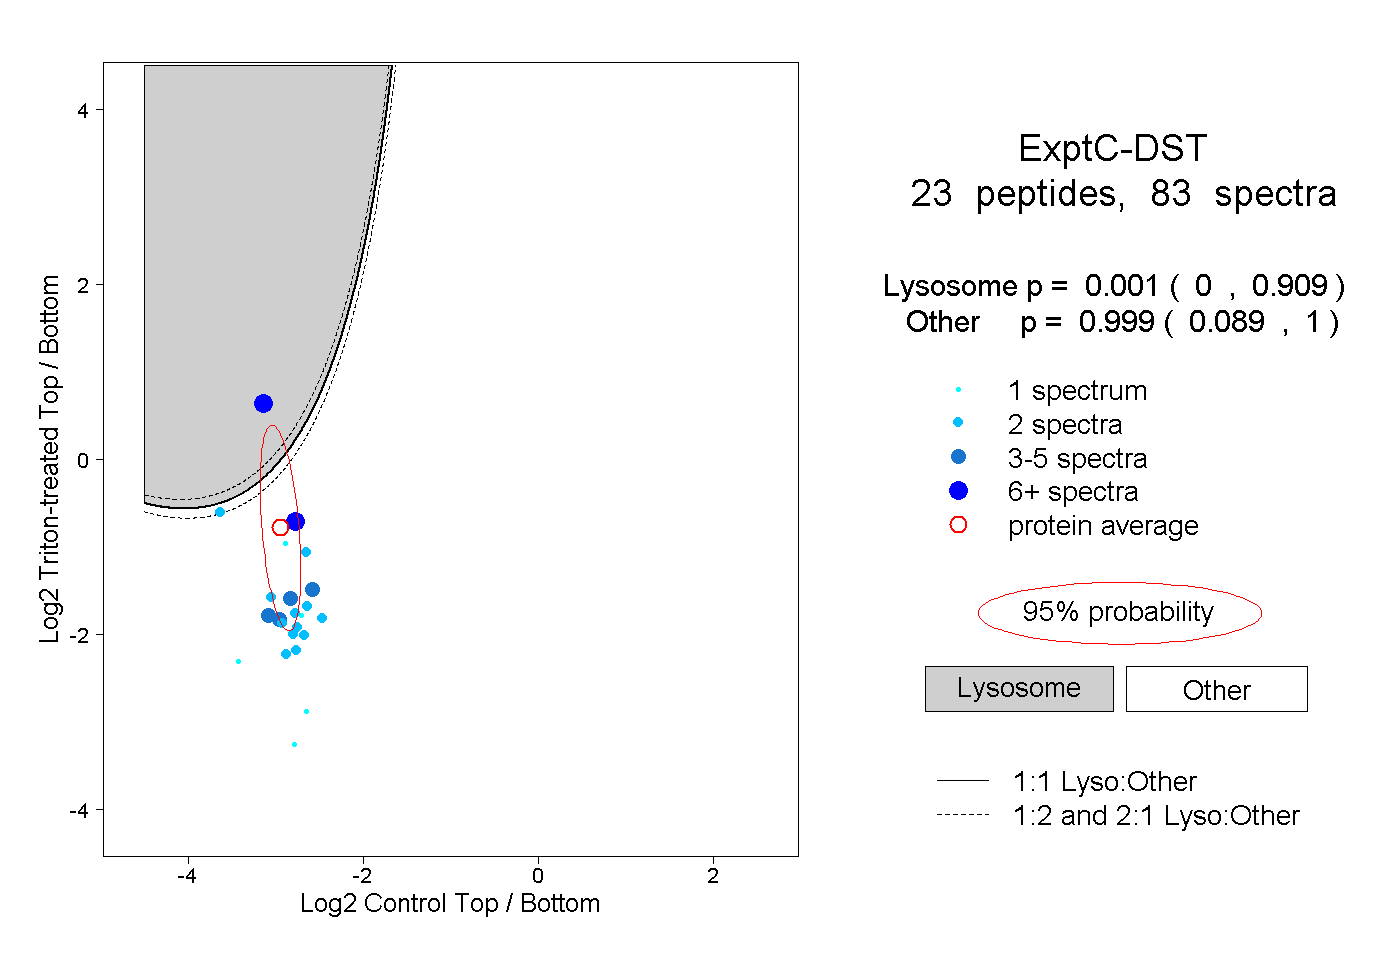
0.000 | 0.909
0.089 | 1.000
2peptides
spectra
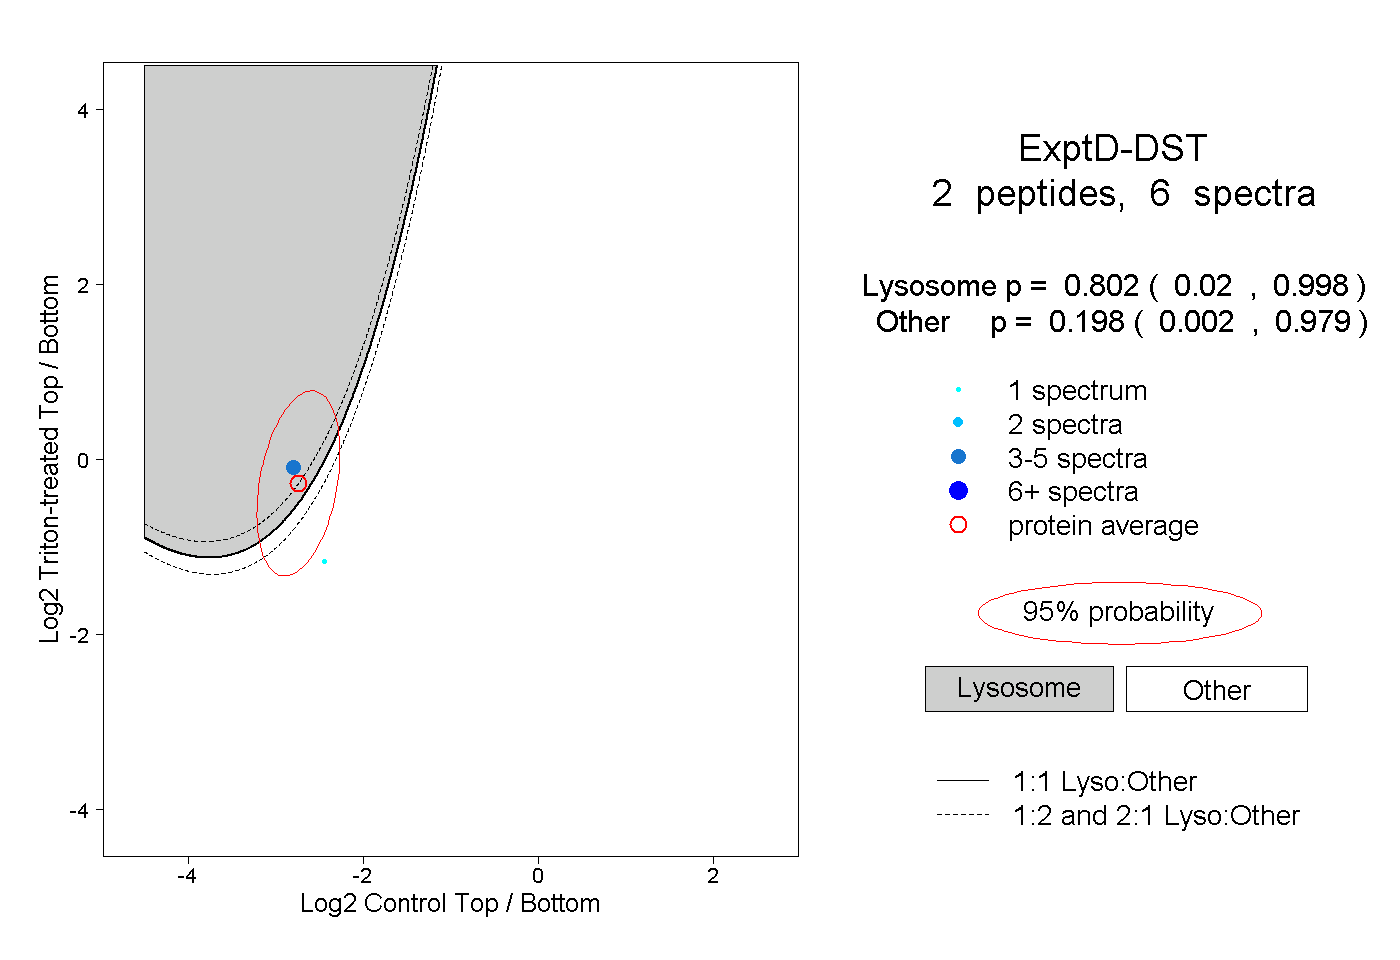
0.020 | 0.998
0.002 | 0.979