 30
30peptides
spectra
0.000 | 0.000
0.000 | 0.000
0.013 | 0.025
0.108 | 0.134
0.000 | 0.000
0.482 | 0.511
0.356 | 0.363
0.000 | 0.000
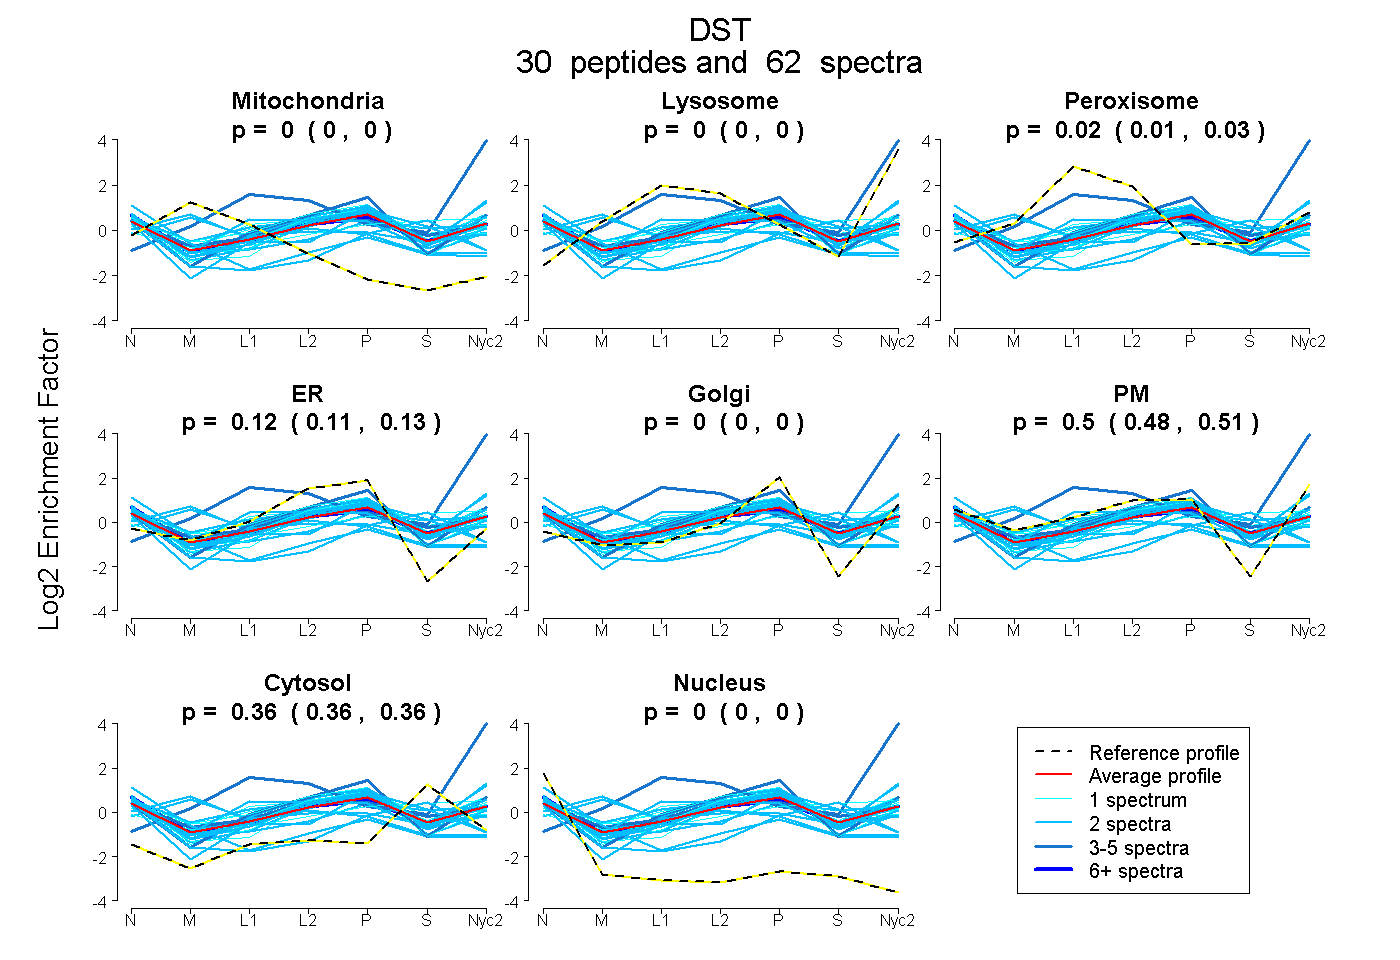
| Plot | Mito | Lyso | Perox | ER | Golgi | PM | Cytosol | Nucleus | |||||
| Expt A |
30 peptides |
62 spectra |
|
0.000 0.000 | 0.000 |
0.000 0.000 | 0.000 |
0.020 0.013 | 0.025 |
0.123 0.108 | 0.134 |
0.000 0.000 | 0.000 |
0.498 0.482 | 0.511 |
0.360 0.356 | 0.363 |
0.000 0.000 | 0.000 |
| 2 spectra, FILADGASQGMAAFRPR | 0.000 | 0.000 | 0.000 | 0.000 | 0.000 | 0.715 | 0.285 | 0.000 | ||
| 2 spectra, HWITIIQAR | 0.406 | 0.000 | 0.065 | 0.240 | 0.000 | 0.110 | 0.180 | 0.000 | ||
| 2 spectra, GEAASQVQER | 0.108 | 0.000 | 0.000 | 0.000 | 0.084 | 0.313 | 0.199 | 0.296 | ||
| 2 spectra, AIEIELAK | 0.000 | 0.000 | 0.000 | 0.248 | 0.111 | 0.321 | 0.240 | 0.079 | ||
| 2 spectra, VEEIDAAILR | 0.000 | 0.000 | 0.000 | 0.168 | 0.000 | 0.504 | 0.311 | 0.017 | ||
| 2 spectra, SVETNIDQDITNLK | 0.000 | 0.000 | 0.000 | 0.354 | 0.091 | 0.000 | 0.511 | 0.044 | ||
| 2 spectra, GFHGEIEDLQQWLTDTER | 0.000 | 0.000 | 0.226 | 0.111 | 0.000 | 0.392 | 0.194 | 0.077 | ||
| 5 spectra, FLEHR | 0.000 | 0.936 | 0.000 | 0.000 | 0.000 | 0.000 | 0.064 | 0.000 | ||
| 1 spectrum, AAECPDFPVSSAEGTPIQGSK | 0.000 | 0.000 | 0.256 | 0.085 | 0.236 | 0.177 | 0.247 | 0.000 | ||
| 2 spectra, EVFHALEDELQK | 0.000 | 0.000 | 0.000 | 0.000 | 0.029 | 0.477 | 0.492 | 0.002 | ||
| 2 spectra, NLLISVQSR | 0.000 | 0.011 | 0.113 | 0.000 | 0.000 | 0.672 | 0.204 | 0.000 | ||
| 1 spectrum, EVIPQEIEEVK | 0.000 | 0.000 | 0.005 | 0.312 | 0.000 | 0.285 | 0.398 | 0.000 | ||
| 1 spectrum, TVAEDNER | 0.000 | 0.000 | 0.000 | 0.162 | 0.000 | 0.513 | 0.325 | 0.000 | ||
| 4 spectra, ILHPLTR | 0.000 | 0.000 | 0.000 | 0.253 | 0.095 | 0.437 | 0.215 | 0.000 | ||
| 2 spectra, ALQEDILLR | 0.000 | 0.000 | 0.028 | 0.171 | 0.000 | 0.478 | 0.320 | 0.003 | ||
| 2 spectra, LLEDR | 0.000 | 0.000 | 0.000 | 0.000 | 0.174 | 0.099 | 0.567 | 0.160 | ||
| 1 spectrum, ELIAEHKPHIDK | 0.000 | 0.000 | 0.000 | 0.149 | 0.075 | 0.368 | 0.408 | 0.000 | ||
| 1 spectrum, FEEVLAWAK | 0.000 | 0.000 | 0.000 | 0.334 | 0.000 | 0.319 | 0.311 | 0.036 | ||
| 1 spectrum, DTQDFIR | 0.000 | 0.000 | 0.136 | 0.011 | 0.000 | 0.566 | 0.287 | 0.000 | ||
| 4 spectra, FHGALPDDEDALR | 0.000 | 0.000 | 0.114 | 0.090 | 0.000 | 0.437 | 0.359 | 0.000 | ||
| 2 spectra, GFHSGEDNALITTAASR | 0.249 | 0.127 | 0.049 | 0.000 | 0.037 | 0.290 | 0.248 | 0.000 | ||
| 2 spectra, ELIEGSR | 0.008 | 0.000 | 0.009 | 0.266 | 0.000 | 0.372 | 0.341 | 0.003 | ||
| 1 spectrum, LENMLSELR | 0.000 | 0.000 | 0.064 | 0.344 | 0.000 | 0.388 | 0.198 | 0.005 | ||
| 1 spectrum, LDVLESLLK | 0.000 | 0.043 | 0.034 | 0.000 | 0.000 | 0.419 | 0.505 | 0.000 | ||
| 2 spectra, IAASAEPADR | 0.000 | 0.000 | 0.004 | 0.174 | 0.000 | 0.487 | 0.329 | 0.006 | ||
| 1 spectrum, EEIEPLQAK | 0.000 | 0.000 | 0.113 | 0.125 | 0.218 | 0.243 | 0.300 | 0.000 | ||
| 6 spectra, EQIIELDK | 0.000 | 0.000 | 0.021 | 0.072 | 0.000 | 0.542 | 0.340 | 0.024 | ||
| 2 spectra, LMEWLEDSEK | 0.000 | 0.000 | 0.000 | 0.342 | 0.038 | 0.263 | 0.350 | 0.007 | ||
| 2 spectra, WQDILEK | 0.000 | 0.000 | 0.000 | 0.029 | 0.089 | 0.566 | 0.316 | 0.000 | ||
| 2 spectra, DLEDPGIDPSVVK | 0.000 | 0.000 | 0.025 | 0.000 | 0.000 | 0.642 | 0.333 | 0.000 |
| Plot | Mito | Lyso or Perox | ER | Golgi | PM | Cytosol | Nucleus | ||||||
| Expt B |
7 peptides |
9 spectra |
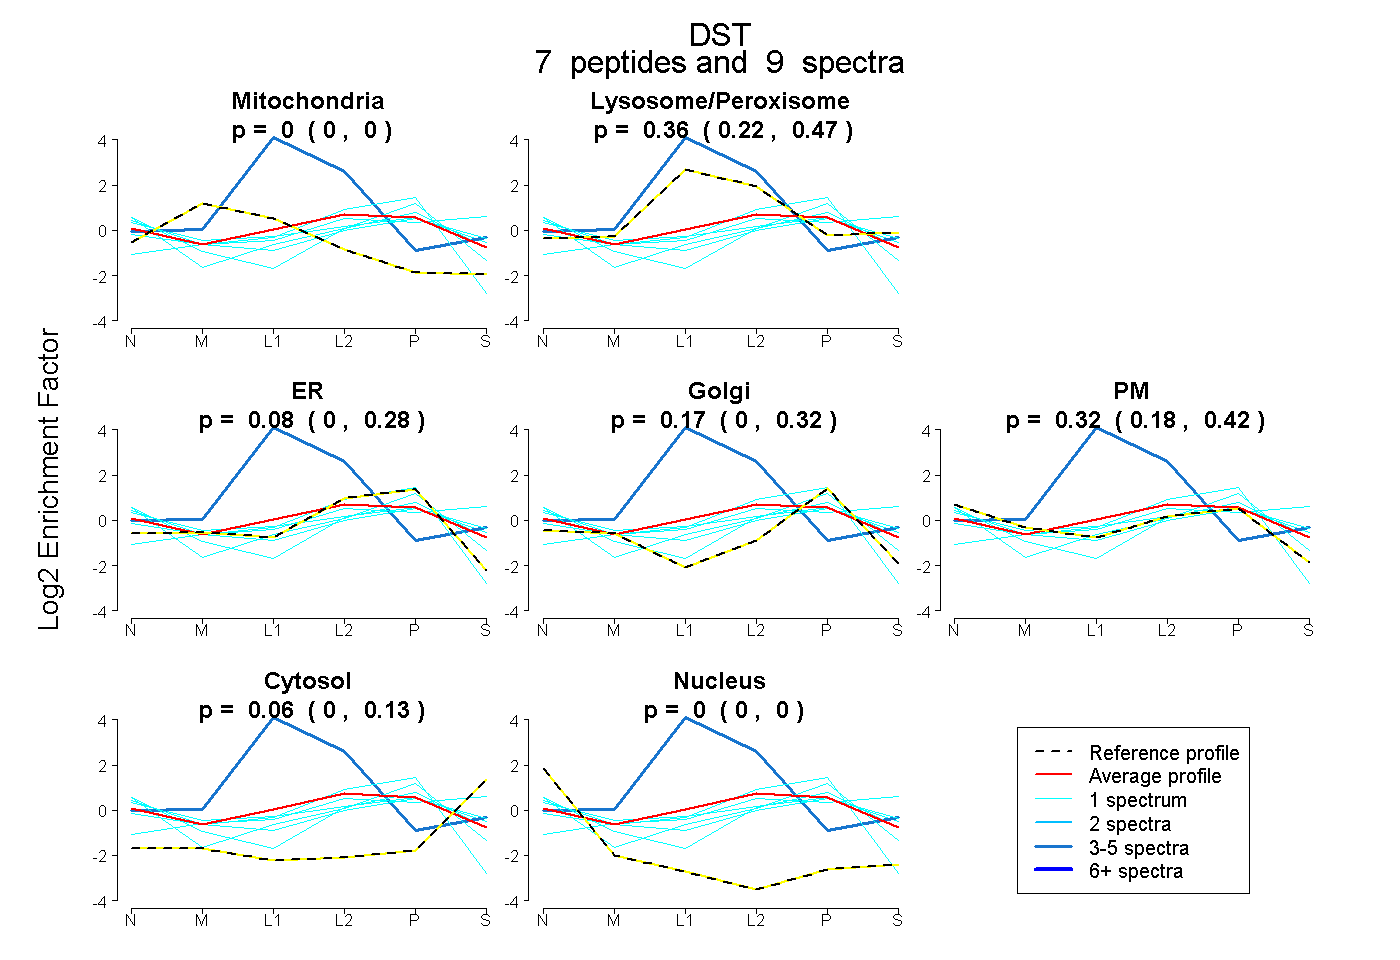 |
0.000 0.000 | 0.000 |
0.365 0.216 | 0.471 |
0.083 0.000 | 0.281 |
0.172 0.000 | 0.320 |
0.316 0.176 | 0.421 |
0.064 0.000 | 0.126 |
0.000 0.000 | 0.000 |
|||
| Plot | Lyso | Other | |||||||||||
| Expt C |
23 peptides |
83 spectra |
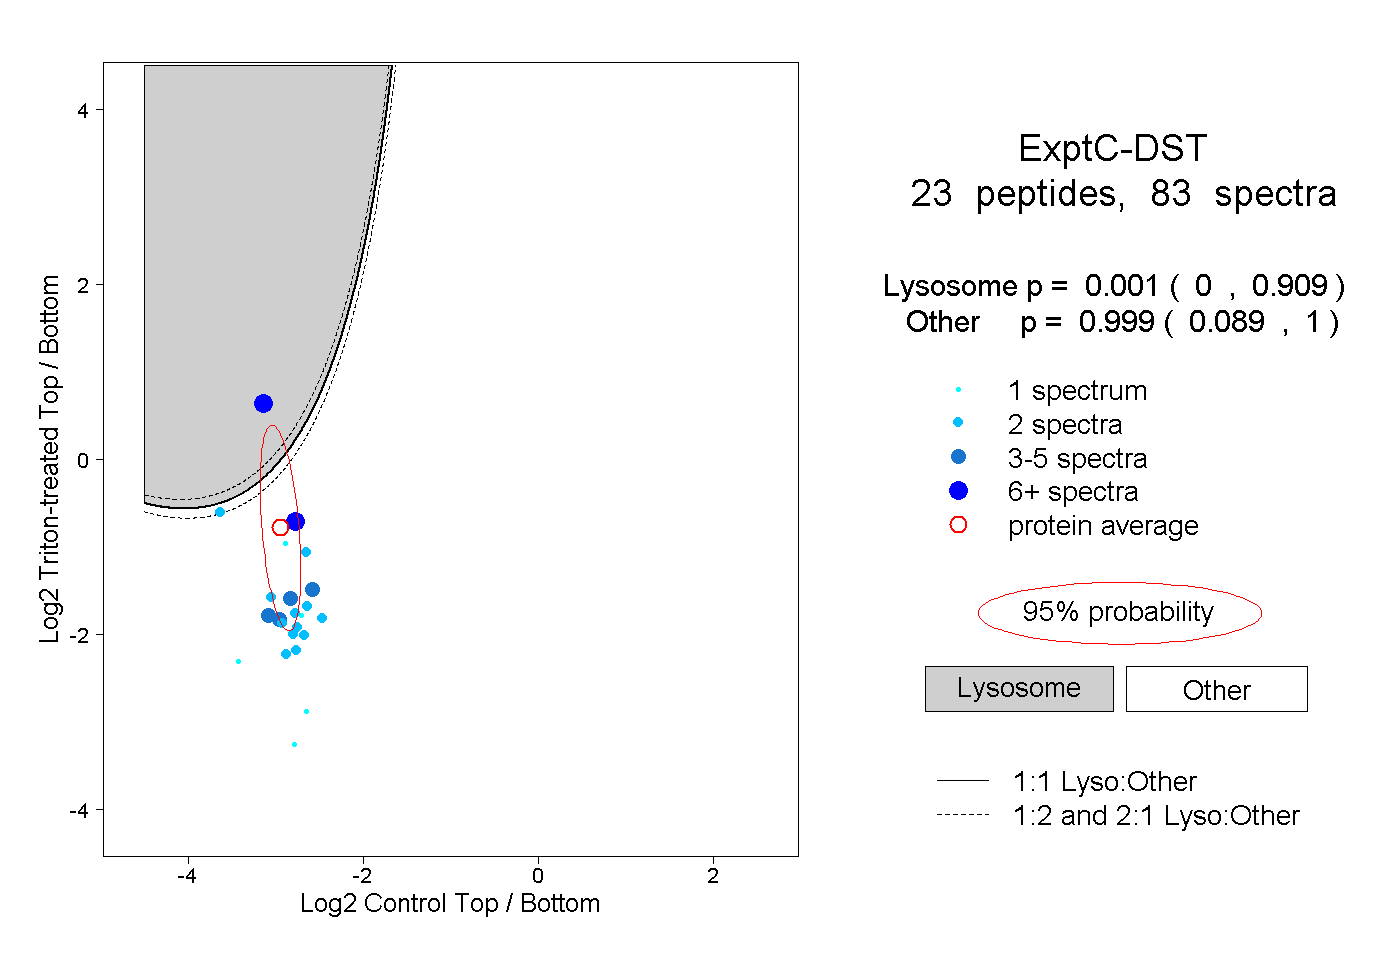 |
0.001 0.000 | 0.909 |
0.999 0.089 | 1.000 |
||||||||
| Plot | Lyso | Other | |||||||||||
| Expt D |
2 peptides |
6 spectra |
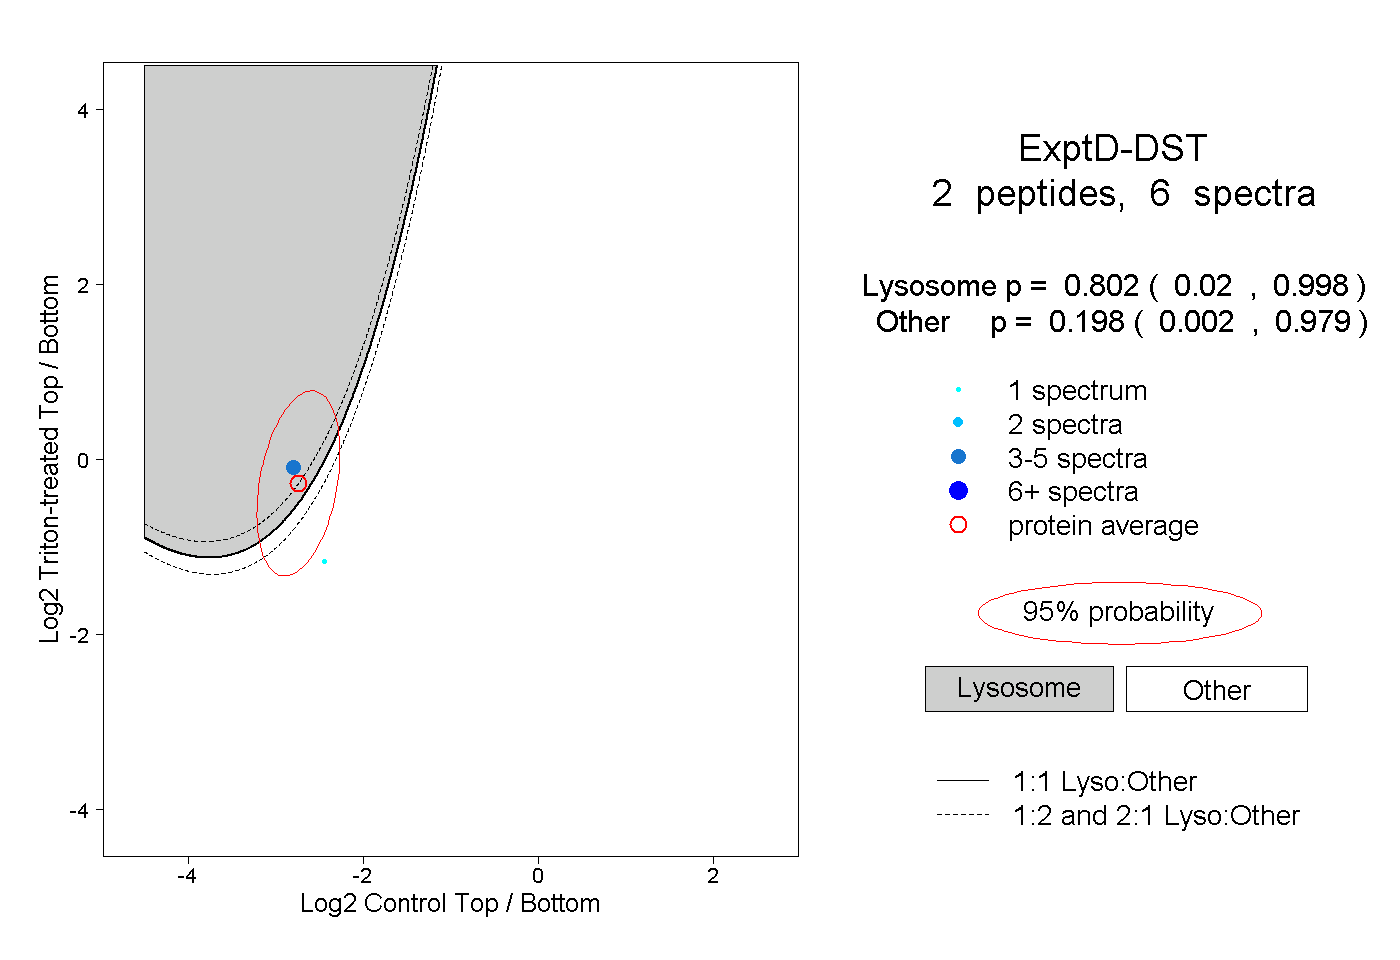 |
0.802 0.020 | 0.998 |
0.198 0.002 | 0.979 |