DST
[ENSRNOP00000056756]
Main page
| | | Plot |
Mito |
Lyso |
|
Perox |
ER |
Golgi |
PM |
Cytosol |
Nucleus |
|
| Expt A |
 30
30
peptides |
62
spectra |
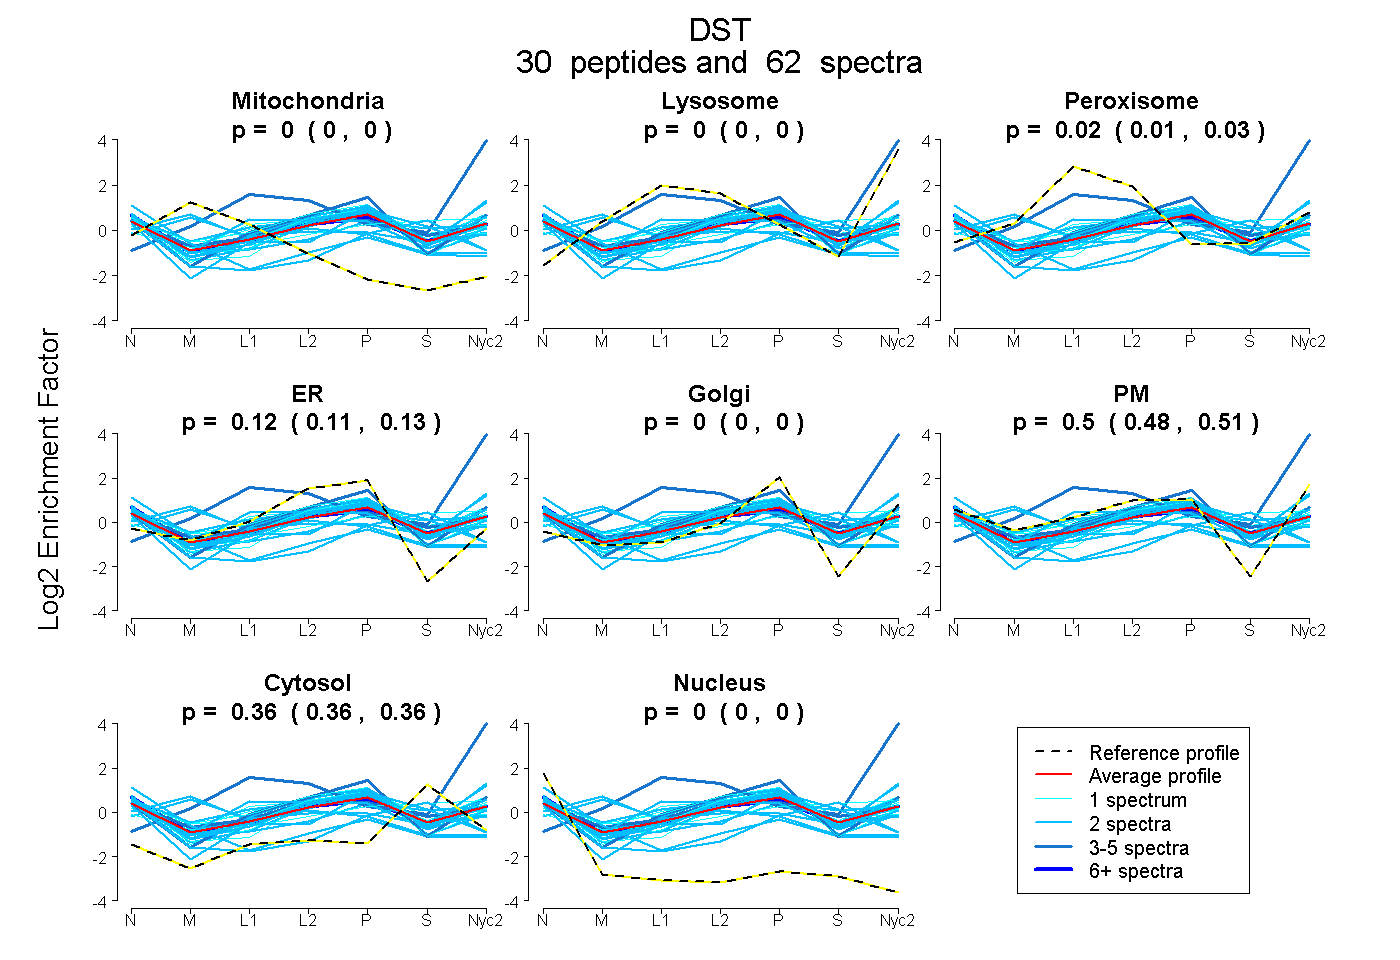 |
0.000
0.000 | 0.000 |
0.000
0.000 | 0.000 |
|
0.020
0.013 | 0.025 |
0.123
0.108 | 0.134 |
0.000
0.000 | 0.000 |
0.498
0.482 | 0.511 |
0.360
0.356 | 0.363 |
0.000
0.000 | 0.000 |
|
| | | Plot |
Mito |
|
Lyso or Perox |
|
ER |
Golgi |
PM |
Cytosol |
Nucleus |
|
| Expt B |
7
peptides |
9
spectra |
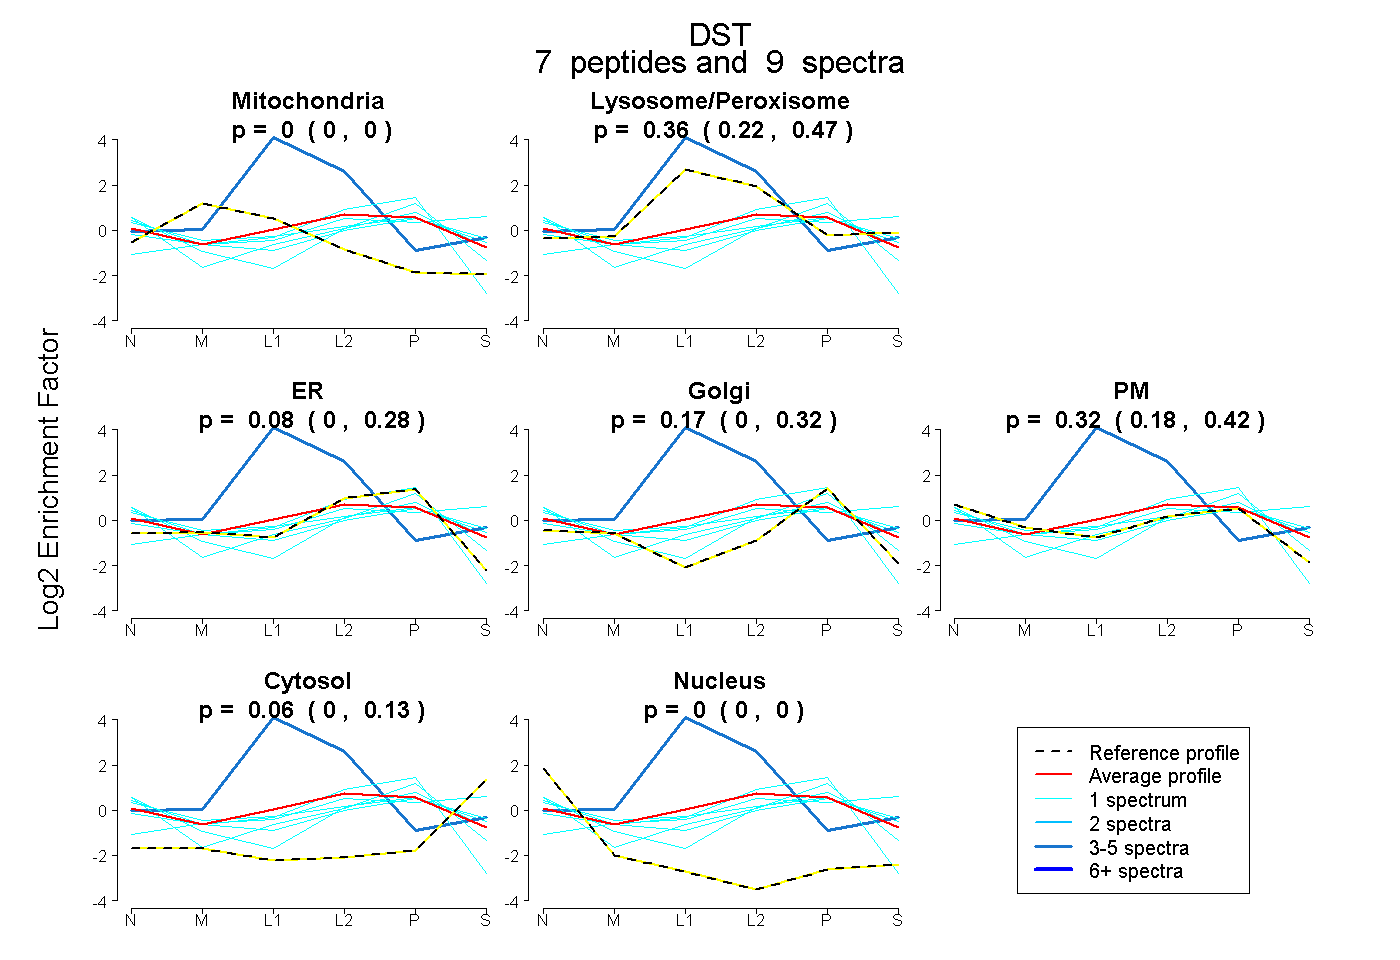 |
0.000
0.000 | 0.000 |
|
0.365
0.216 | 0.471 |
|
0.083
0.000 | 0.281 |
0.172
0.000 | 0.320 |
0.316
0.176 | 0.421 |
0.064
0.000 | 0.126 |
0.000
0.000 | 0.000 |
|
| 1 spectrum, LLDVMELAEK |
0.000 |
|
0.000 |
|
0.018 |
0.184 |
0.648 |
0.151 |
0.000 |
|
| 1 spectrum, QFNLGDSDK |
0.000 |
|
0.004 |
|
0.903 |
0.000 |
0.093 |
0.000 |
0.000 |
|
| 1 spectrum, ILHPLTR |
0.000 |
|
0.176 |
|
0.130 |
0.339 |
0.293 |
0.000 |
0.063 |
|
| 1 spectrum, NTEIFLK |
0.000 |
|
0.337 |
|
0.294 |
0.000 |
0.000 |
0.369 |
0.000 |
|
| 3 spectra, FLEHR |
0.000 |
|
1.000 |
|
0.000 |
0.000 |
0.000 |
0.000 |
0.000 |
|
| 1 spectrum, QEFIDGILSSK |
0.000 |
|
0.118 |
|
0.000 |
0.063 |
0.621 |
0.198 |
0.000 |
|
| 1 spectrum, EEQYFDPAK |
0.000 |
|
0.256 |
|
0.000 |
0.131 |
0.493 |
0.119 |
0.000 |
|
| | | Plot |
|
Lyso |
|
|
|
|
|
|
|
Other |
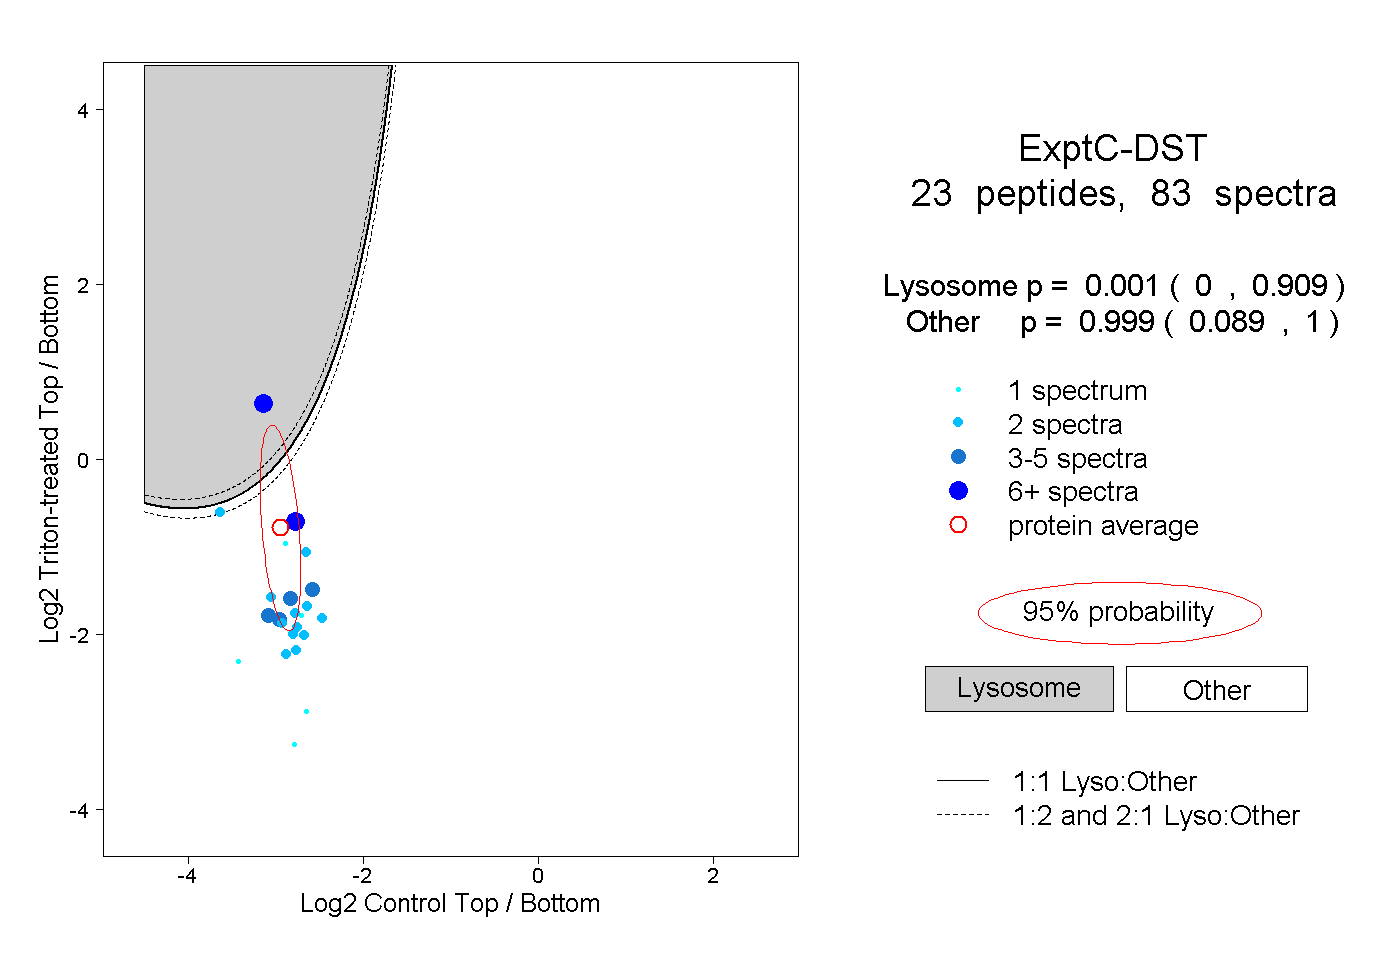
| Expt C |
23
peptides |
83
spectra |
 |
|
0.001
0.000 | 0.909 |
|
|
|
|
|
|
|
0.999
0.089 | 1.000 |
| | | Plot |
|
Lyso |
|
|
|
|
|
|
|
Other |
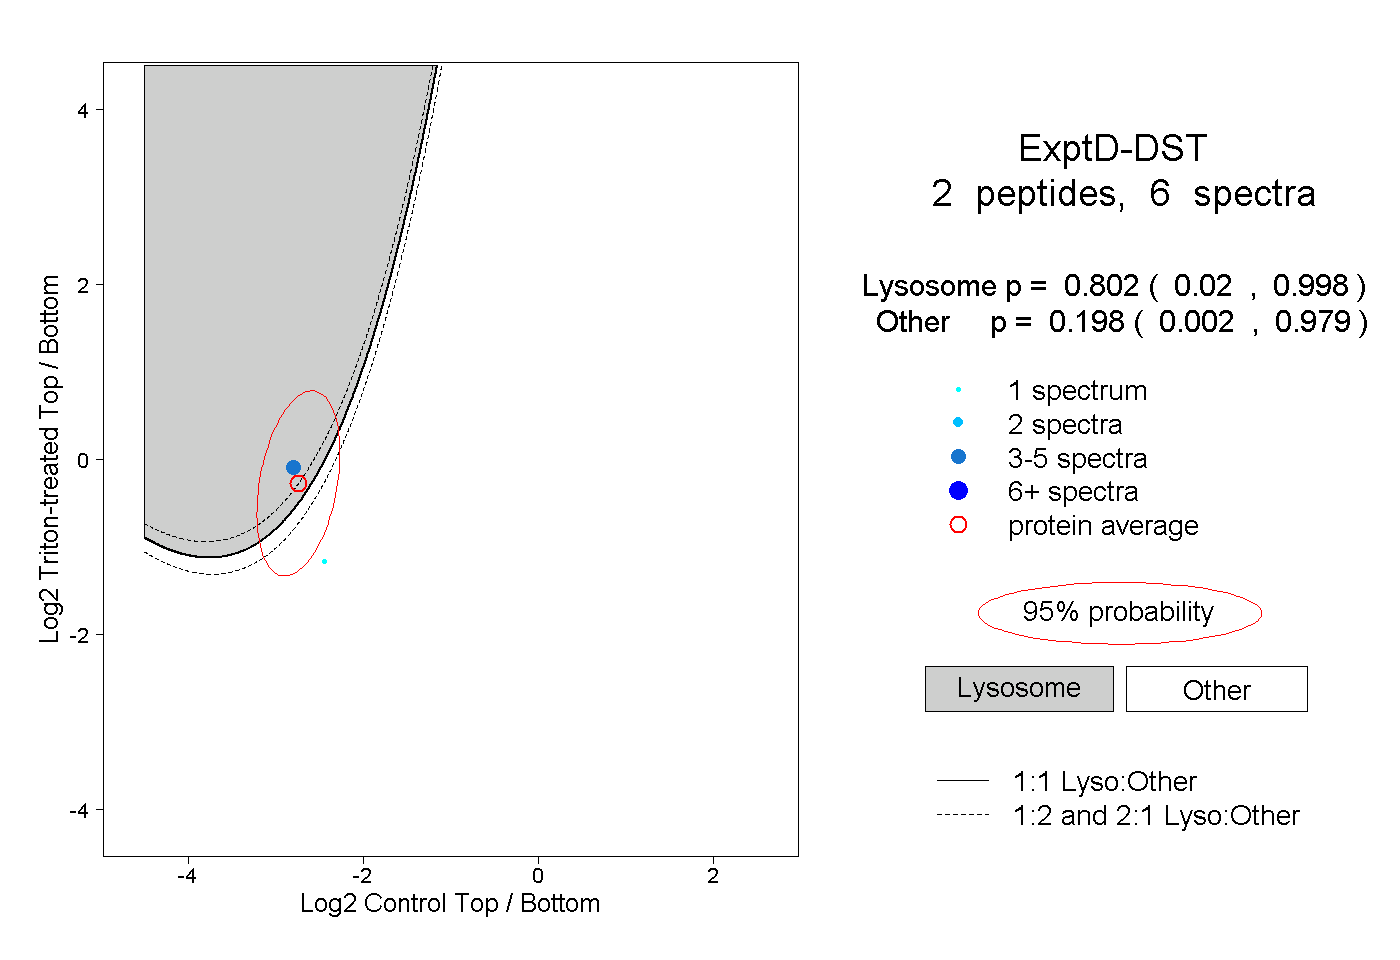
| Expt D |
2
peptides |
6
spectra |
 |
|
0.802
0.020 | 0.998 |
|
|
|
|
|
|
|
0.198
0.002 | 0.979 |