 3
3peptides
spectra
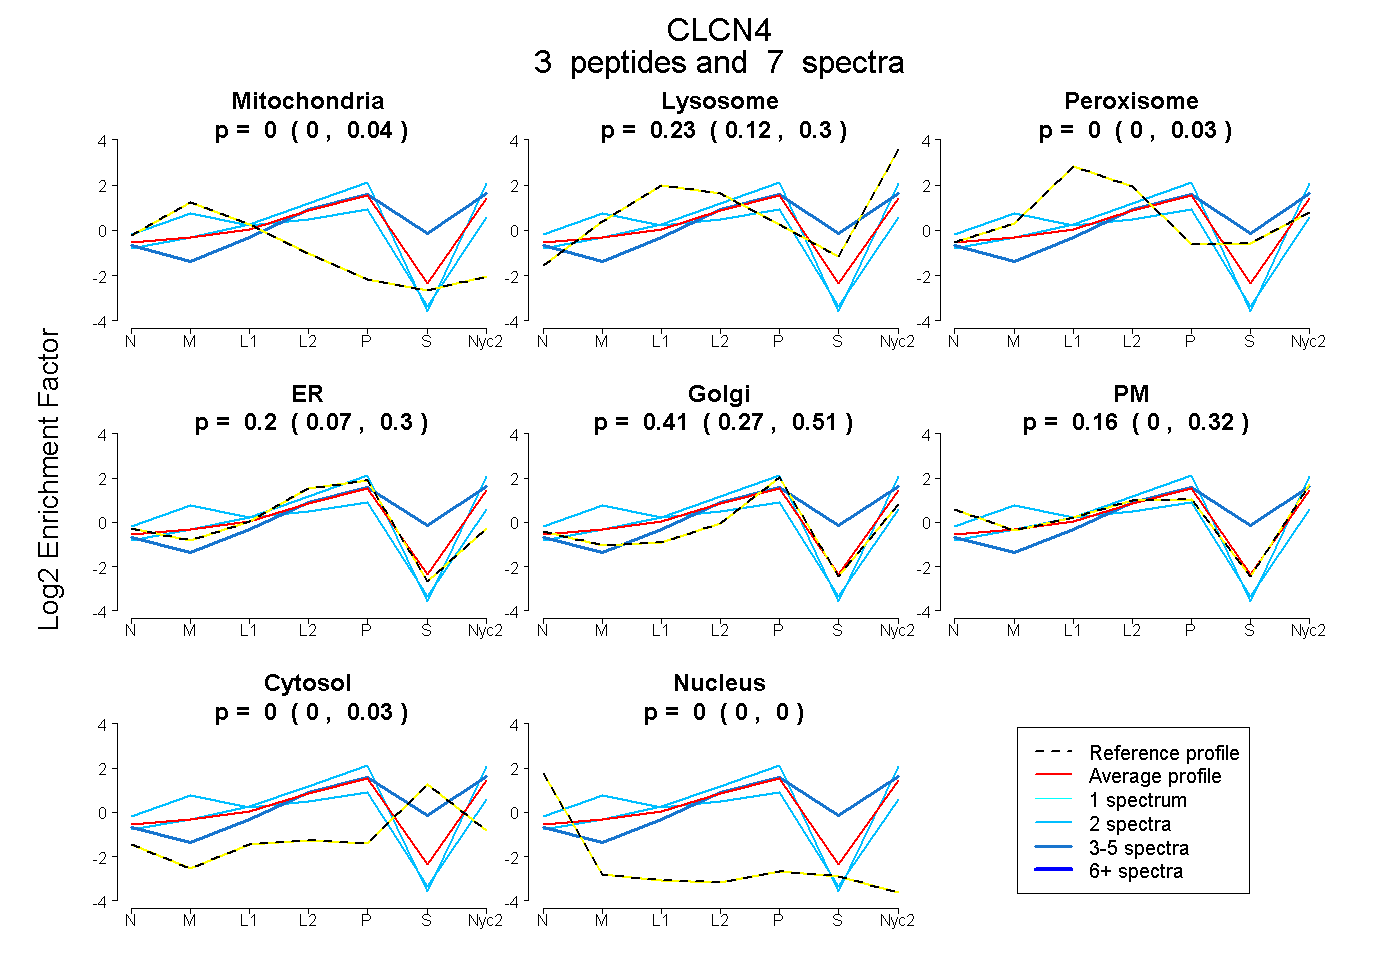
0.000 | 0.042
0.123 | 0.300
0.000 | 0.030
0.066 | 0.297
0.271 | 0.513
0.000 | 0.319
0.000 | 0.033
0.000 | 0.000
2peptides
spectra
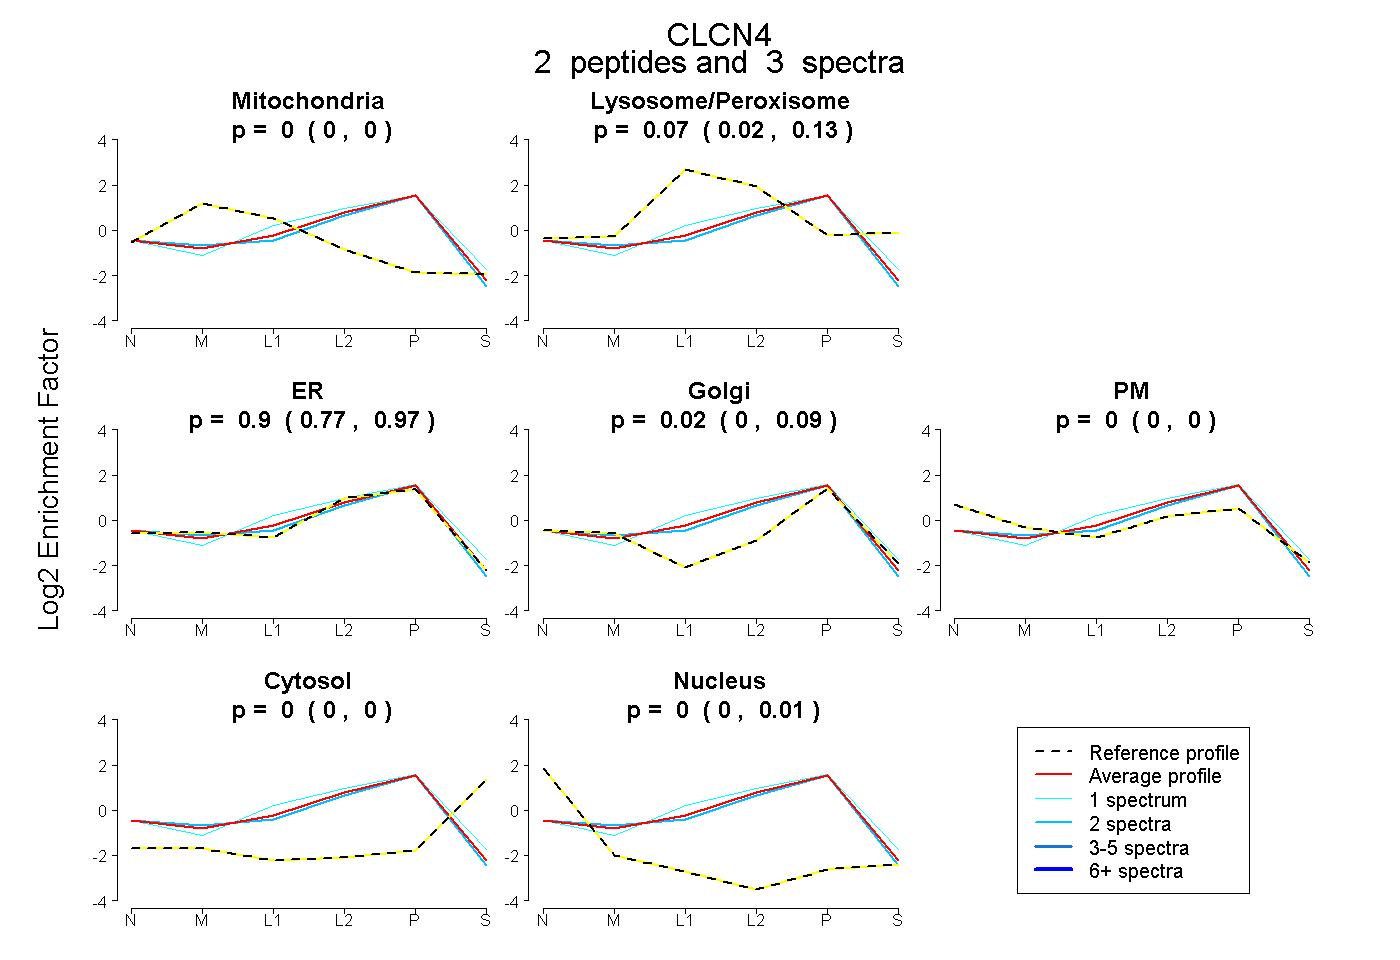
0.000 | 0.000
0.016 | 0.126
0.768 | 0.965
0.000 | 0.092
0.000 | 0.000
0.000 | 0.000
0.000 | 0.011
1peptide
spectra
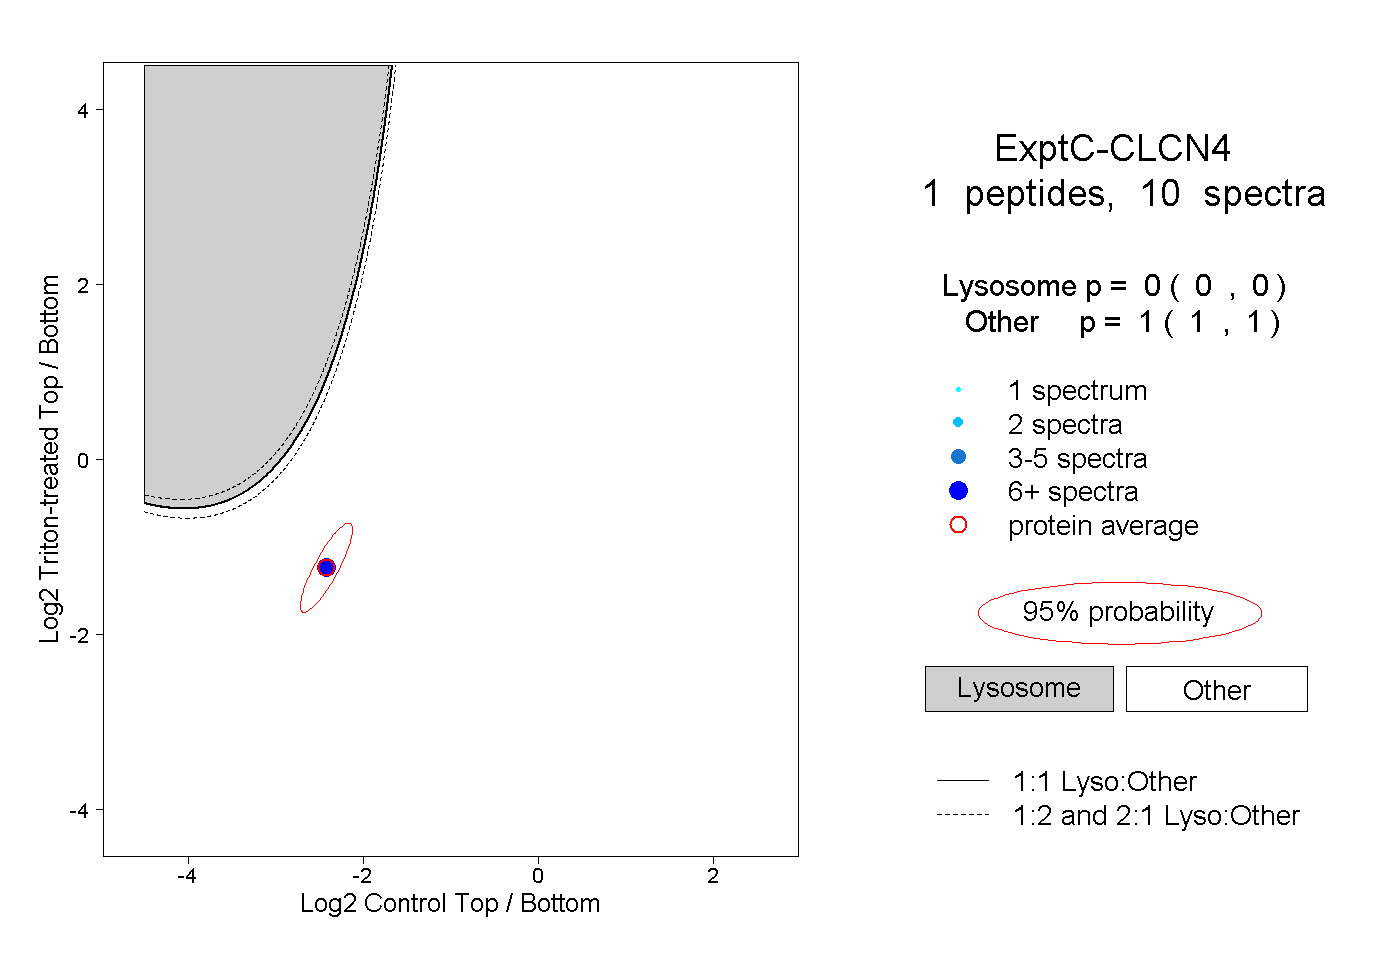
0.000 | 0.000
1.000 | 1.000