 3
3peptides
spectra
0.000 | 0.042
0.123 | 0.300
0.000 | 0.030
0.066 | 0.297
0.271 | 0.513
0.000 | 0.319
0.000 | 0.033
0.000 | 0.000
| Plot | Mito | Lyso | Perox | ER | Golgi | PM | Cytosol | Nucleus | |||||
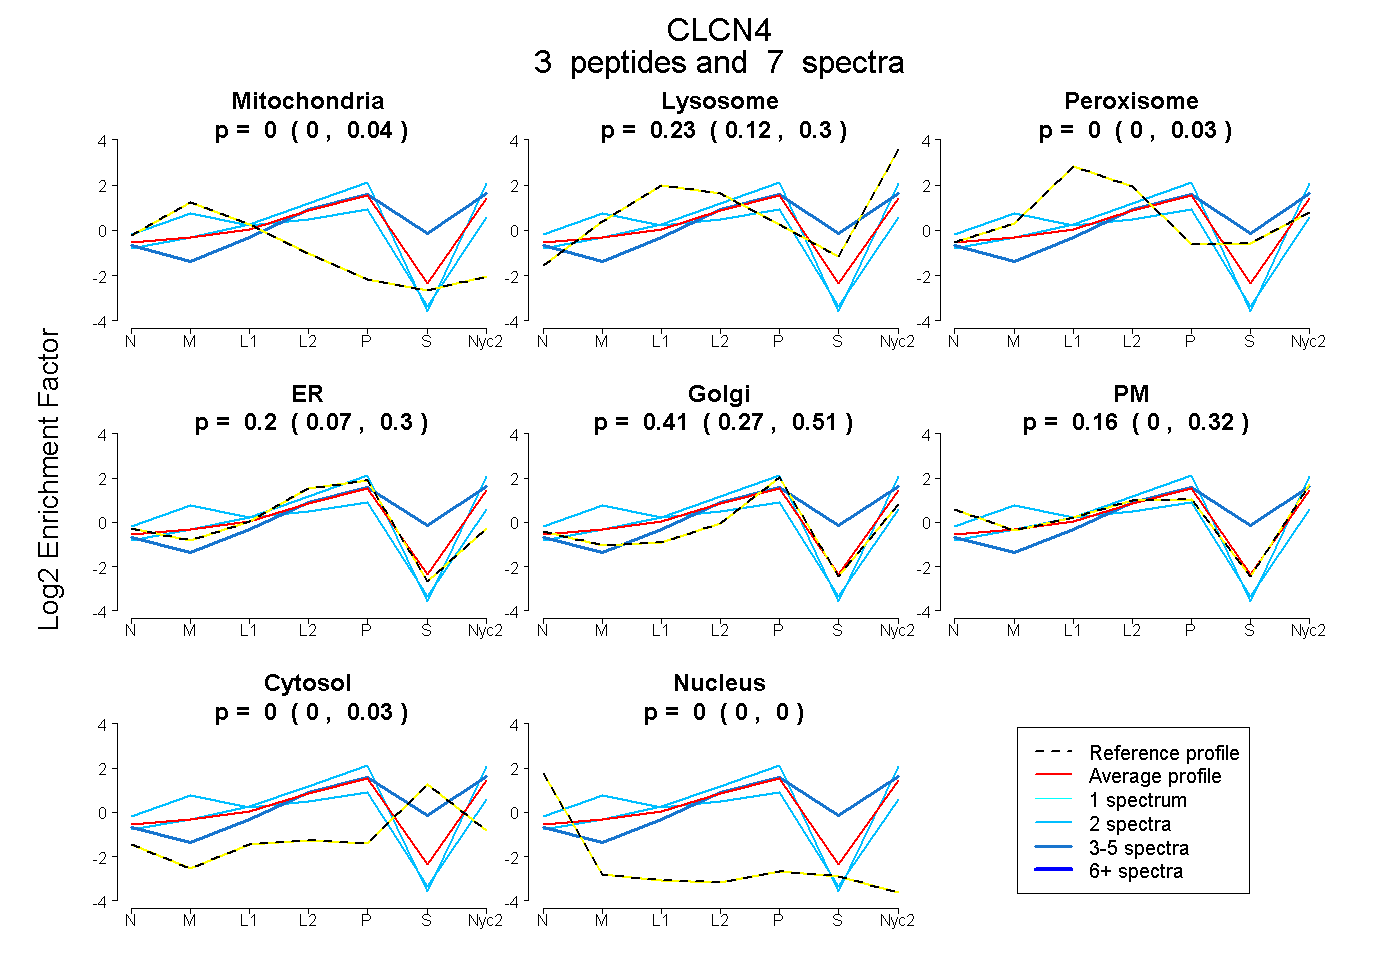
| Expt A |
3 peptides |
7 spectra |
|
0.000 0.000 | 0.042 |
0.231 0.123 | 0.300 |
0.000 0.000 | 0.030 |
0.196 0.066 | 0.297 |
0.410 0.271 | 0.513 |
0.163 0.000 | 0.319 |
0.000 0.000 | 0.033 |
0.000 0.000 | 0.000 |
| 2 spectra, ELILAIK | 0.000 | 0.230 | 0.000 | 0.208 | 0.337 | 0.226 | 0.000 | 0.000 | ||
| 3 spectra, LIGFAQR | 0.000 | 0.325 | 0.000 | 0.030 | 0.419 | 0.000 | 0.225 | 0.000 | ||
| 2 spectra, DEFTHR | 0.237 | 0.033 | 0.000 | 0.211 | 0.052 | 0.467 | 0.000 | 0.000 |
| Plot | Mito | Lyso or Perox | ER | Golgi | PM | Cytosol | Nucleus | ||||||
| Expt B |
2 peptides |
3 spectra |
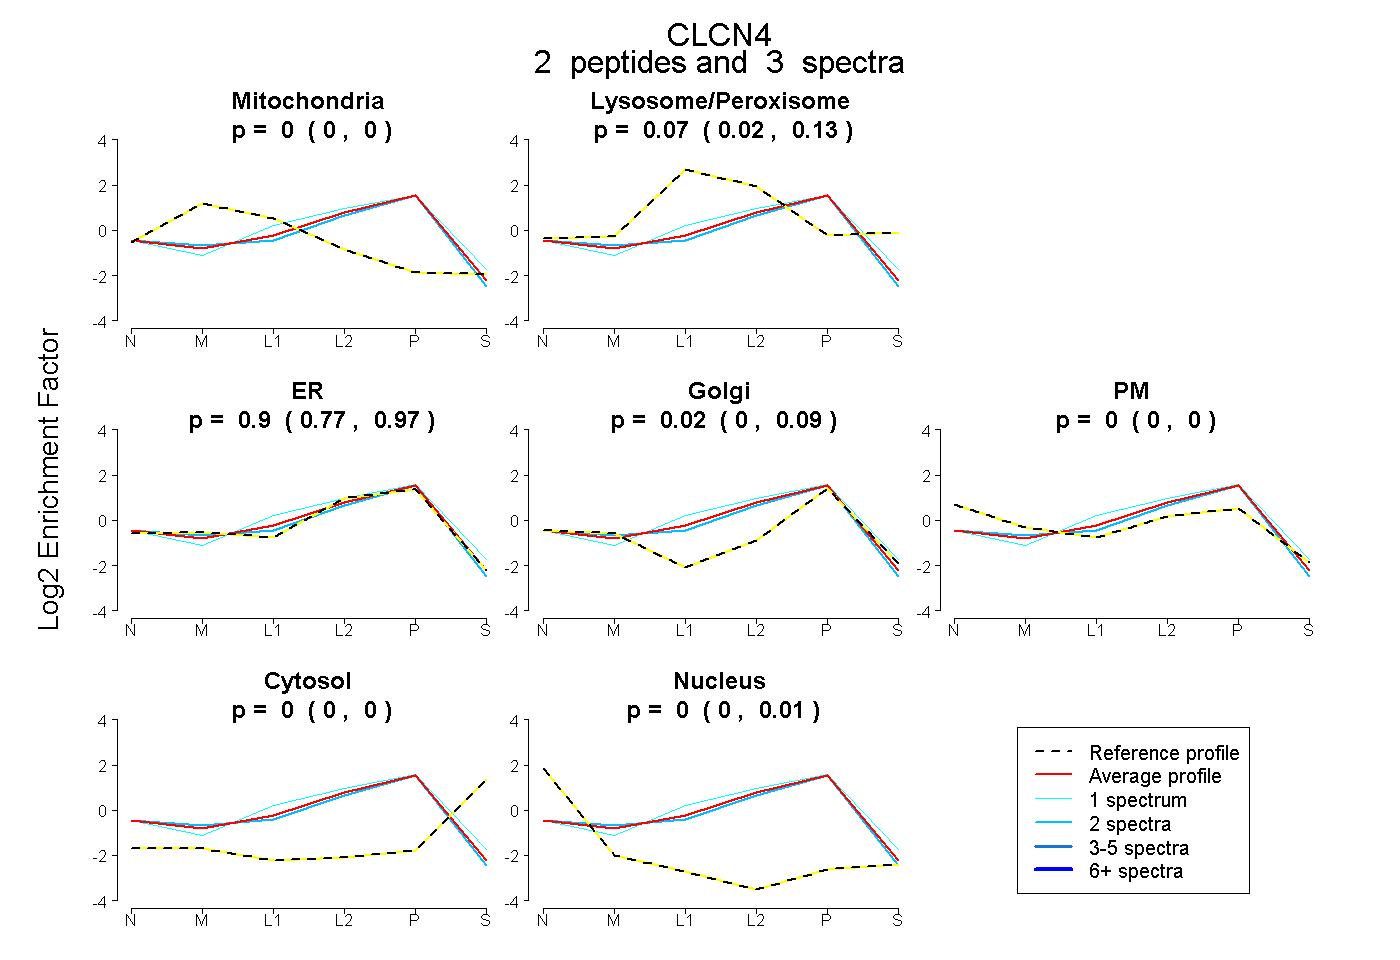 |
0.000 0.000 | 0.000 |
0.074 0.016 | 0.126 |
0.902 0.768 | 0.965 |
0.024 0.000 | 0.092 |
0.000 0.000 | 0.000 |
0.000 0.000 | 0.000 |
0.000 0.000 | 0.011 |
|||
| Plot | Lyso | Other | |||||||||||
| Expt C |
1 peptide |
10 spectra |
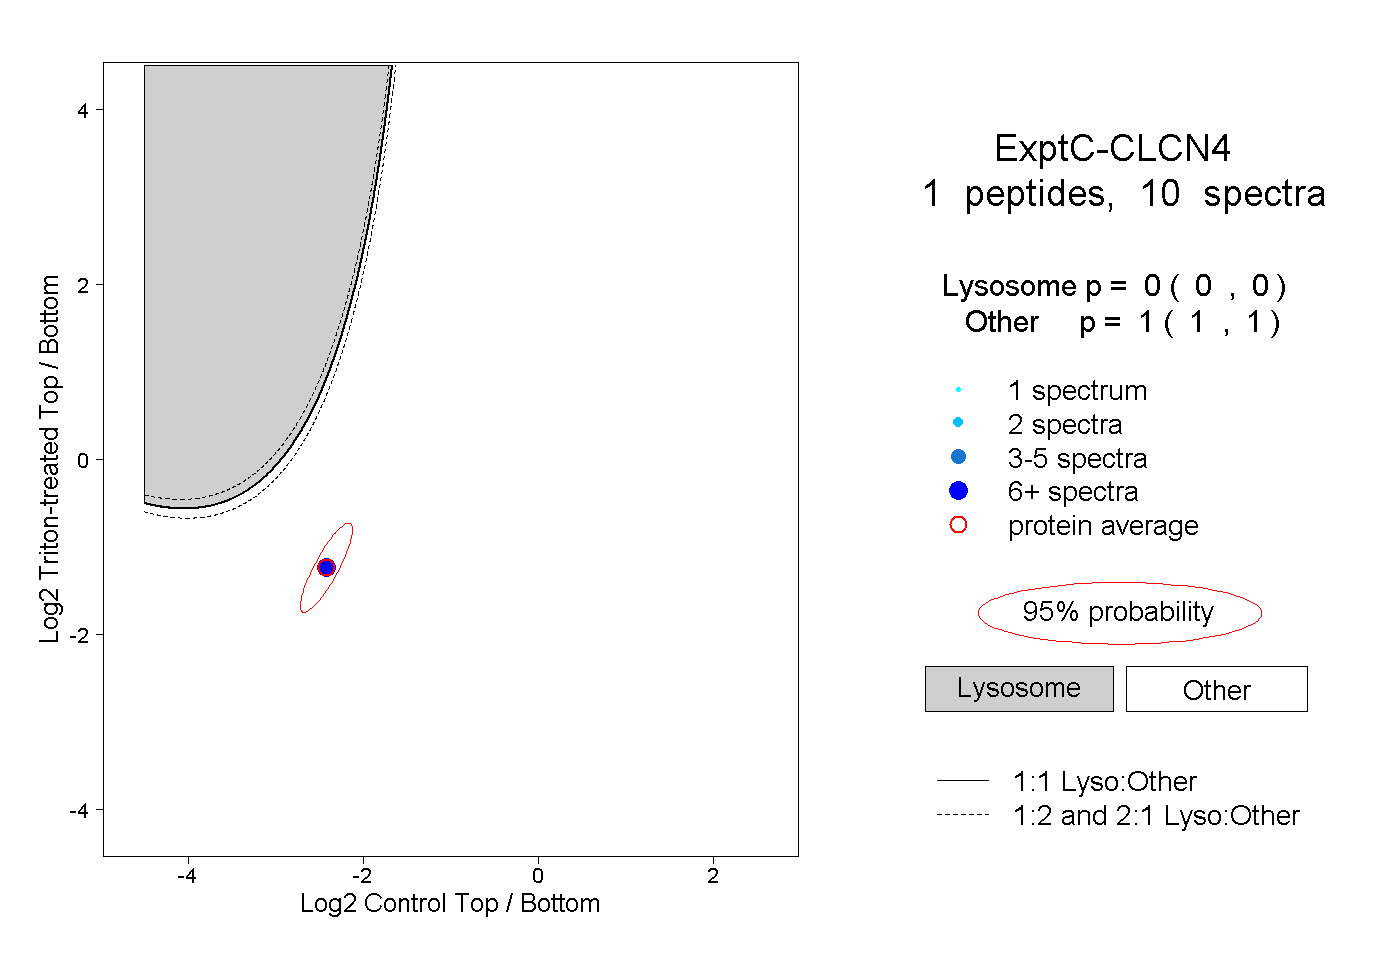 |
0.000 0.000 | 0.000 |
1.000 1.000 | 1.000 |