CLCN4
[ENSRNOP00000056037]
Main page
| | | Plot |
Mito |
Lyso |
|
Perox |
ER |
Golgi |
PM |
Cytosol |
Nucleus |
|
| Expt A |
 3
3
peptides |
7
spectra |
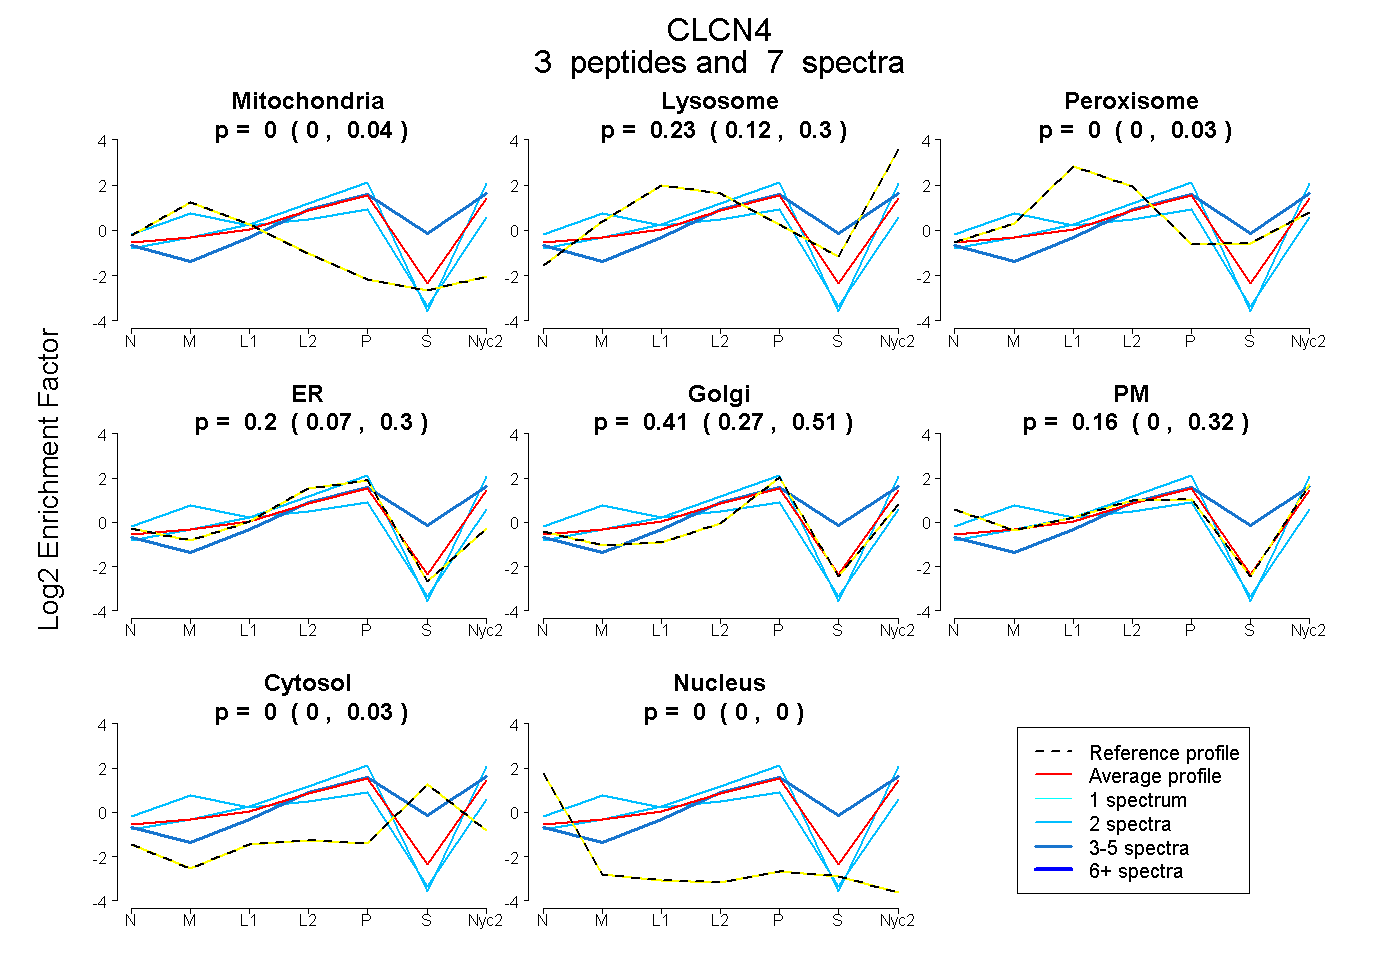 |
0.000
0.000 | 0.042 |
0.231
0.123 | 0.300 |
|
0.000
0.000 | 0.030 |
0.196
0.066 | 0.297 |
0.410
0.271 | 0.513 |
0.163
0.000 | 0.319 |
0.000
0.000 | 0.033 |
0.000
0.000 | 0.000 |
|
| | | Plot |
Mito |
|
Lyso or Perox |
|
ER |
Golgi |
PM |
Cytosol |
Nucleus |
|
| Expt B |
2
peptides |
3
spectra |
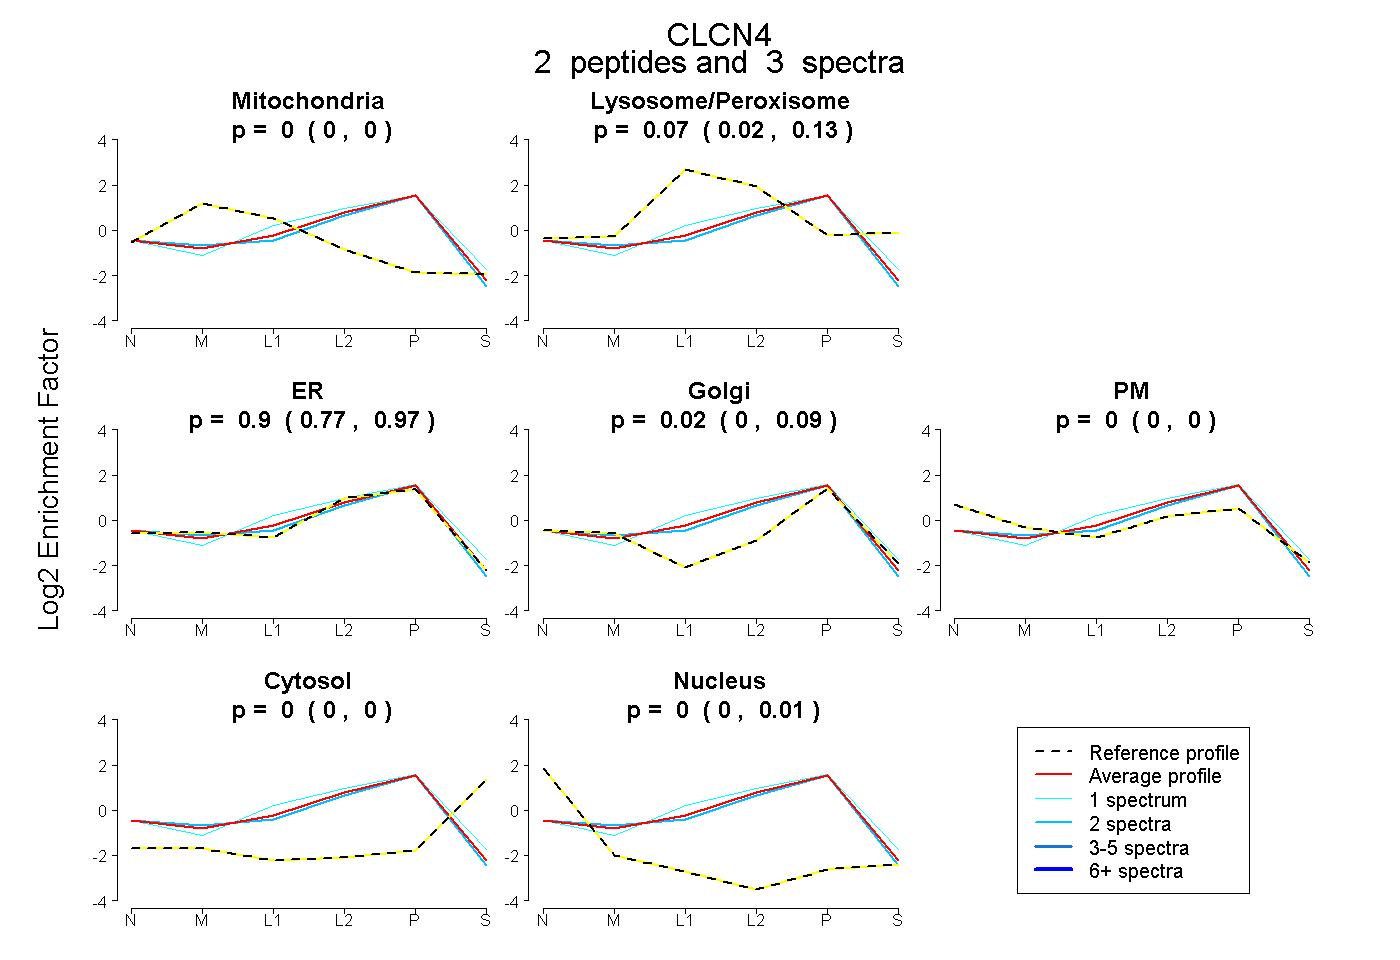 |
0.000
0.000 | 0.000 |
|
0.074
0.016 | 0.126 |
|
0.902
0.768 | 0.965 |
0.024
0.000 | 0.092 |
0.000
0.000 | 0.000 |
0.000
0.000 | 0.000 |
0.000
0.000 | 0.011 |
|
| 1 spectrum, LLGIITK |
0.000 |
|
0.201 |
|
0.785 |
0.014 |
0.000 |
0.000 |
0.000 |
|
| 2 spectra, LIGFAQR |
0.000 |
|
0.001 |
|
0.963 |
0.000 |
0.028 |
0.000 |
0.008 |
|
| | | Plot |
|
Lyso |
|
|
|
|
|
|
|
Other |
| Expt C |
1
peptide |
10
spectra |
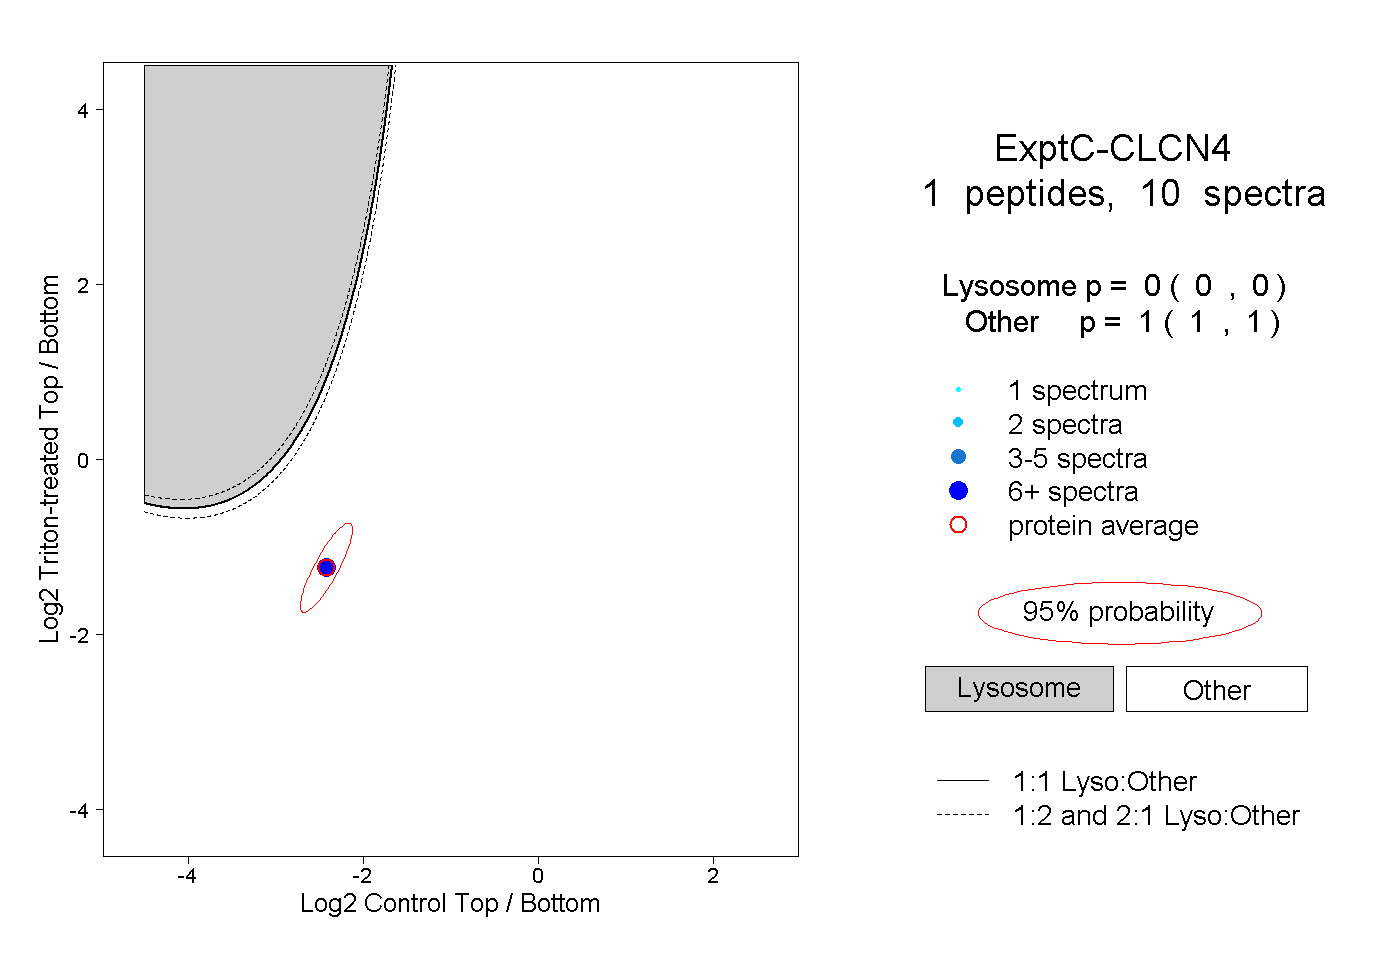 |
|
0.000
0.000 | 0.000 |
|
|
|
|
|
|
|
1.000
1.000 | 1.000 |