 2
2peptides
spectra
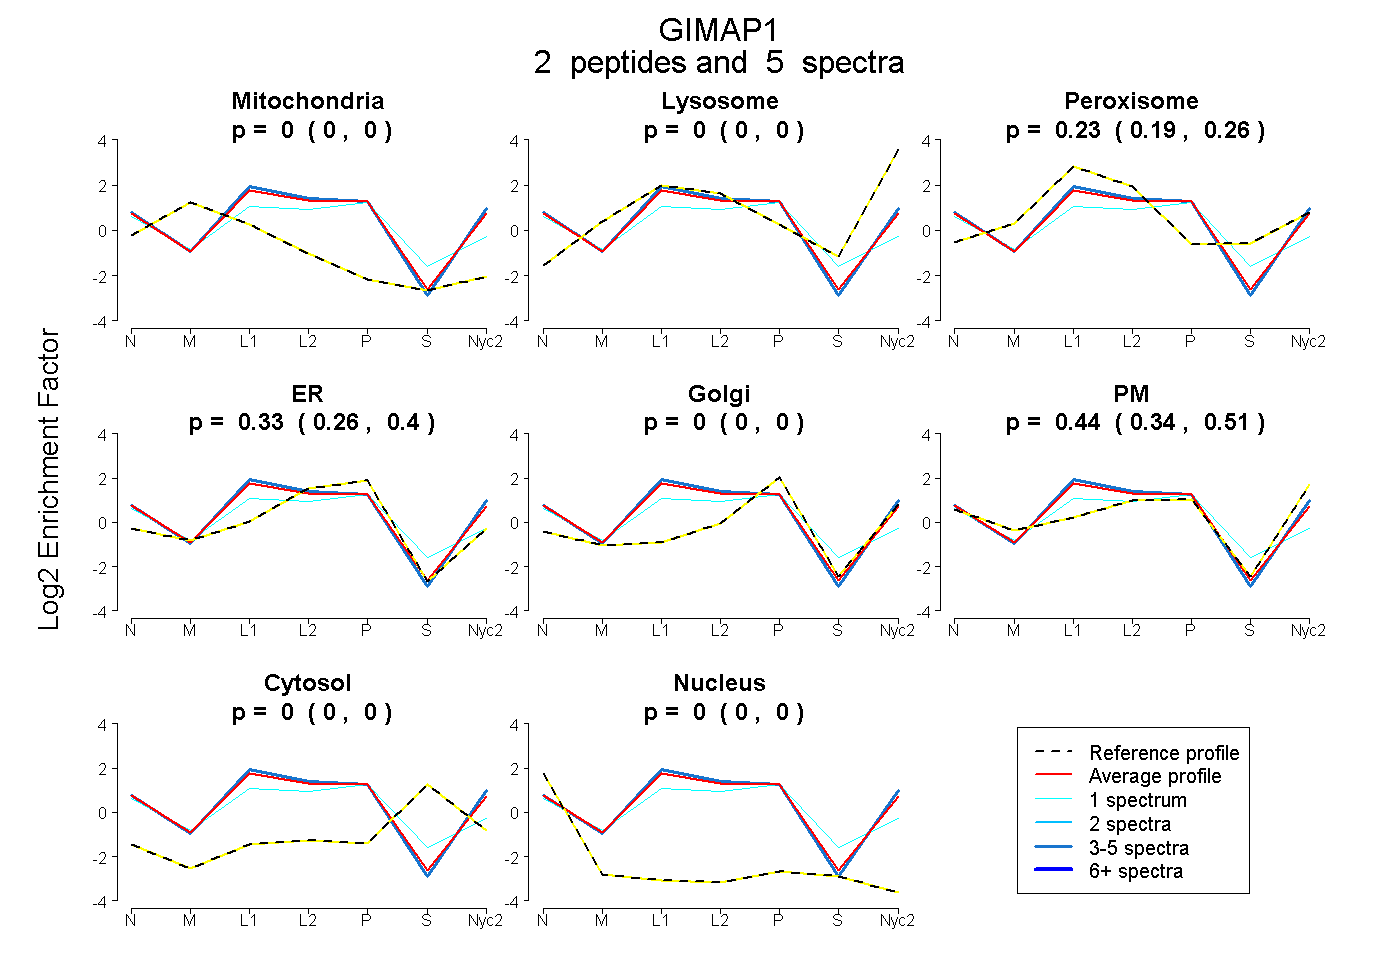
0.000 | 0.000
0.000 | 0.000
0.192 | 0.261
0.262 | 0.399
0.000 | 0.000
0.343 | 0.506
0.000 | 0.000
0.000 | 0.000
2peptides
spectra
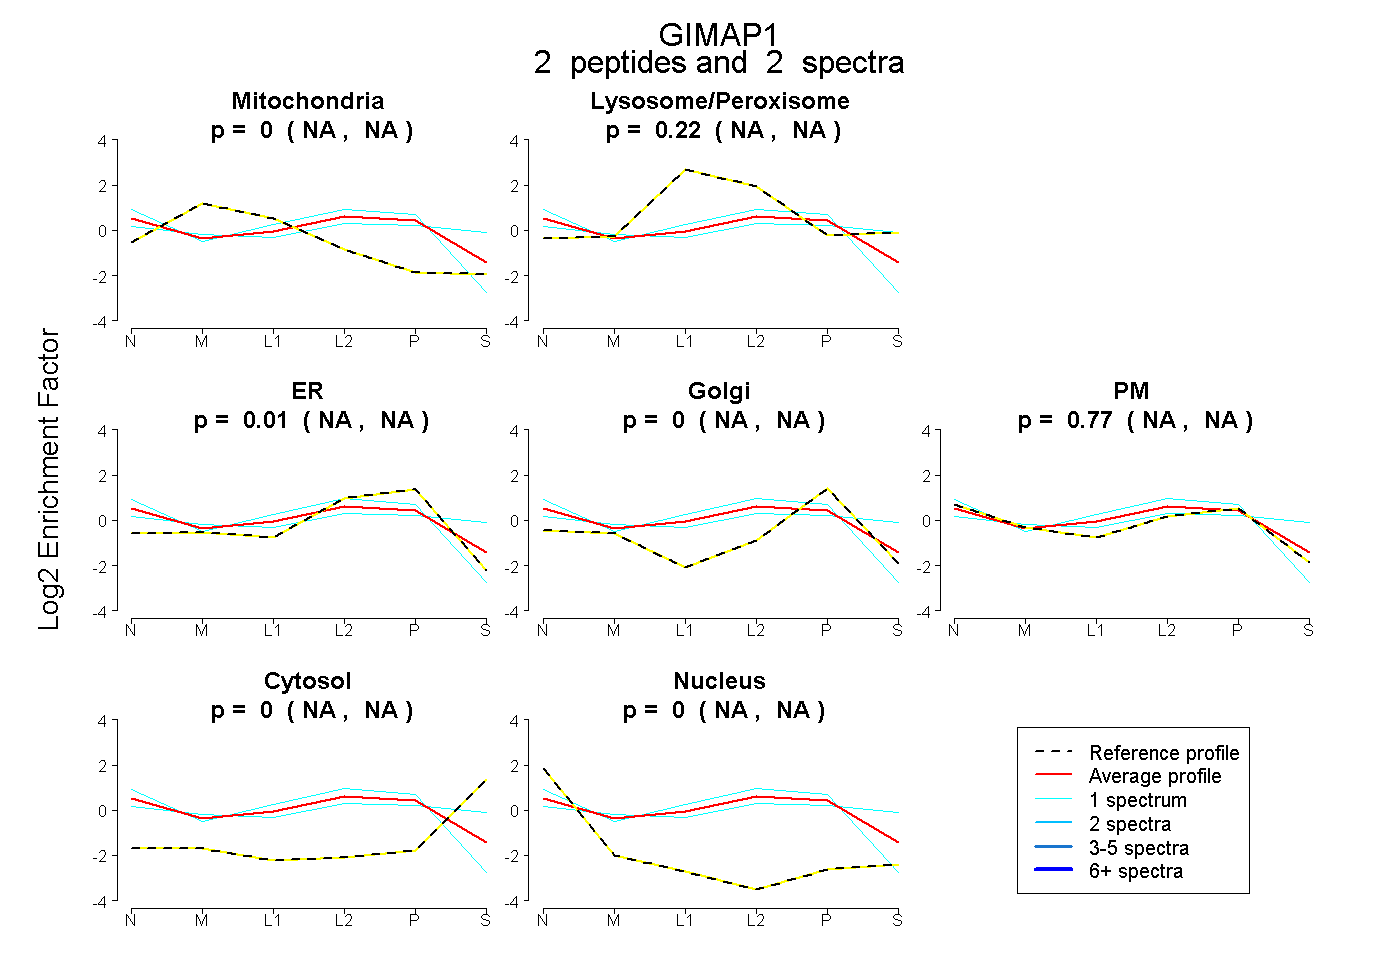
NA | NA
NA | NA
NA | NA
NA | NA
NA | NA
NA | NA
NA | NA
11peptides
spectra
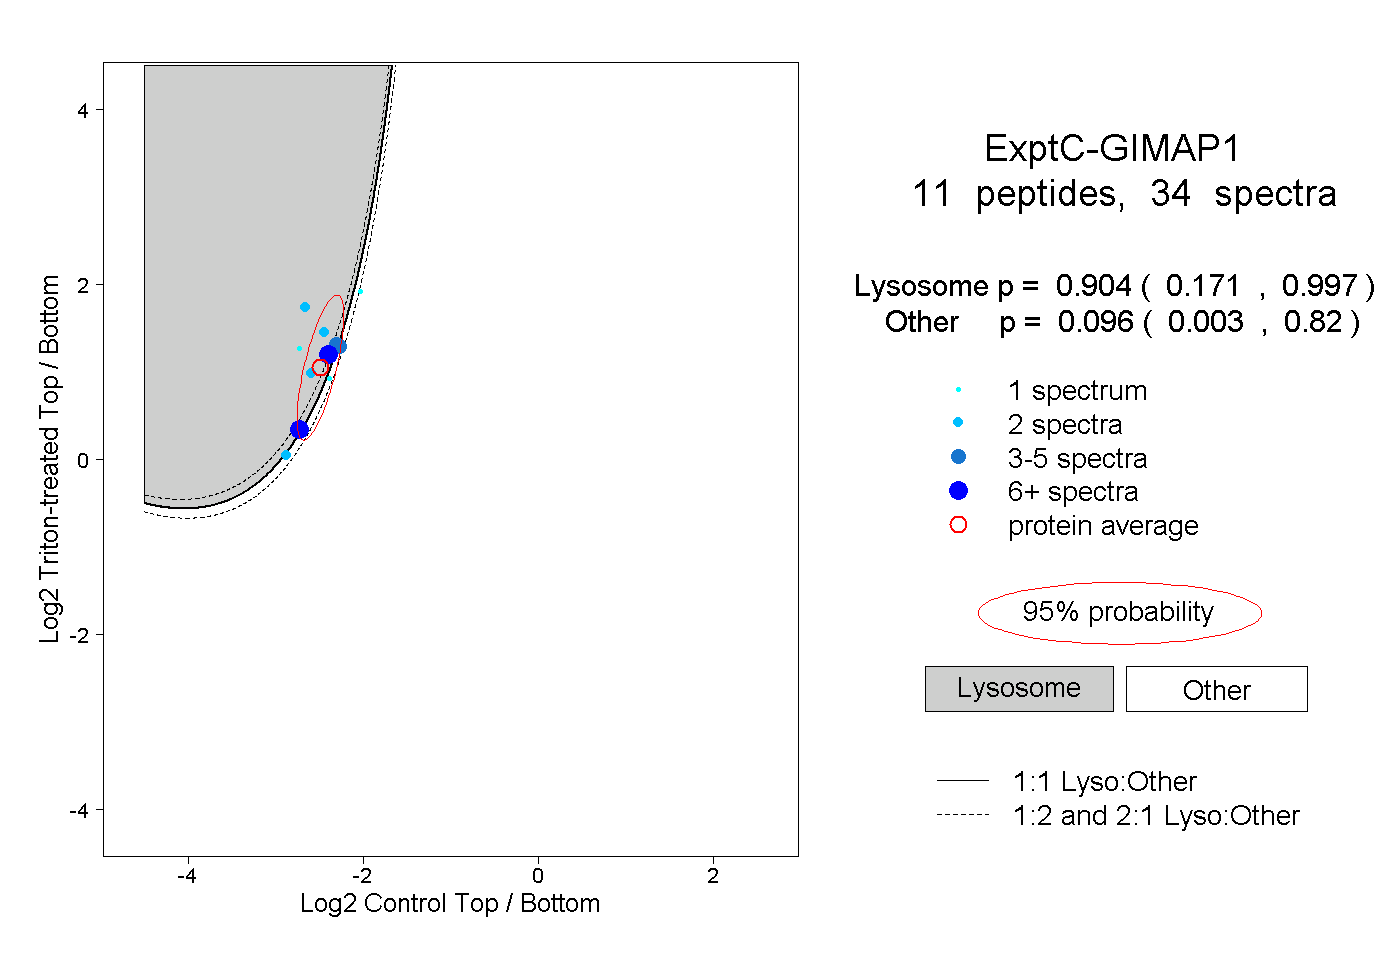
0.171 | 0.997
0.003 | 0.820
2peptides
spectra
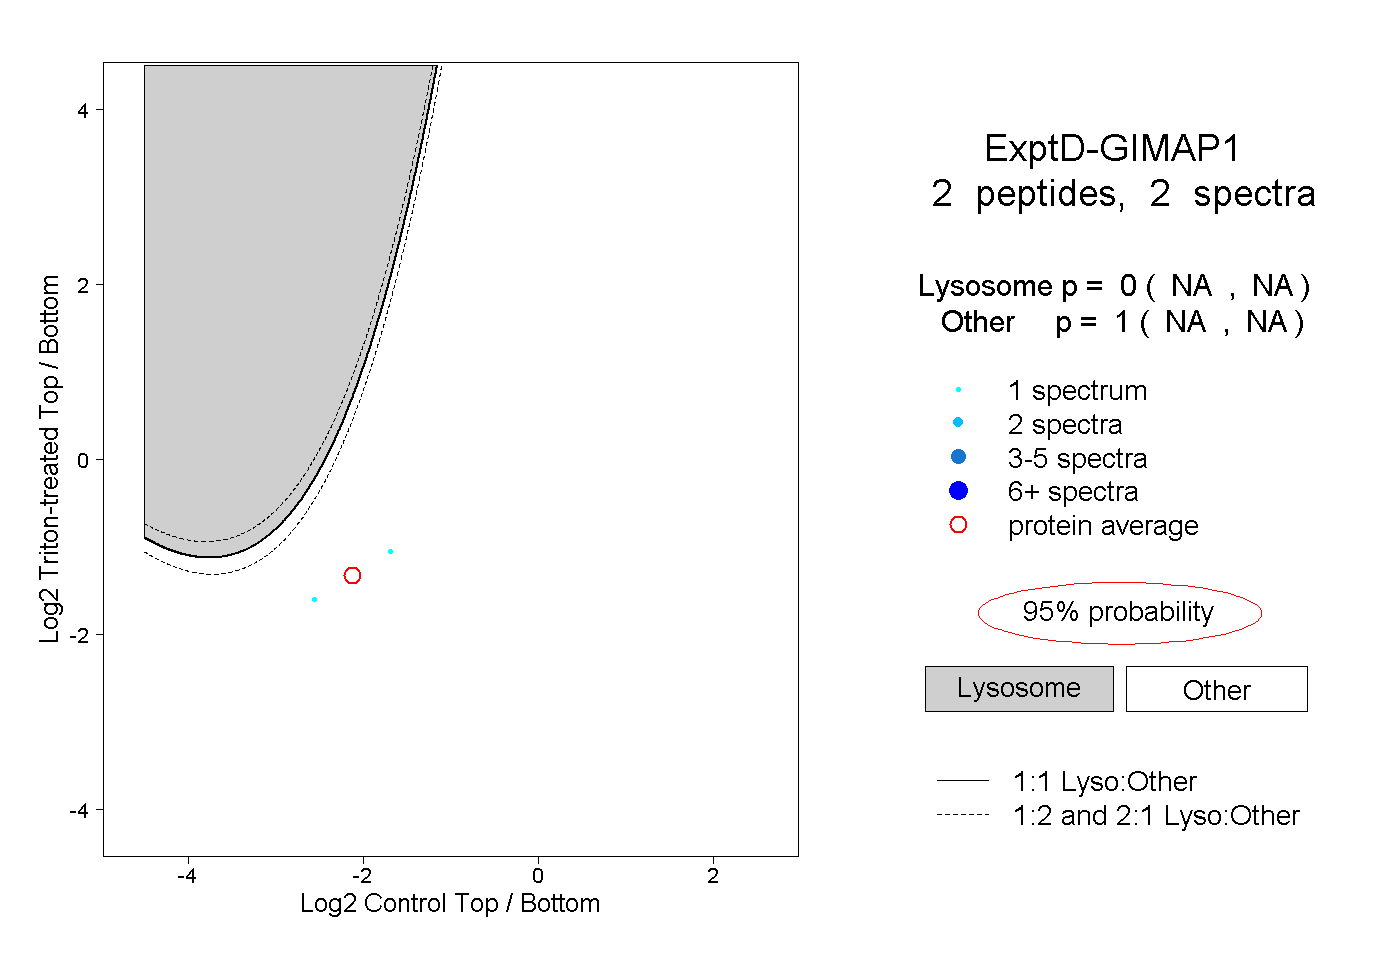
NA | NA
NA | NA