 2
2peptides
spectra
0.000 | 0.000
0.000 | 0.000
0.192 | 0.261
0.262 | 0.399
0.000 | 0.000
0.343 | 0.506
0.000 | 0.000
0.000 | 0.000
| Plot | Mito | Lyso | Perox | ER | Golgi | PM | Cytosol | Nucleus | |||||
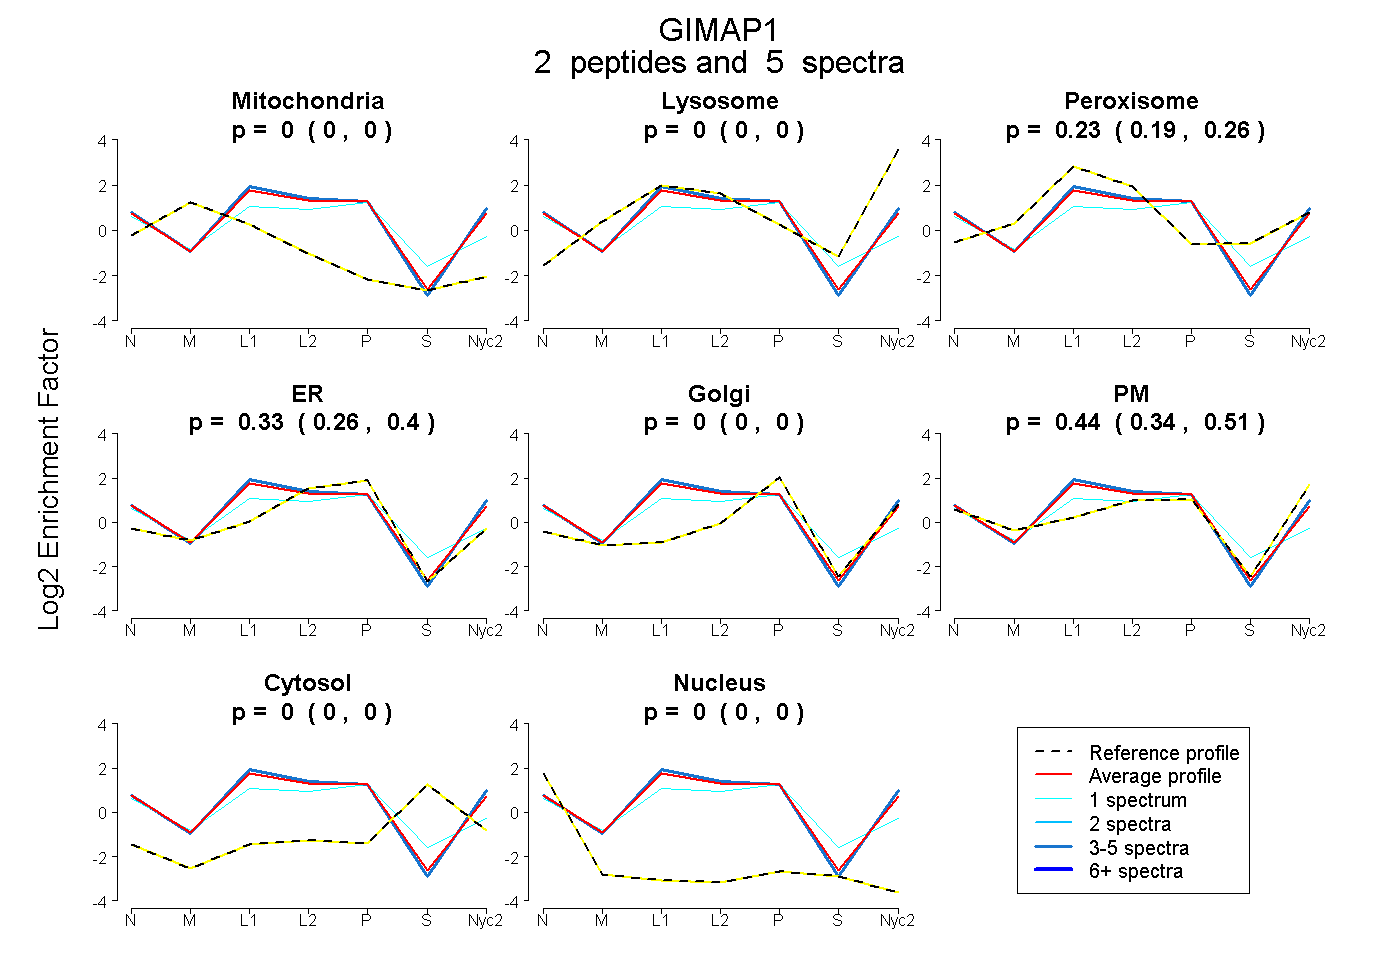
| Expt A |
2 peptides |
5 spectra |
|
0.000 0.000 | 0.000 |
0.000 0.000 | 0.000 |
0.229 0.192 | 0.261 |
0.334 0.262 | 0.399 |
0.000 0.000 | 0.000 |
0.436 0.343 | 0.506 |
0.000 0.000 | 0.000 |
0.000 0.000 | 0.000 |
| 4 spectra, LILVGR | 0.000 | 0.000 | 0.220 | 0.264 | 0.000 | 0.516 | 0.000 | 0.000 | ||
| 1 spectrum, SDPGCVEAAR | 0.000 | 0.000 | 0.300 | 0.531 | 0.000 | 0.084 | 0.000 | 0.085 |
| Plot | Mito | Lyso or Perox | ER | Golgi | PM | Cytosol | Nucleus | ||||||
| Expt B |
2 peptides |
2 spectra |
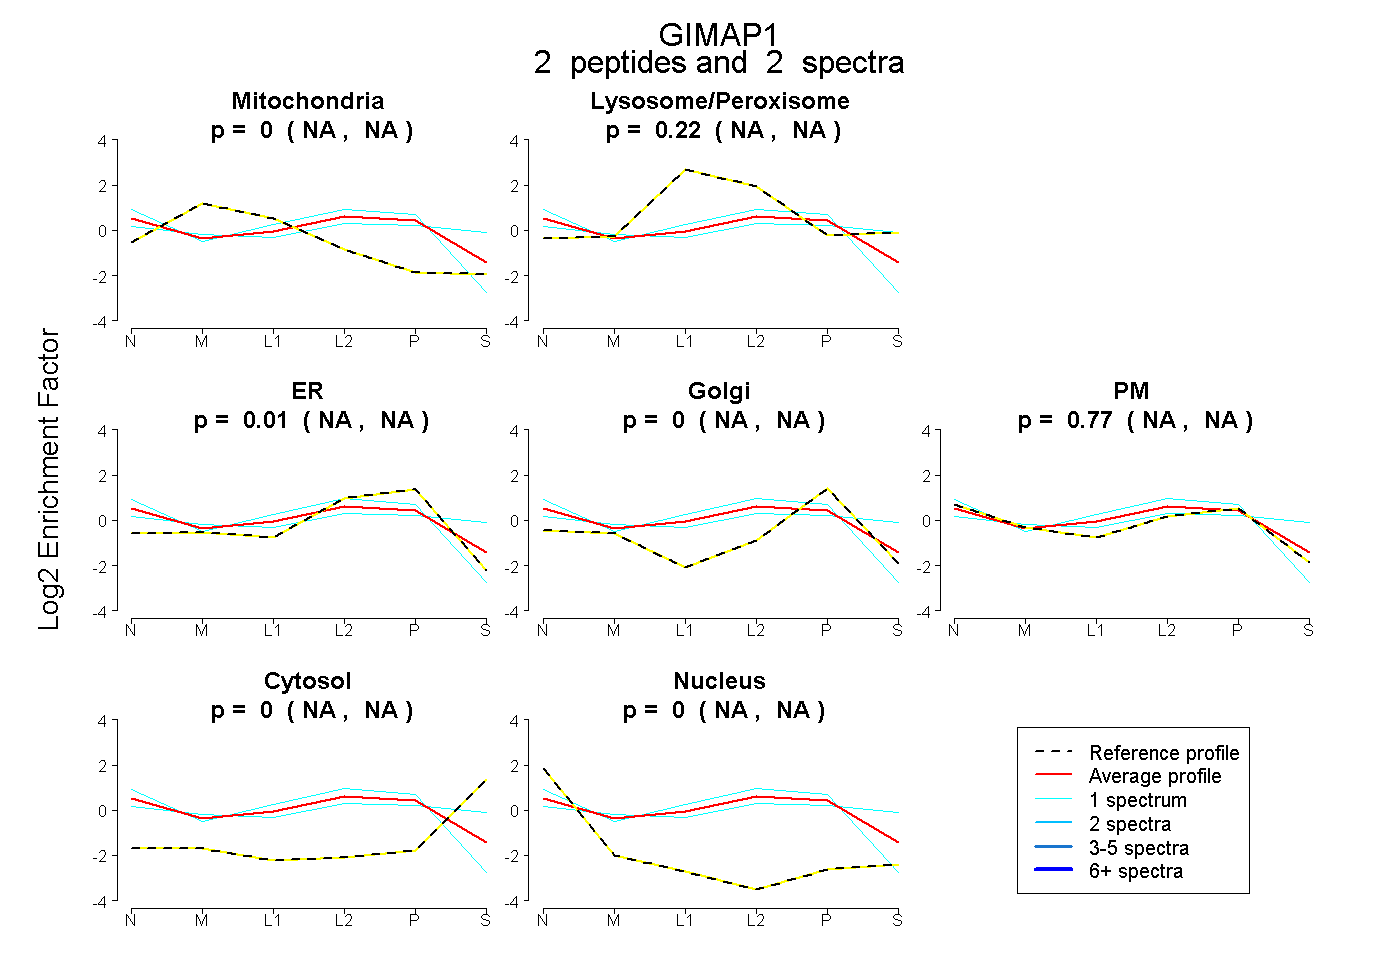 |
0.000 NA | NA |
0.220 NA | NA |
0.010 NA | NA |
0.000 NA | NA |
0.771 NA | NA |
0.000 NA | NA |
0.000 NA | NA |
|||
| Plot | Lyso | Other | |||||||||||
| Expt C |
11 peptides |
34 spectra |
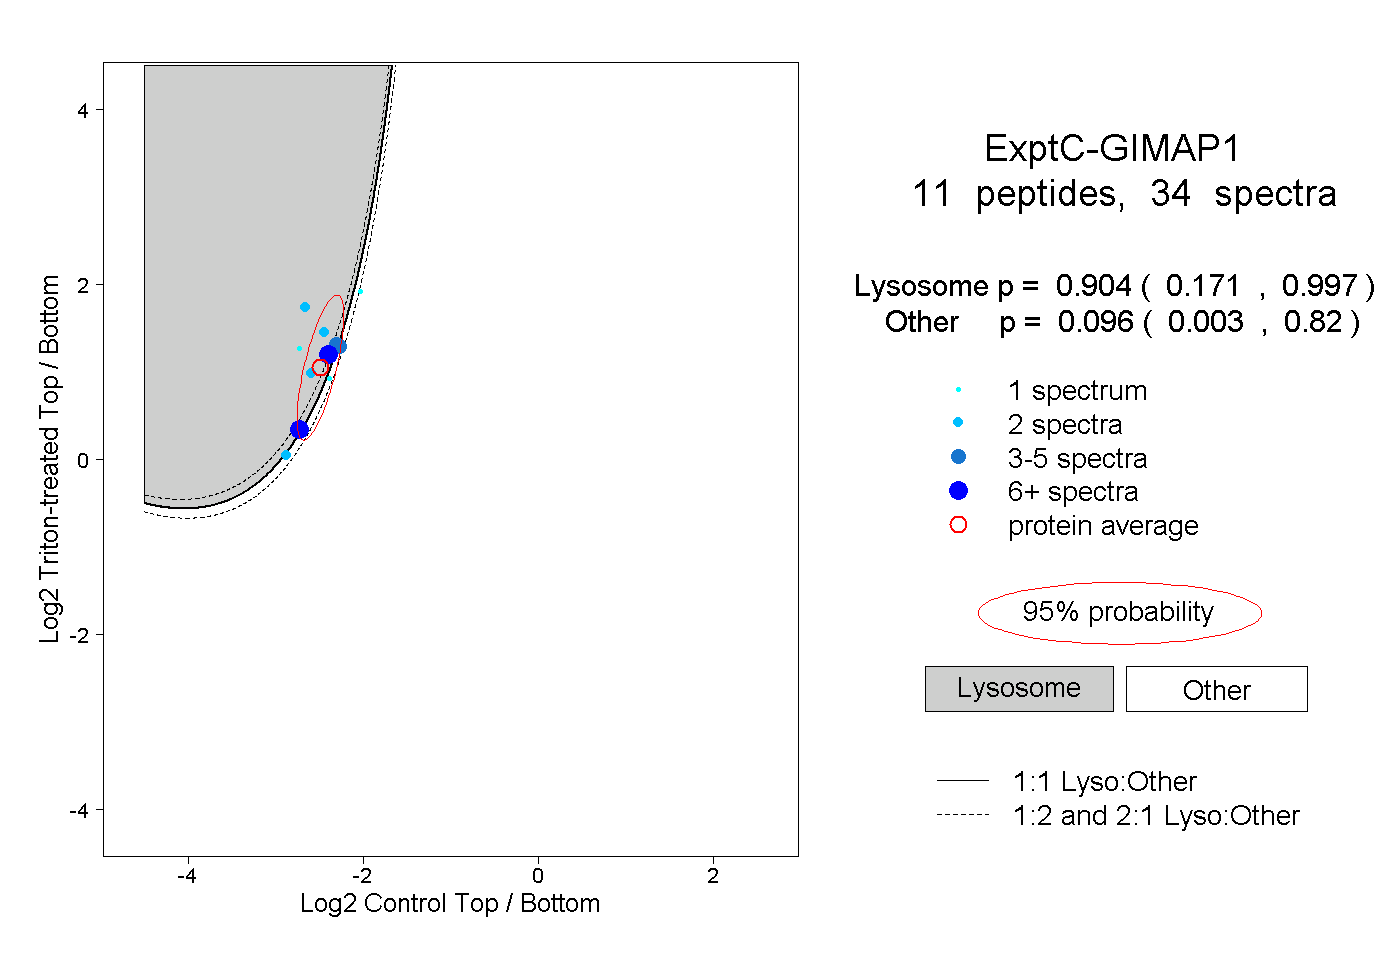 |
0.904 0.171 | 0.997 |
0.096 0.003 | 0.820 |
||||||||
| Plot | Lyso | Other | |||||||||||
| Expt D |
2 peptides |
2 spectra |
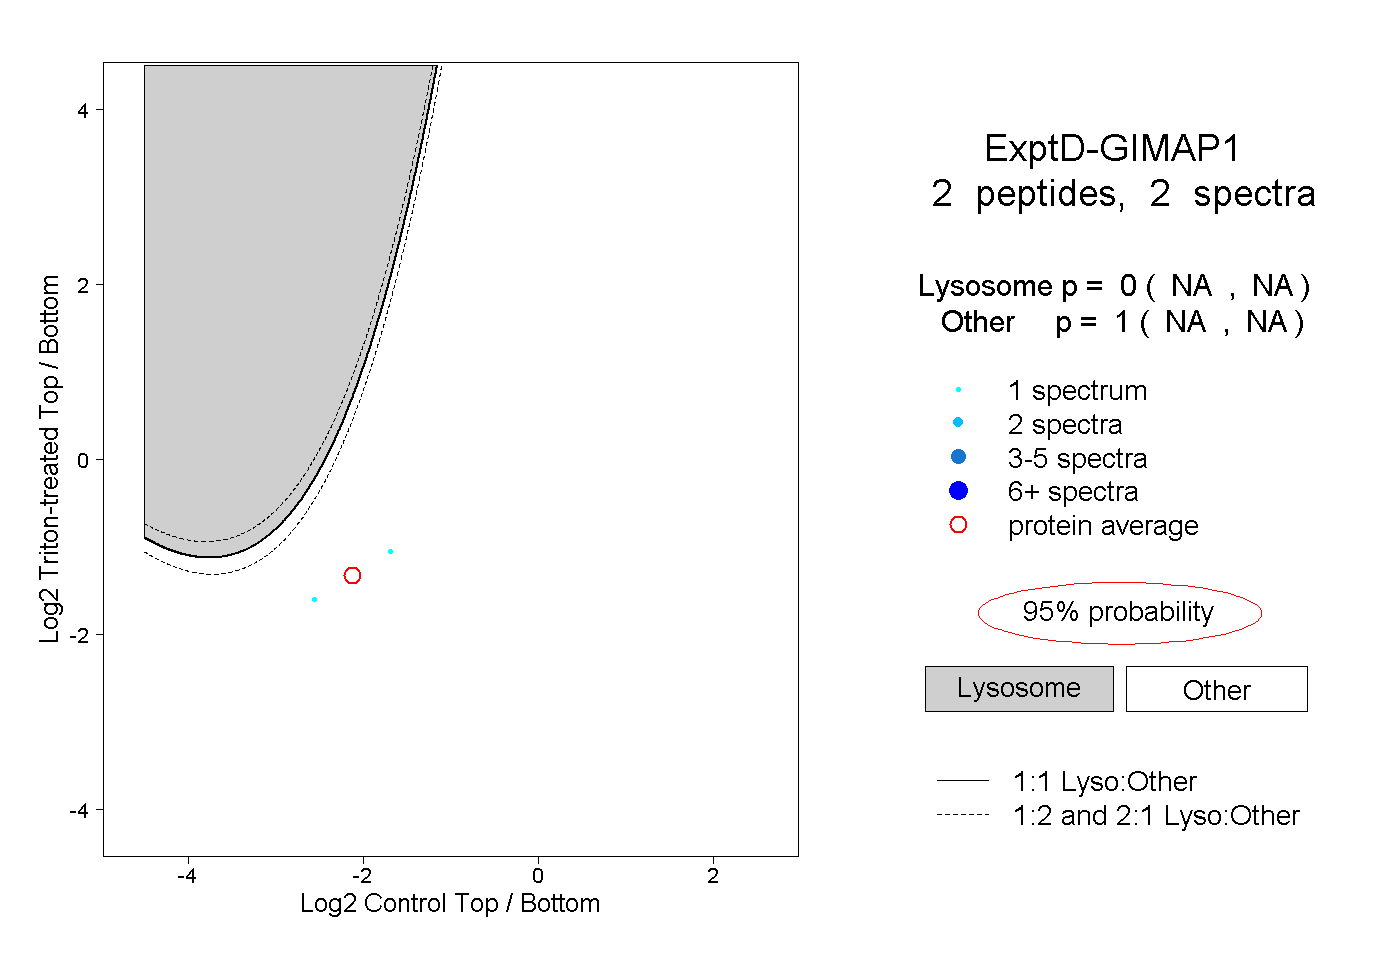 |
0.000 NA | NA |
1.000 NA | NA |