 12
12peptides
spectra
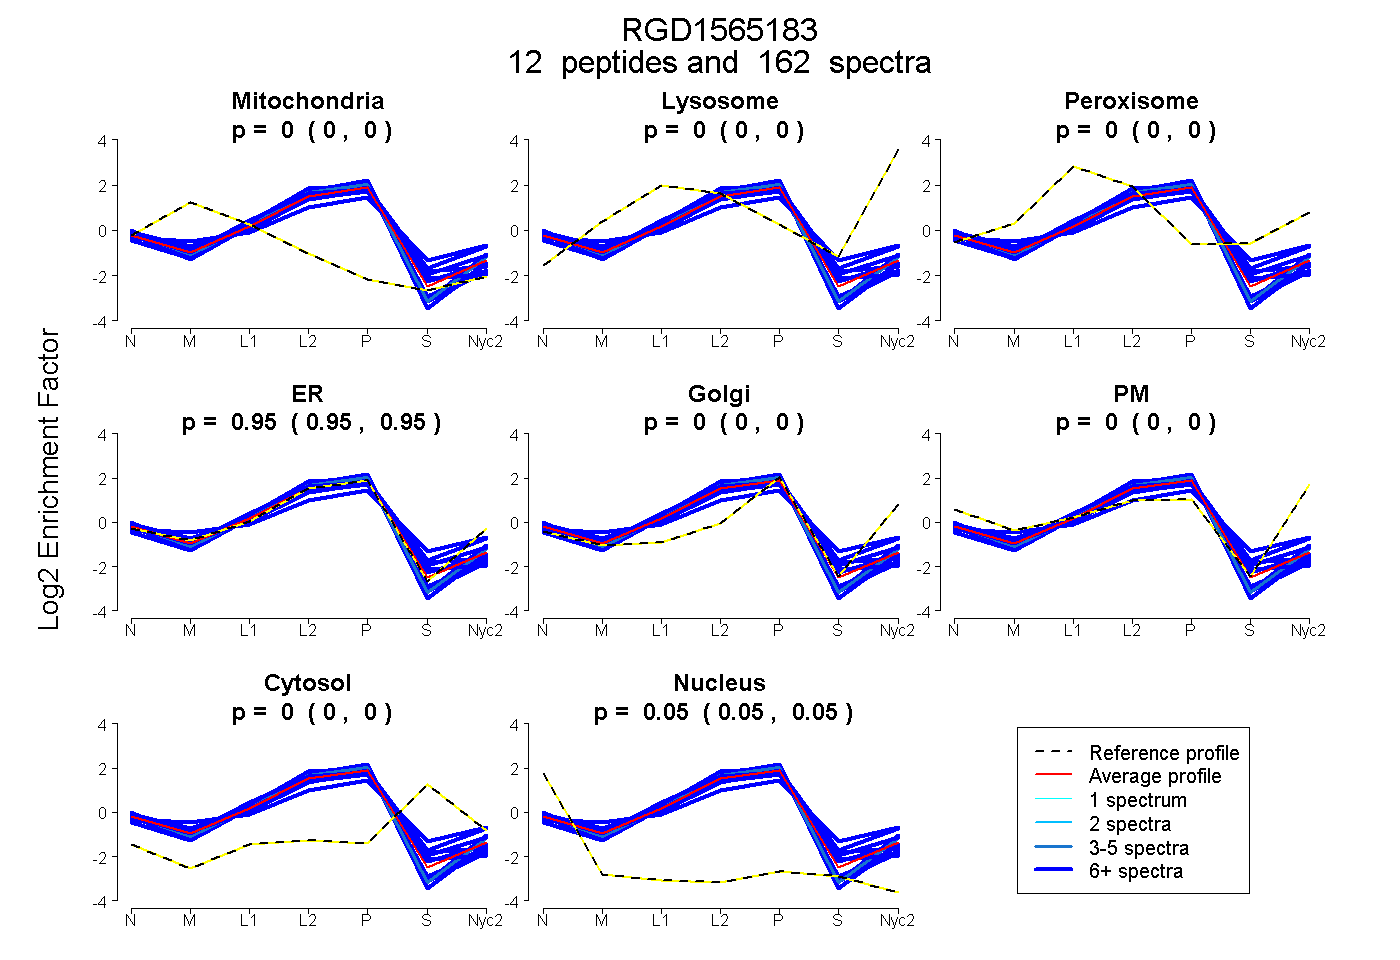
0.000 | 0.002
0.000 | 0.000
0.000 | 0.000
0.945 | 0.948
0.000 | 0.000
0.000 | 0.000
0.000 | 0.000
0.052 | 0.054
10peptides
spectra
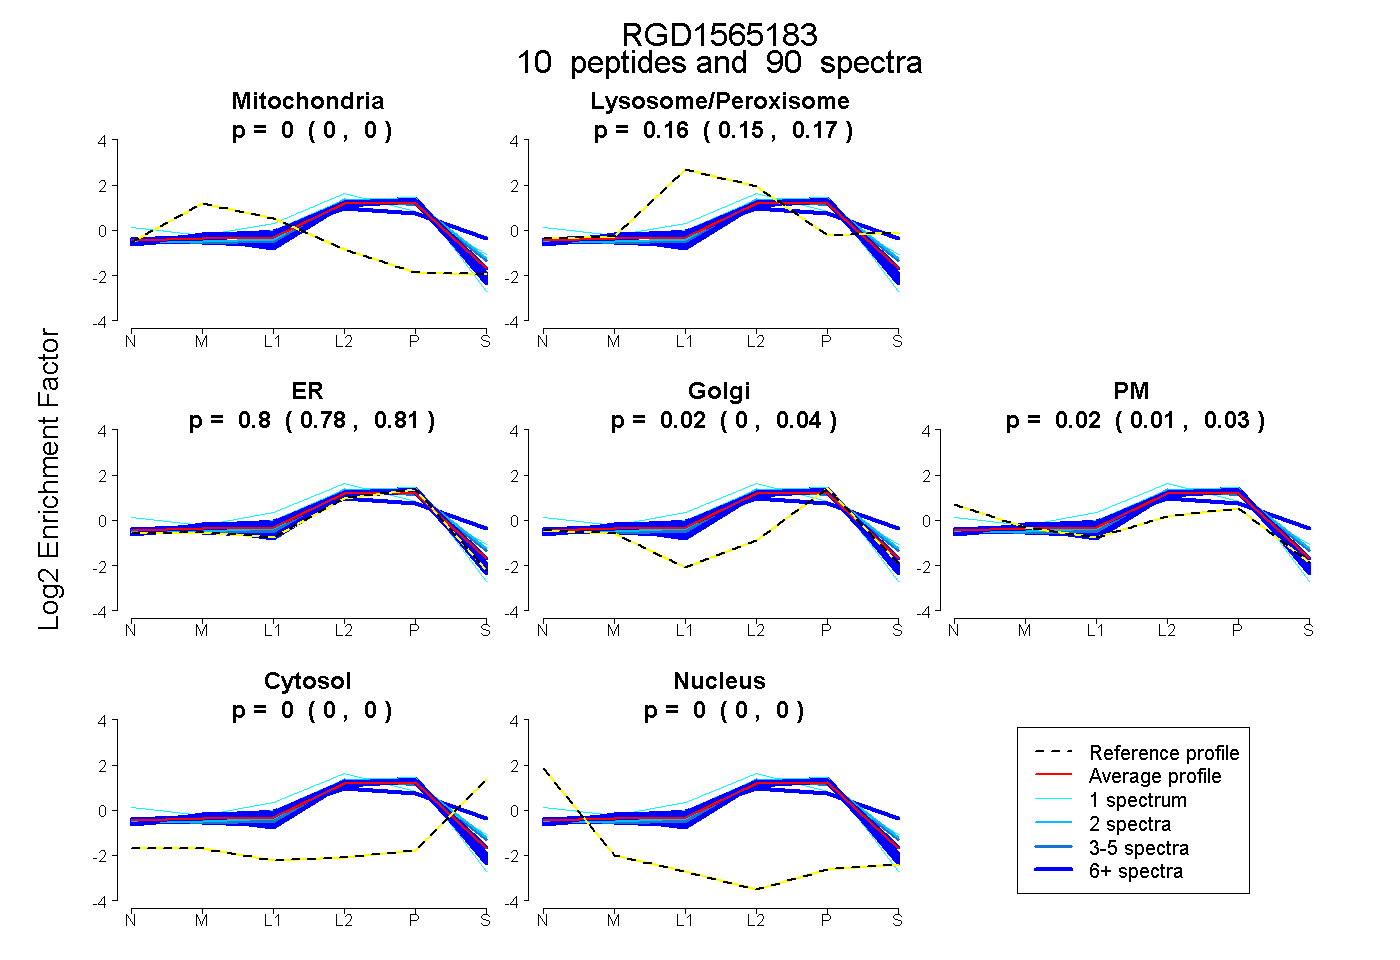
0.000 | 0.000
0.149 | 0.170
0.778 | 0.813
0.002 | 0.038
0.006 | 0.032
0.000 | 0.000
0.000 | 0.000
11peptides
spectra
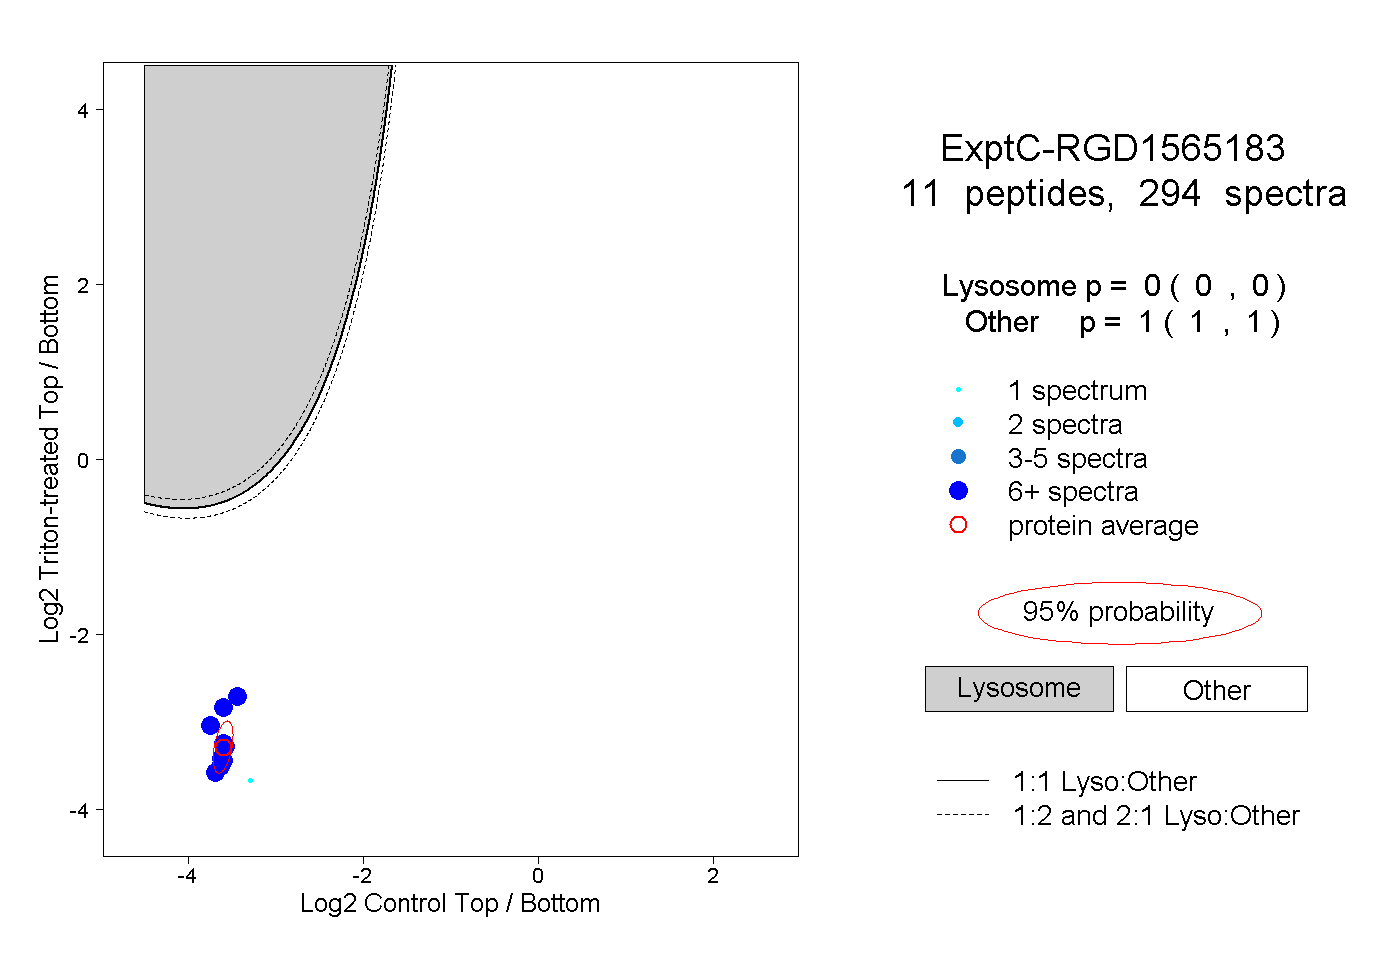
0.000 | 0.000
1.000 | 1.000
7peptides
spectra
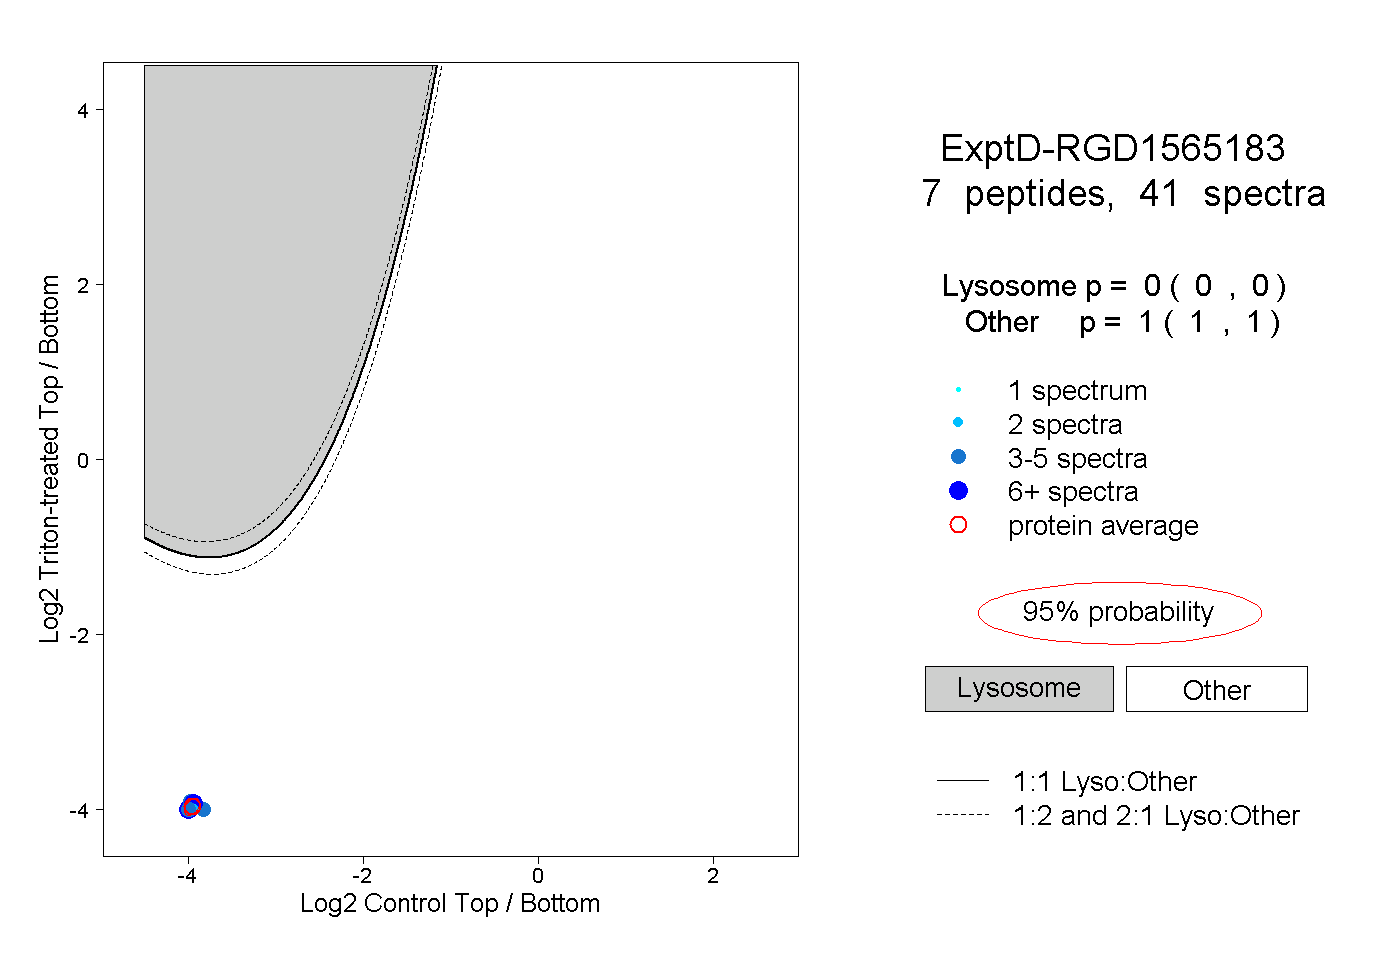
0.000 | 0.000
1.000 | 1.000