 12
12peptides
spectra
0.000 | 0.002
0.000 | 0.000
0.000 | 0.000
0.945 | 0.948
0.000 | 0.000
0.000 | 0.000
0.000 | 0.000
0.052 | 0.054
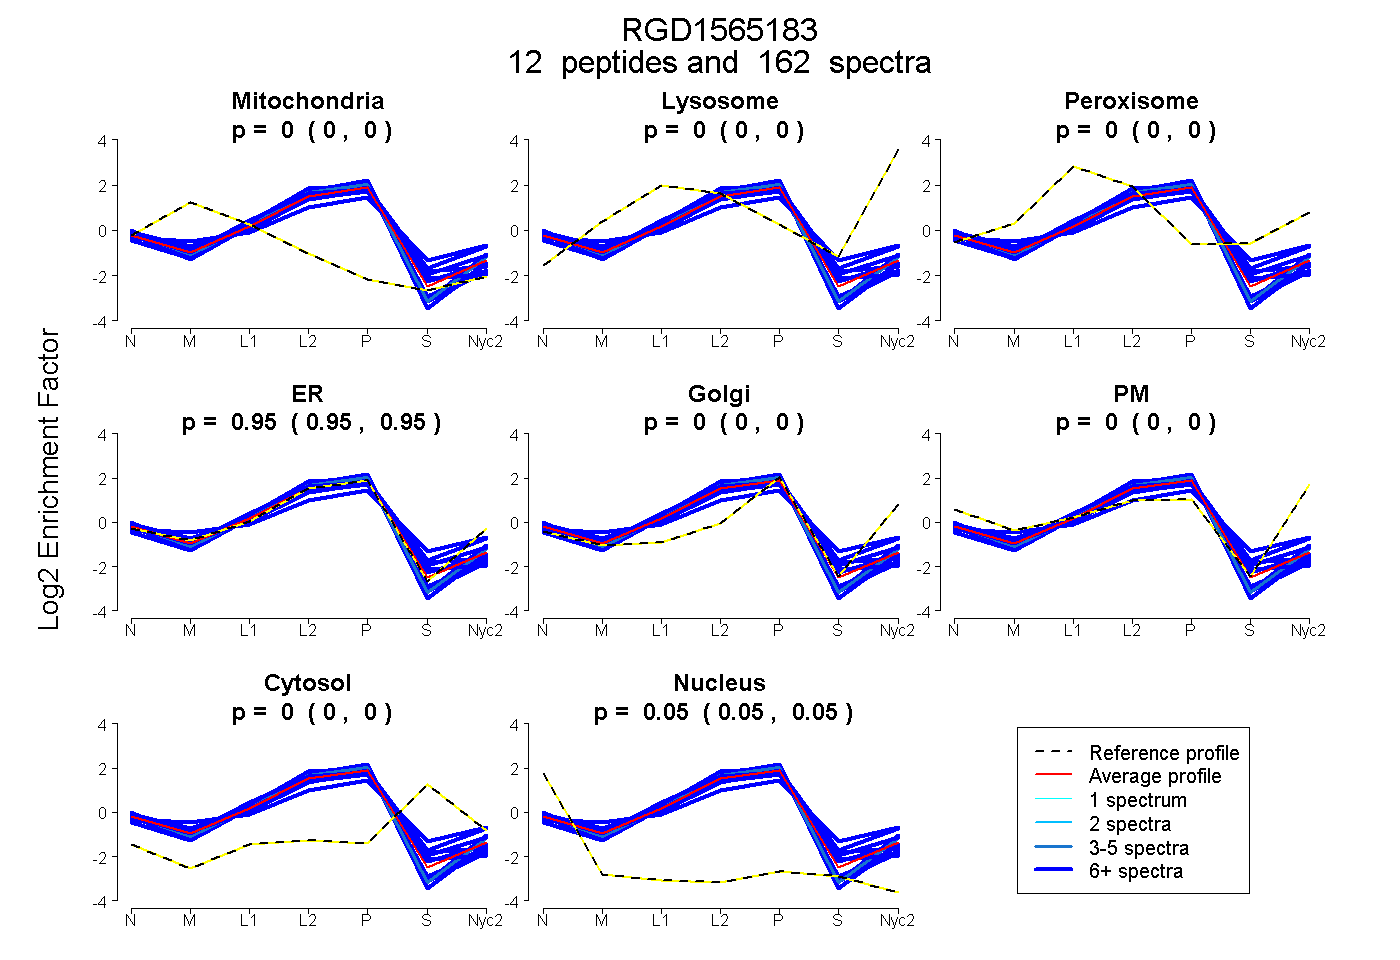
| Plot | Mito | Lyso | Perox | ER | Golgi | PM | Cytosol | Nucleus | |||||
| Expt A |
12 peptides |
162 spectra |
|
0.000 0.000 | 0.002 |
0.000 0.000 | 0.000 |
0.000 0.000 | 0.000 |
0.947 0.945 | 0.948 |
0.000 0.000 | 0.000 |
0.000 0.000 | 0.000 |
0.000 0.000 | 0.000 |
0.053 0.052 | 0.054 |
| 15 spectra, ASALLR | 0.000 | 0.000 | 0.000 | 0.965 | 0.000 | 0.000 | 0.000 | 0.035 | ||
| 4 spectra, SQKPVVVK | 0.000 | 0.000 | 0.000 | 0.964 | 0.000 | 0.000 | 0.000 | 0.036 | ||
| 9 spectra, YRPDLR | 0.000 | 0.000 | 0.019 | 0.871 | 0.000 | 0.000 | 0.110 | 0.000 | ||
| 13 spectra, GVVVVMK | 0.016 | 0.000 | 0.000 | 0.927 | 0.000 | 0.000 | 0.000 | 0.057 | ||
| 8 spectra, NCSSFLIK | 0.028 | 0.000 | 0.000 | 0.860 | 0.000 | 0.000 | 0.081 | 0.032 | ||
| 20 spectra, SAHLQWMVVR | 0.029 | 0.000 | 0.068 | 0.729 | 0.000 | 0.000 | 0.173 | 0.000 | ||
| 12 spectra, YNGLIHR | 0.032 | 0.000 | 0.031 | 0.863 | 0.000 | 0.000 | 0.055 | 0.020 | ||
| 6 spectra, TVGVEPAADGK | 0.027 | 0.000 | 0.021 | 0.891 | 0.000 | 0.000 | 0.000 | 0.061 | ||
| 35 spectra, ATLSSIR | 0.000 | 0.000 | 0.000 | 0.951 | 0.000 | 0.000 | 0.000 | 0.049 | ||
| 26 spectra, KPATSYVR | 0.000 | 0.000 | 0.000 | 0.931 | 0.000 | 0.000 | 0.013 | 0.056 | ||
| 7 spectra, MAALR | 0.000 | 0.000 | 0.000 | 0.988 | 0.000 | 0.000 | 0.000 | 0.012 | ||
| 7 spectra, QTYSTEPNNLK | 0.000 | 0.000 | 0.000 | 0.946 | 0.000 | 0.000 | 0.000 | 0.054 |
| Plot | Mito | Lyso or Perox | ER | Golgi | PM | Cytosol | Nucleus | ||||||
| Expt B |
10 peptides |
90 spectra |
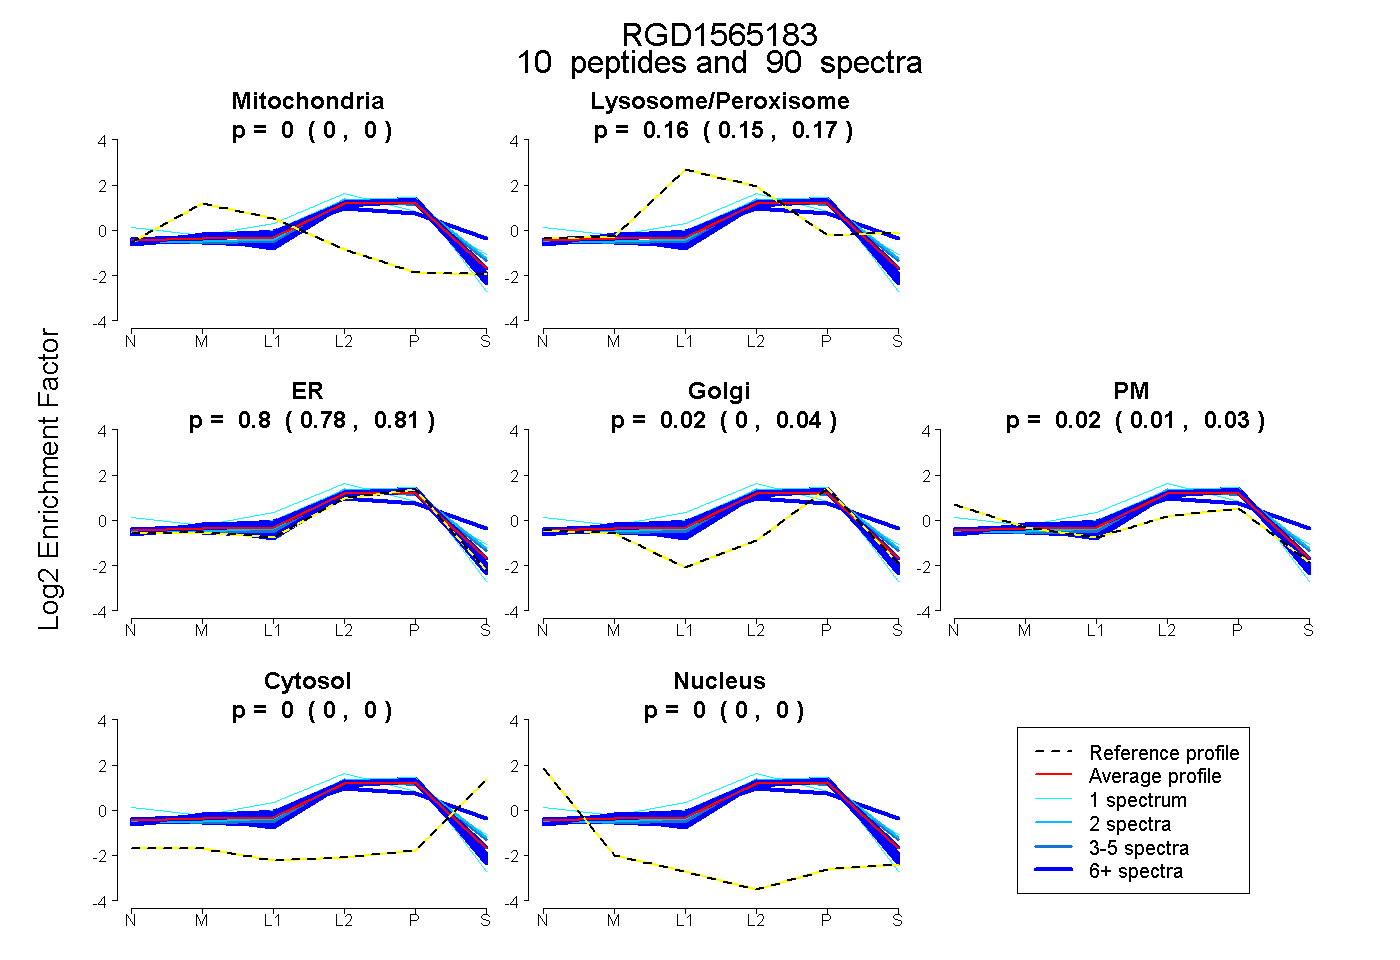 |
0.000 0.000 | 0.000 |
0.161 0.149 | 0.170 |
0.797 0.778 | 0.813 |
0.021 0.002 | 0.038 |
0.021 0.006 | 0.032 |
0.000 0.000 | 0.000 |
0.000 0.000 | 0.000 |
|||
| Plot | Lyso | Other | |||||||||||
| Expt C |
11 peptides |
294 spectra |
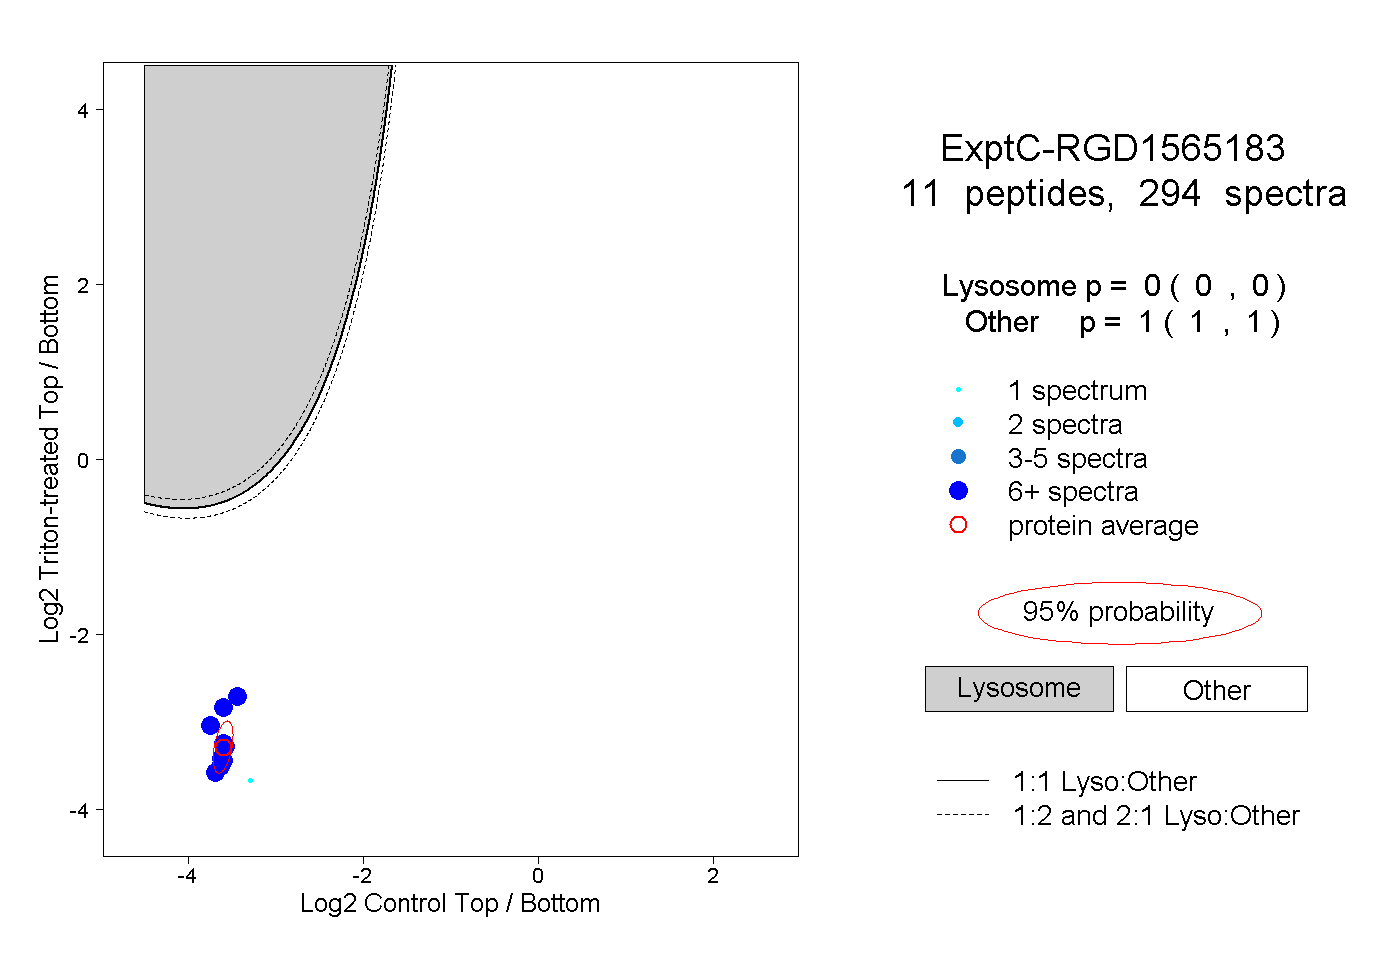 |
0.000 0.000 | 0.000 |
1.000 1.000 | 1.000 |
||||||||
| Plot | Lyso | Other | |||||||||||
| Expt D |
7 peptides |
41 spectra |
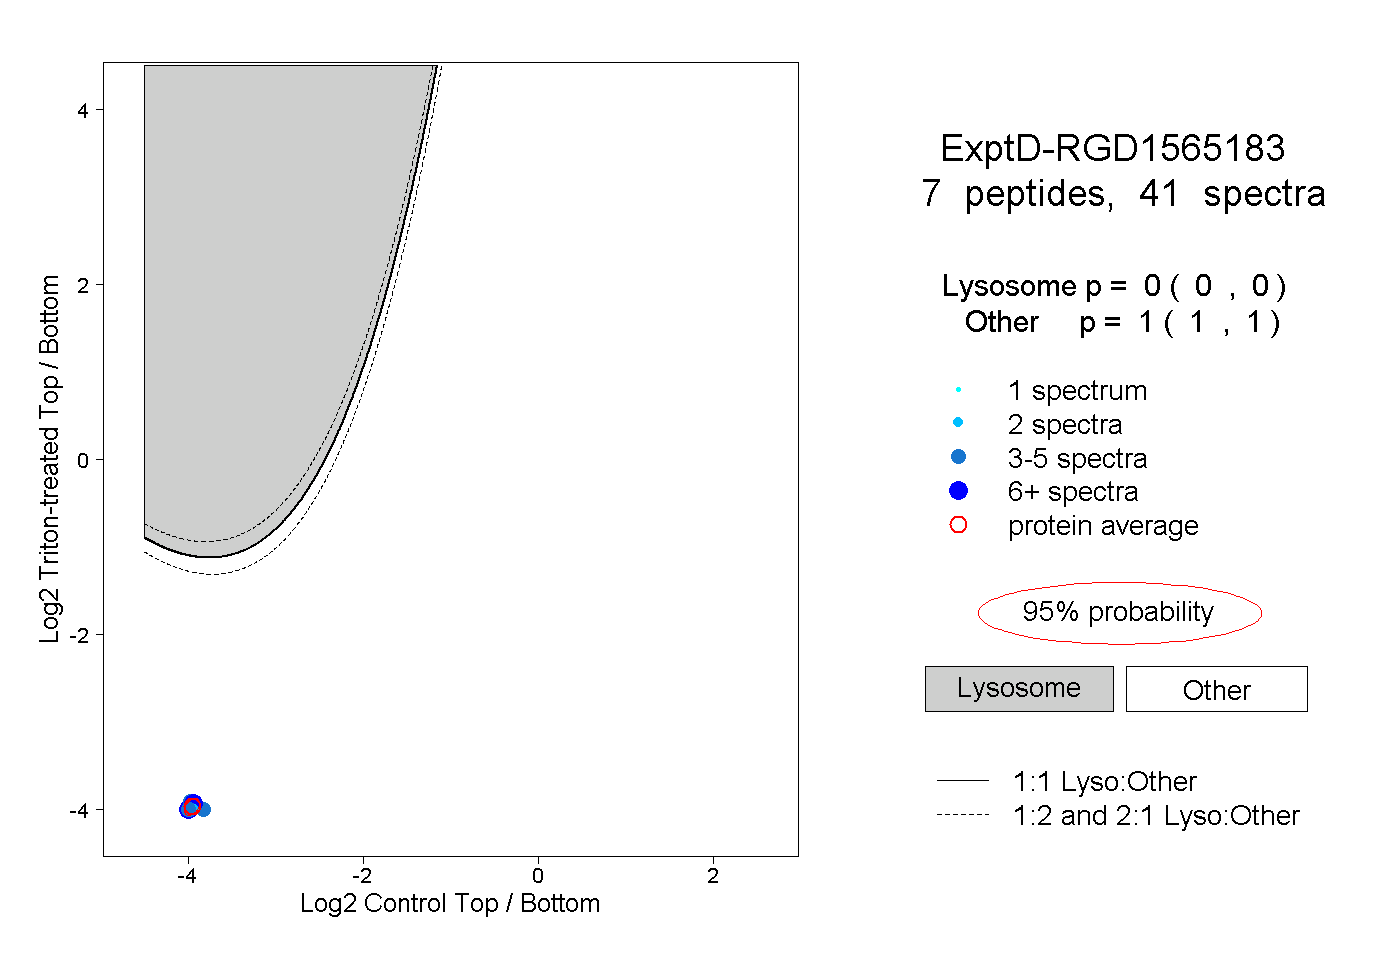 |
0.000 0.000 | 0.000 |
1.000 1.000 | 1.000 |