RGD1565183
[ENSRNOP00000055726]
Main page
| | | Plot |
Mito |
Lyso |
|
Perox |
ER |
Golgi |
PM |
Cytosol |
Nucleus |
|
| Expt A |
 12
12
peptides |
162
spectra |
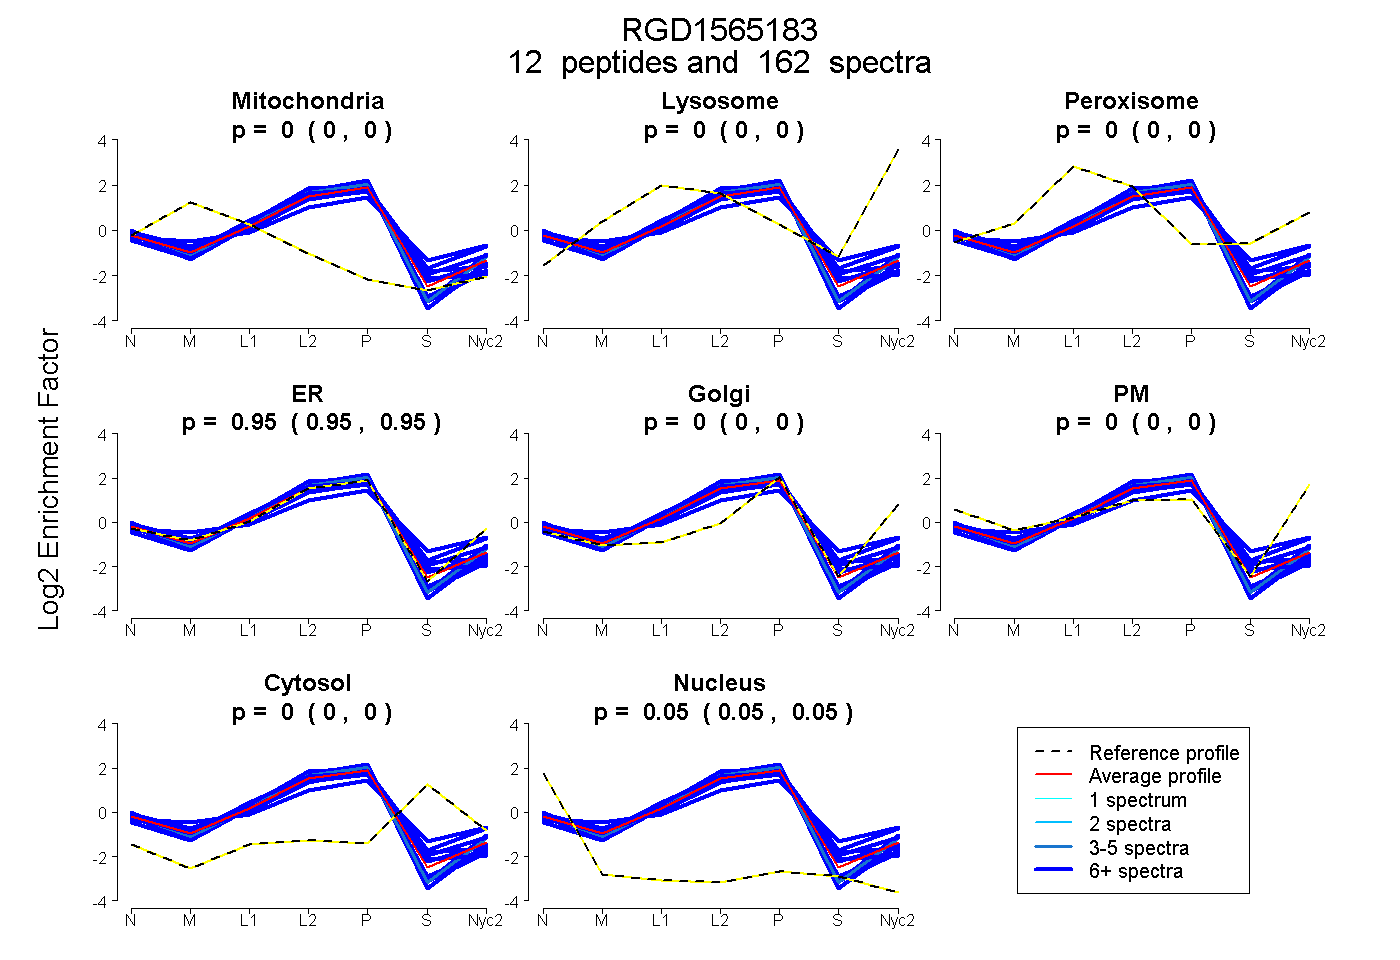 |
0.000
0.000 | 0.002 |
0.000
0.000 | 0.000 |
|
0.000
0.000 | 0.000 |
0.947
0.945 | 0.948 |
0.000
0.000 | 0.000 |
0.000
0.000 | 0.000 |
0.000
0.000 | 0.000 |
0.053
0.052 | 0.054 |
|
| | | Plot |
Mito |
|
Lyso or Perox |
|
ER |
Golgi |
PM |
Cytosol |
Nucleus |
|
| Expt B |
10
peptides |
90
spectra |
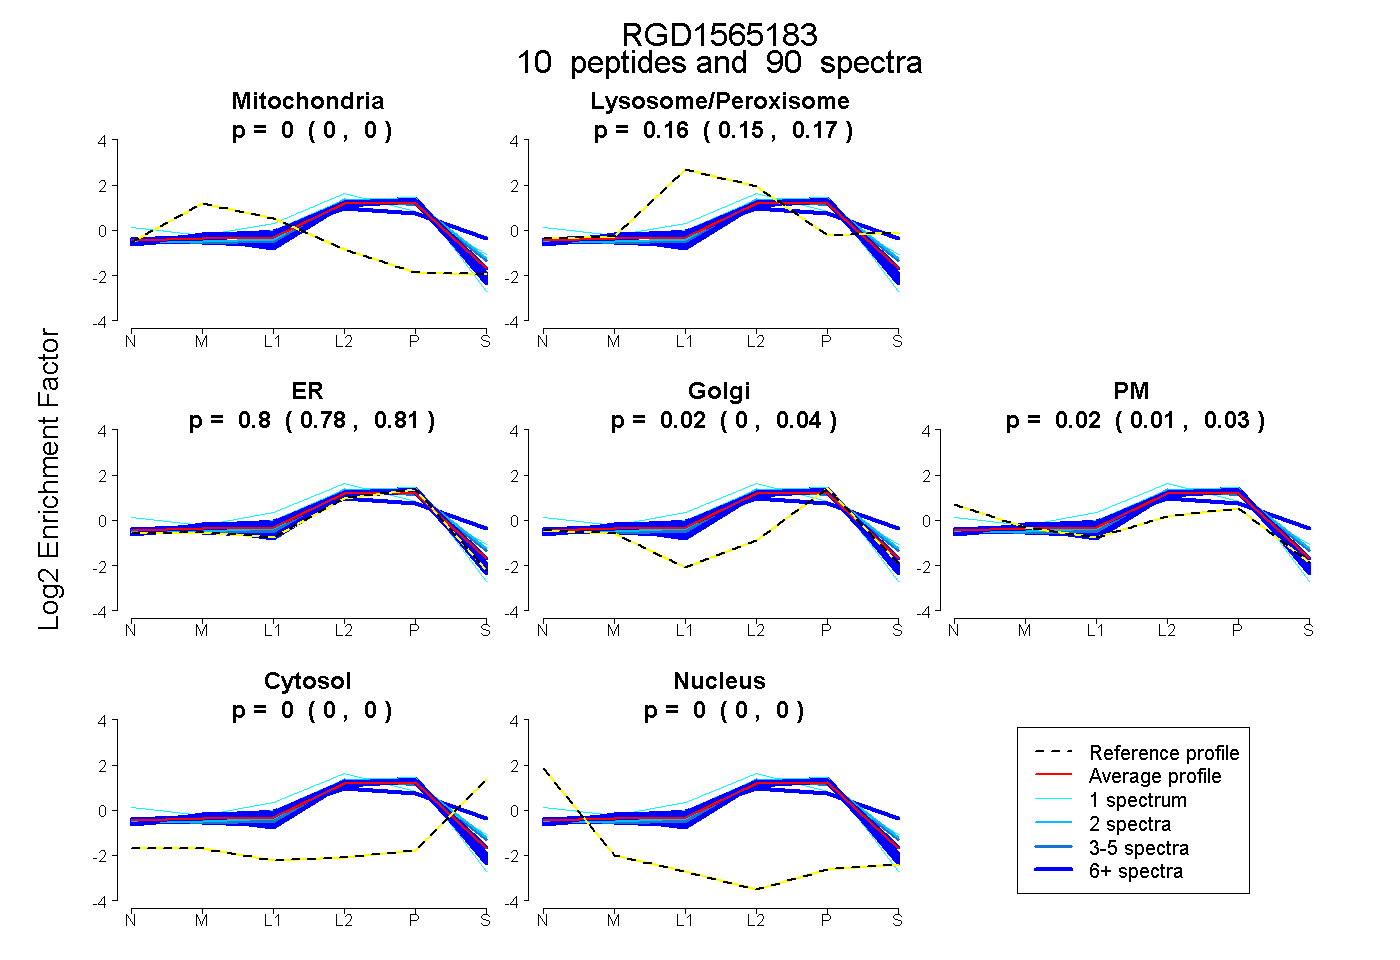 |
0.000
0.000 | 0.000 |
|
0.161
0.149 | 0.170 |
|
0.797
0.778 | 0.813 |
0.021
0.002 | 0.038 |
0.021
0.006 | 0.032 |
0.000
0.000 | 0.000 |
0.000
0.000 | 0.000 |
|
| | | Plot |
|
Lyso |
|
|
|
|
|
|
|
Other |
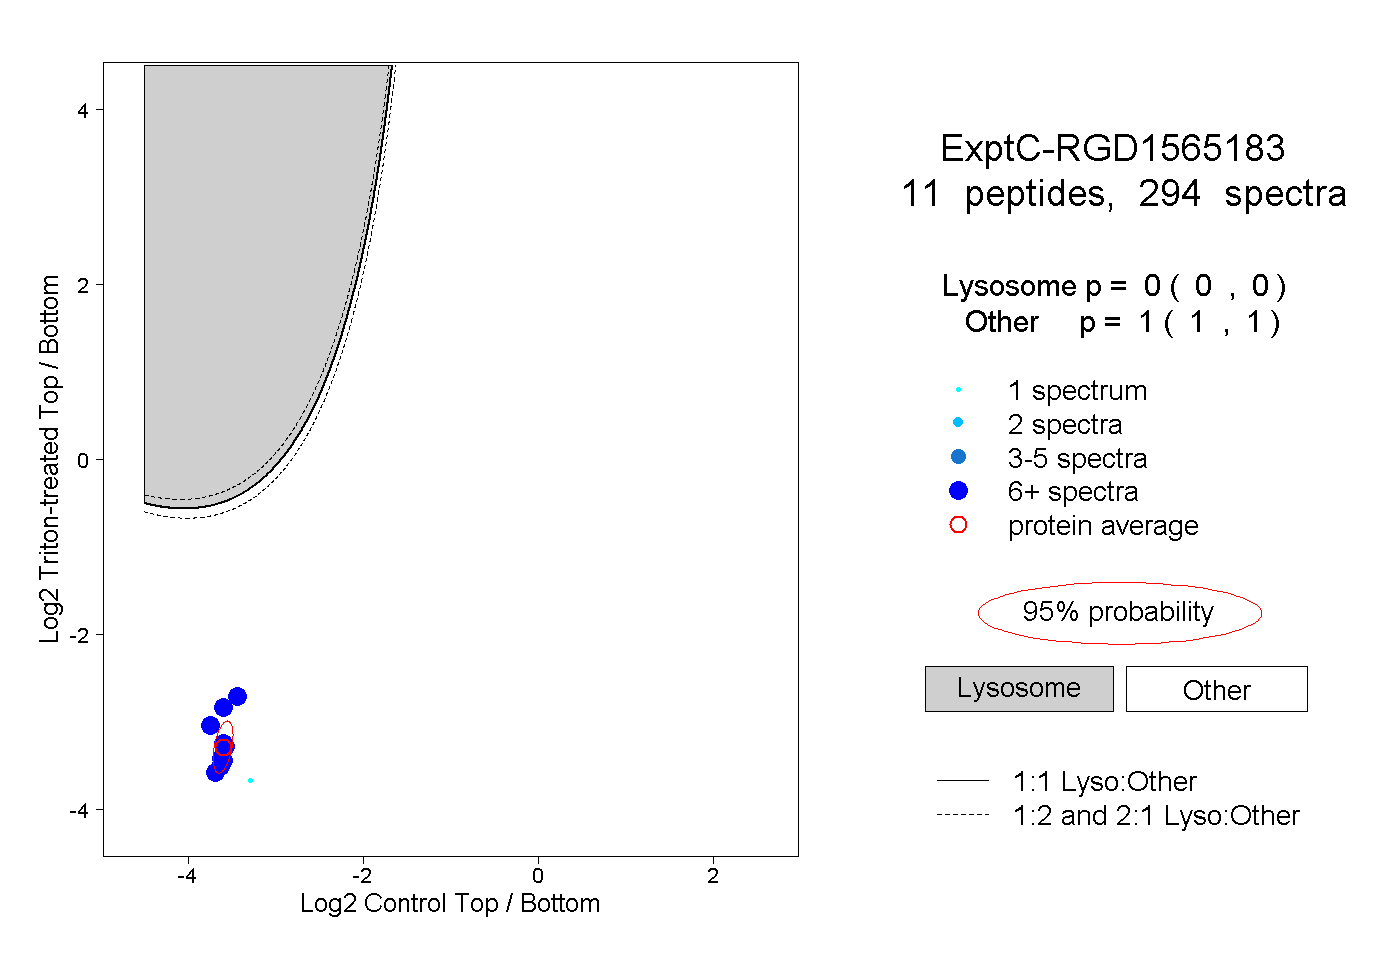
| Expt C |
11
peptides |
294
spectra |
 |
|
0.000
0.000 | 0.000 |
|
|
|
|
|
|
|
1.000
1.000 | 1.000 |
| 1 spectrum, ASALLR |
|
0.000 |
|
|
|
|
|
|
|
1.000 |
| 36 spectra, SQKPVVVK |
|
0.000 |
|
|
|
|
|
|
|
1.000 |
| 24 spectra, YRPDLR |
|
0.000 |
|
|
|
|
|
|
|
1.000 |
| 71 spectra, GVVVVMK |
|
0.000 |
|
|
|
|
|
|
|
1.000 |
| 11 spectra, NCSSFLIK |
|
0.000 |
|
|
|
|
|
|
|
1.000 |
| 1 spectrum, SAHLQWMVVR |
|
0.000 |
|
|
|
|
|
|
|
1.000 |
| 16 spectra, YNGLIHR |
|
0.000 |
|
|
|
|
|
|
|
1.000 |
| 47 spectra, TVGVEPAADGK |
|
0.000 |
|
|
|
|
|
|
|
1.000 |
| 37 spectra, ATLSSIR |
|
0.000 |
|
|
|
|
|
|
|
1.000 |
| 30 spectra, KPATSYVR |
|
0.000 |
|
|
|
|
|
|
|
1.000 |
| 20 spectra, QTYSTEPNNLK |
|
0.000 |
|
|
|
|
|
|
|
1.000 |
| | | Plot |
|
Lyso |
|
|
|
|
|
|
|
Other |
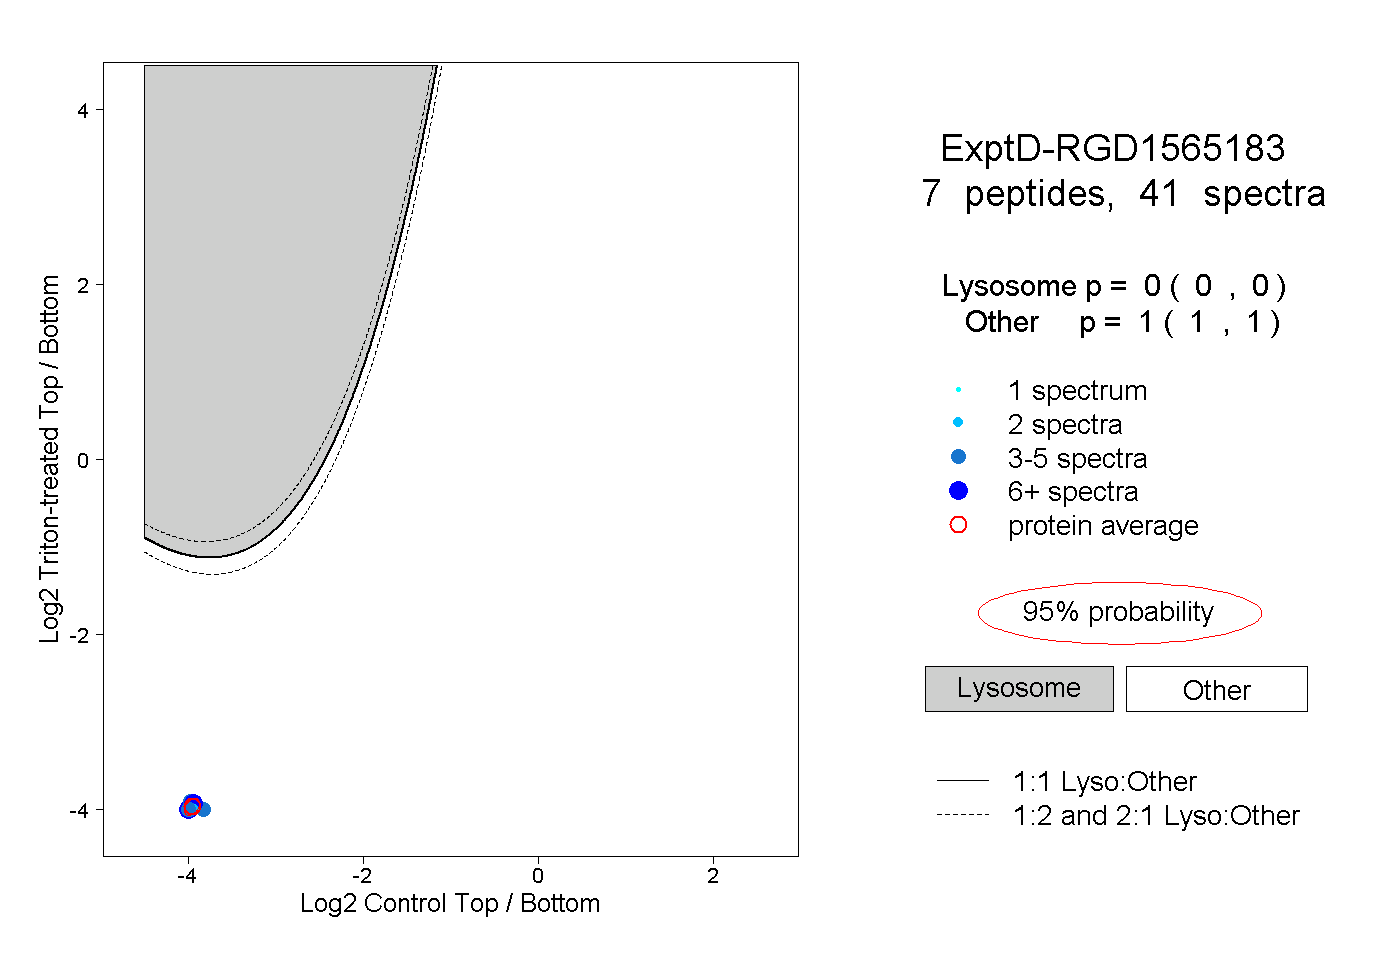
| Expt D |
7
peptides |
41
spectra |
 |
|
0.000
0.000 | 0.000 |
|
|
|
|
|
|
|
1.000
1.000 | 1.000 |