 14
14peptides
spectra
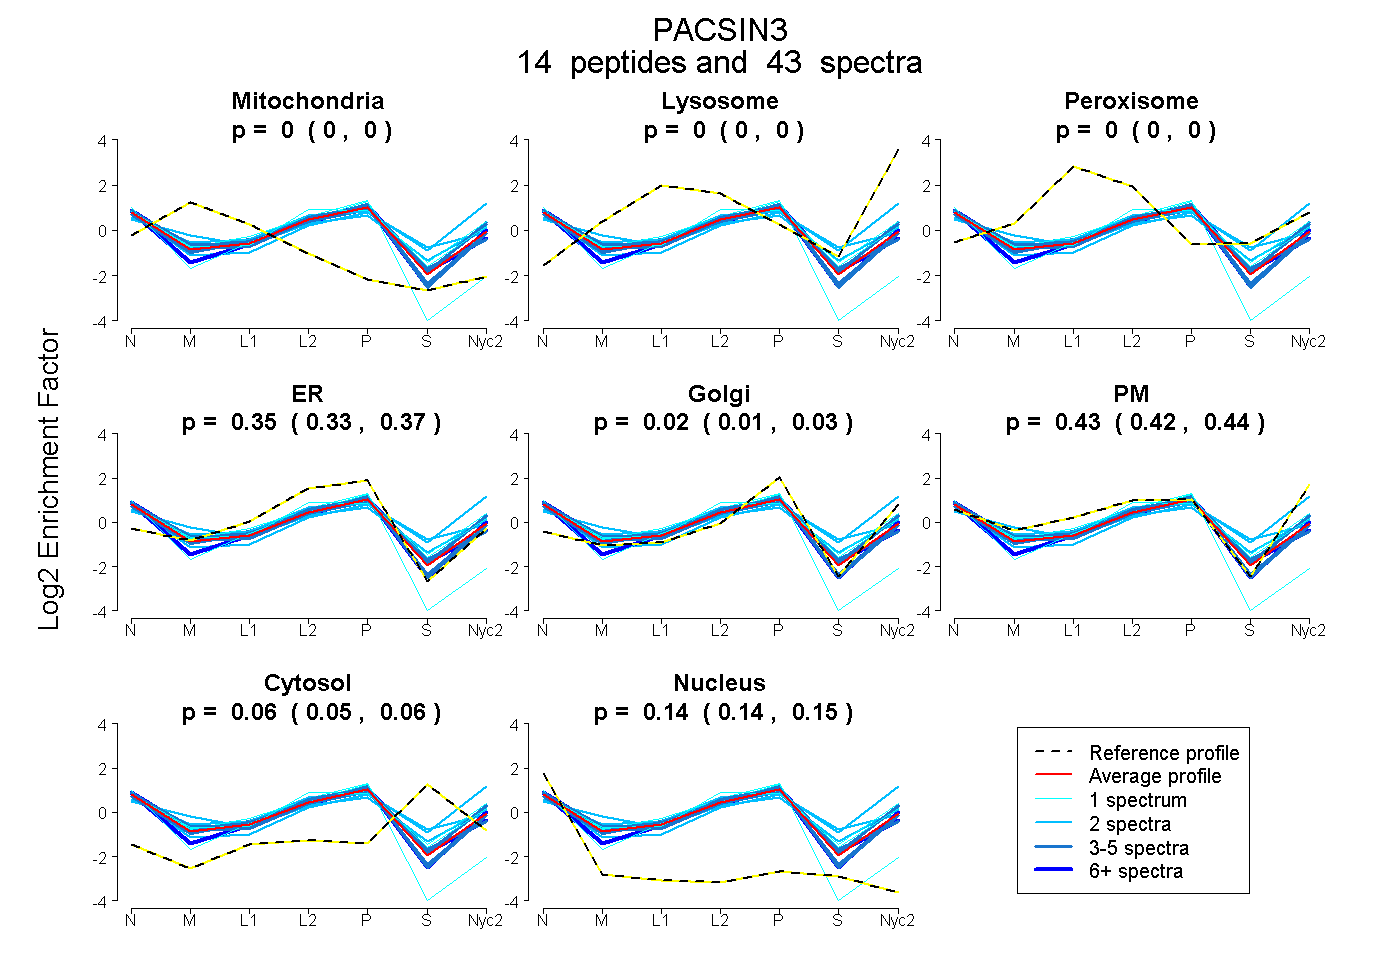
0.000 | 0.000
0.000 | 0.000
0.000 | 0.000
0.330 | 0.367
0.008 | 0.029
0.417 | 0.444
0.048 | 0.065
0.137 | 0.146
6peptides
spectra
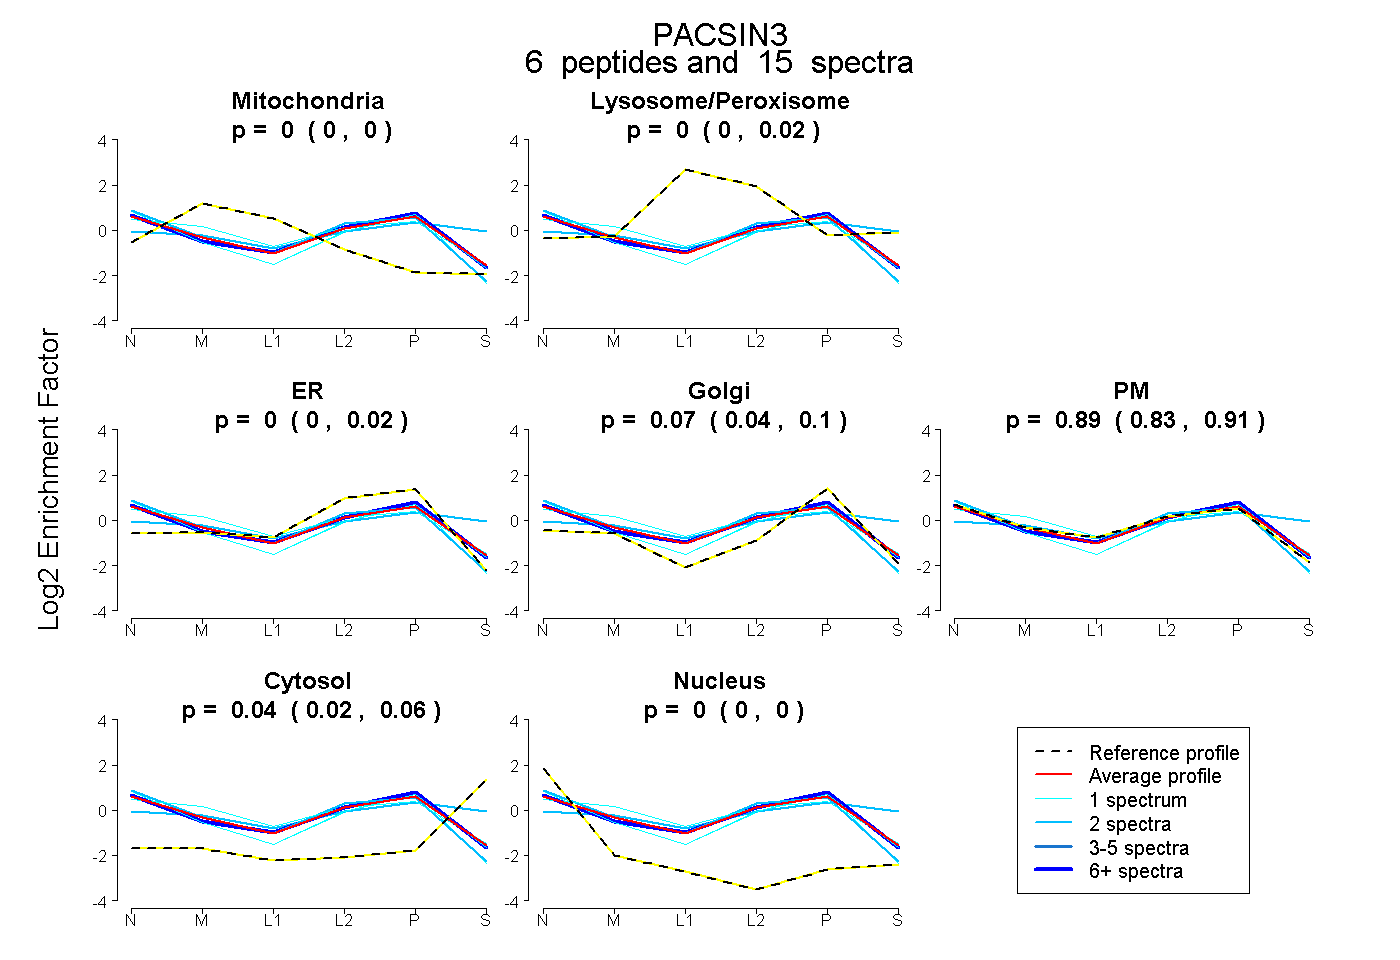
0.000 | 0.000
0.000 | 0.020
0.000 | 0.022
0.037 | 0.095
0.831 | 0.910
0.016 | 0.060
0.000 | 0.000
14peptides
spectra
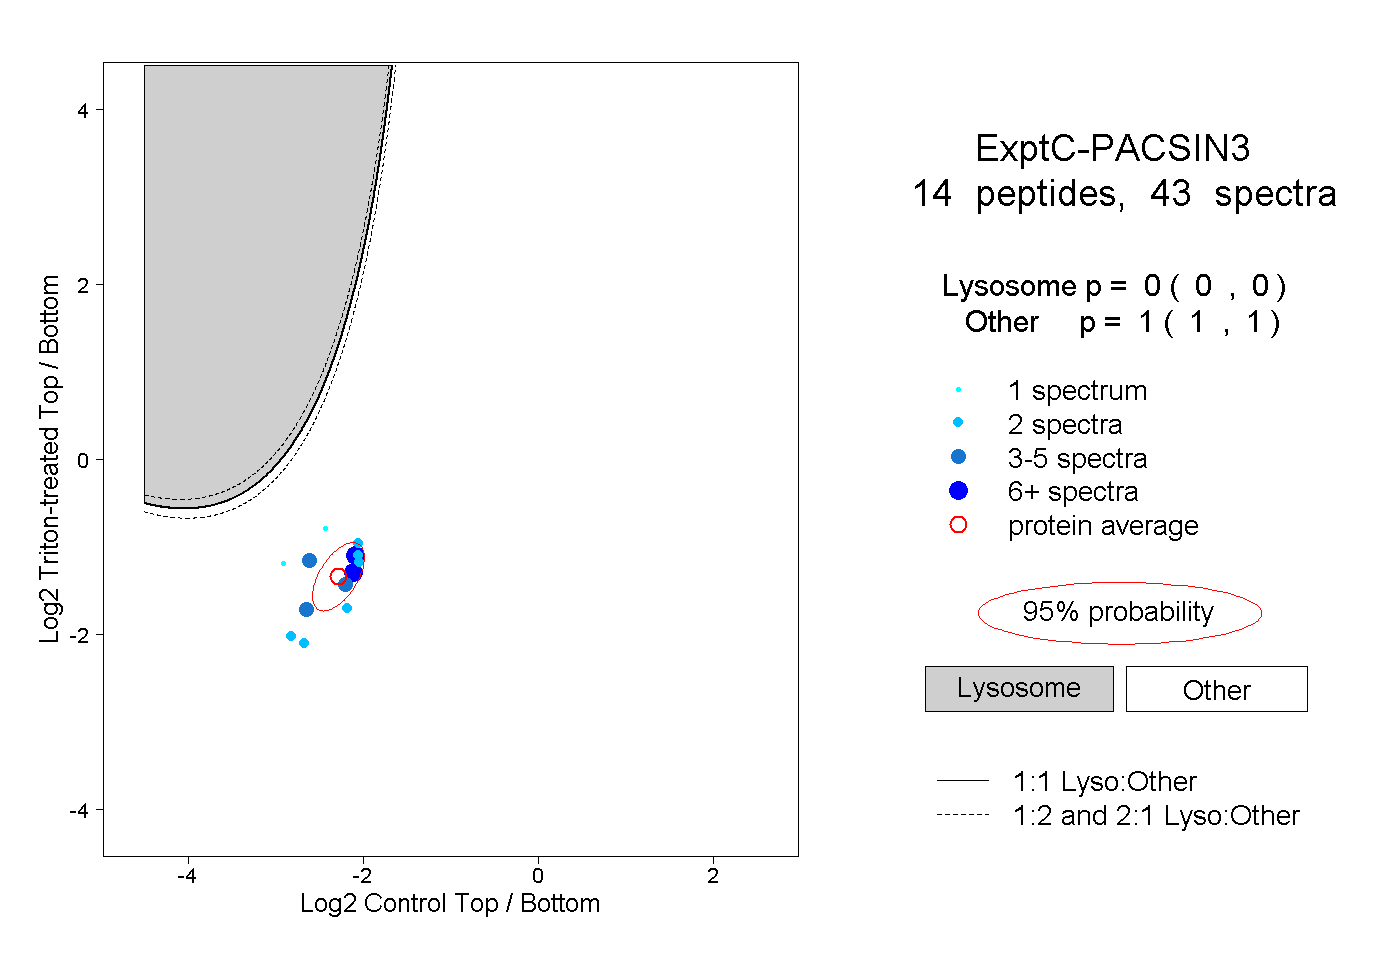
0.000 | 0.000
1.000 | 1.000
5peptides
spectra
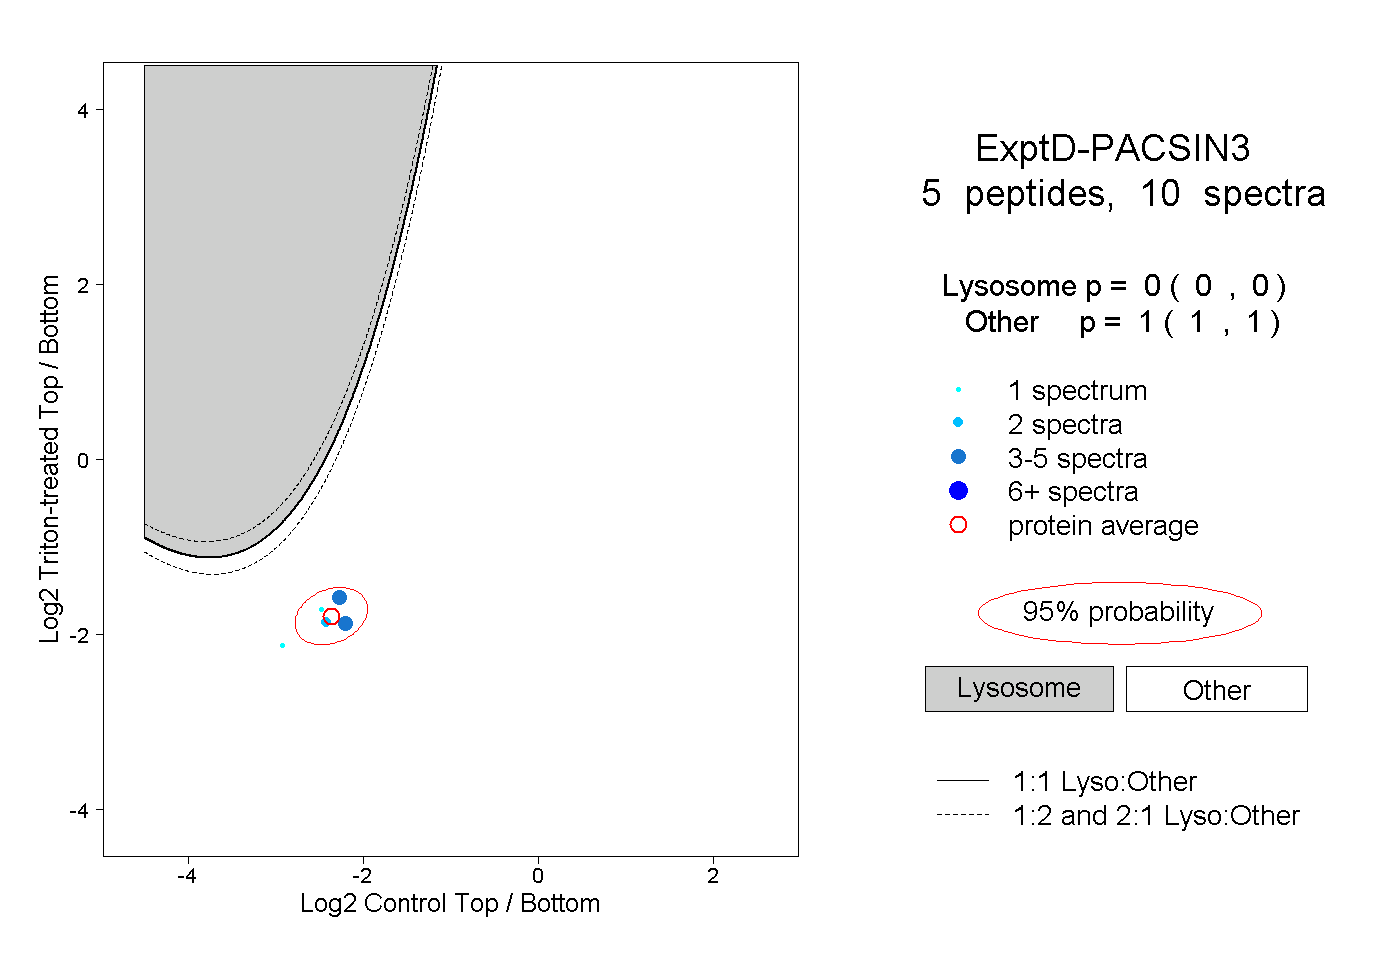
0.000 | 0.000
1.000 | 1.000