PACSIN3
[ENSRNOP00000054003]
Main page
| | | Plot |
Mito |
Lyso |
|
Perox |
ER |
Golgi |
PM |
Cytosol |
Nucleus |
|
| Expt A |
 14
14
peptides |
43
spectra |
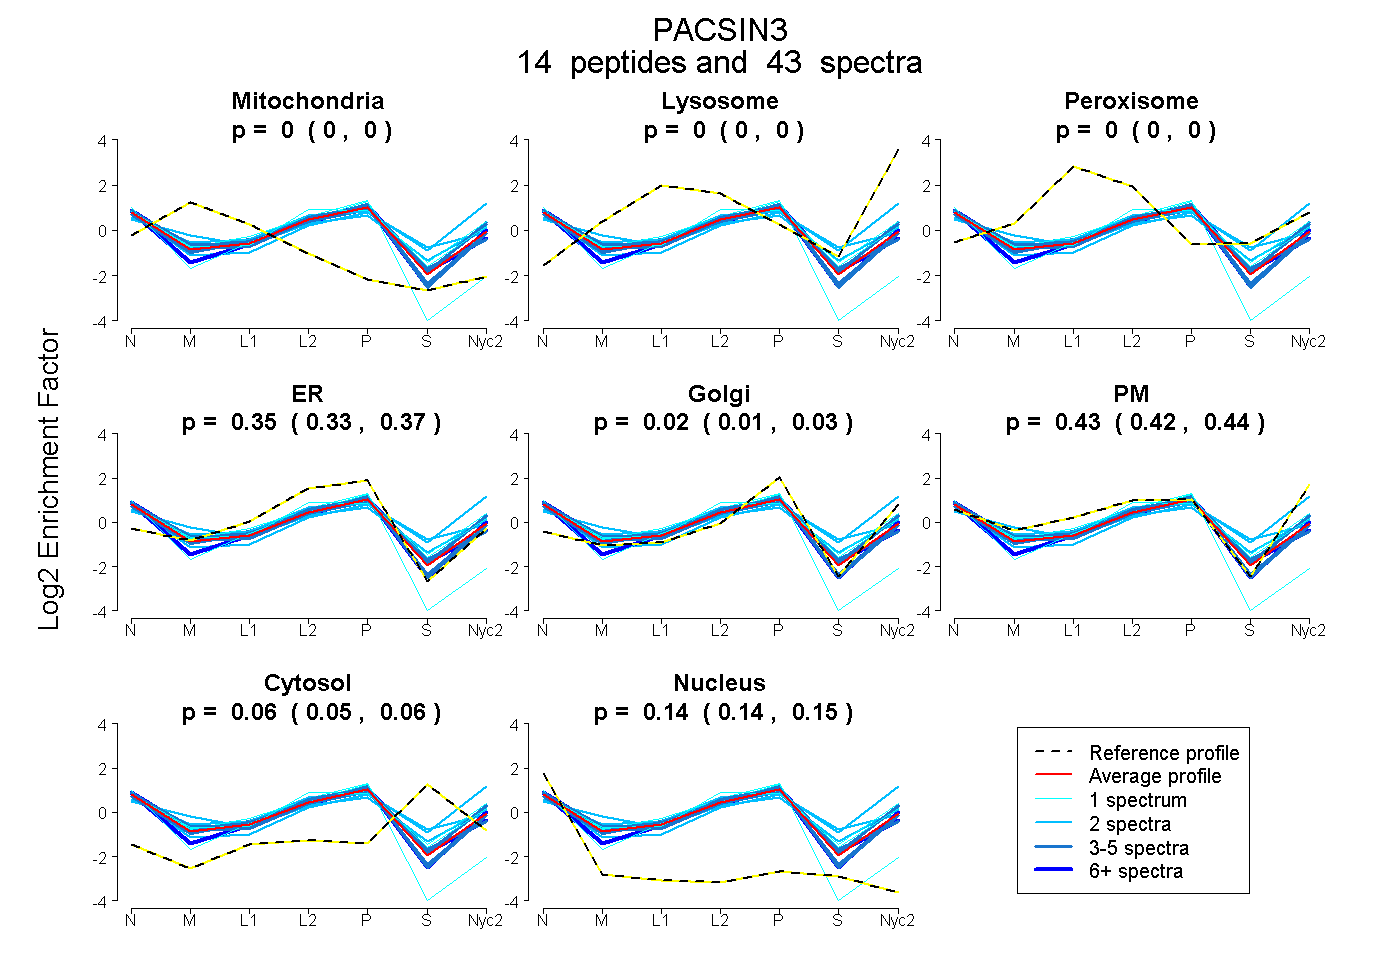 |
0.000
0.000 | 0.000 |
0.000
0.000 | 0.000 |
|
0.000
0.000 | 0.000 |
0.350
0.330 | 0.367 |
0.019
0.008 | 0.029 |
0.432
0.417 | 0.444 |
0.057
0.048 | 0.065 |
0.142
0.137 | 0.146 |
|
| | | Plot |
Mito |
|
Lyso or Perox |
|
ER |
Golgi |
PM |
Cytosol |
Nucleus |
|
| Expt B |
6
peptides |
15
spectra |
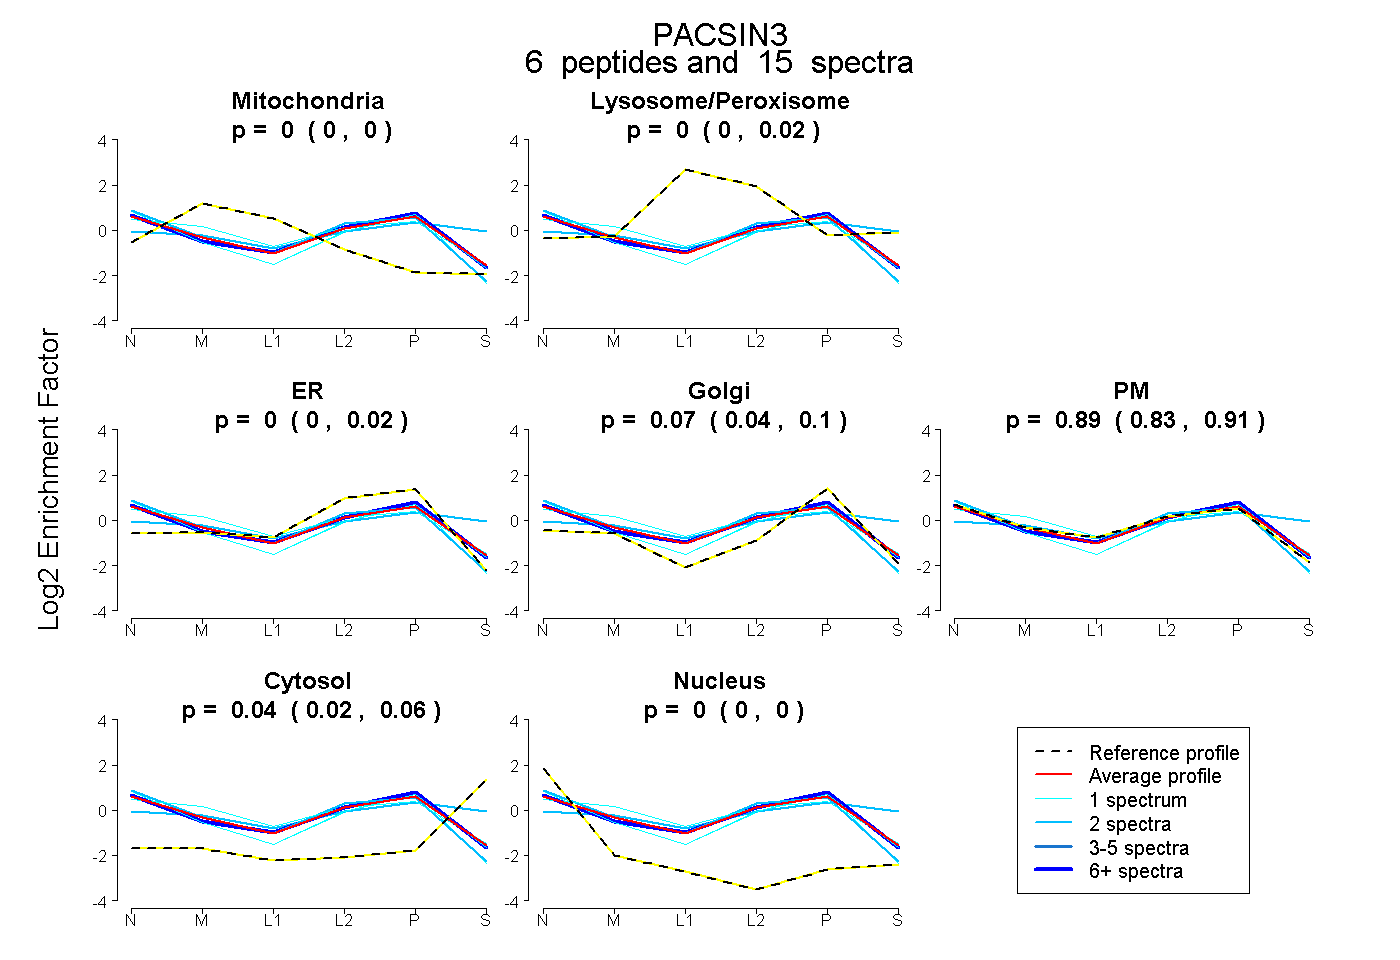 |
0.000
0.000 | 0.000 |
|
0.004
0.000 | 0.020 |
|
0.000
0.000 | 0.022 |
0.069
0.037 | 0.095 |
0.885
0.831 | 0.910 |
0.042
0.016 | 0.060 |
0.000
0.000 | 0.000 |
|
| 1 spectrum, TQYEQTLAELNR |
0.092 |
|
0.056 |
|
0.000 |
0.081 |
0.759 |
0.013 |
0.000 |
|
| 2 spectra, LSELHLEVR |
0.000 |
|
0.000 |
|
0.049 |
0.000 |
0.932 |
0.000 |
0.019 |
|
| 1 spectrum, GPQYGTLEK |
0.000 |
|
0.000 |
|
0.000 |
0.217 |
0.736 |
0.000 |
0.047 |
|
| 2 spectra, AWHAFFTAAER |
0.000 |
|
0.229 |
|
0.000 |
0.190 |
0.342 |
0.239 |
0.000 |
|
| 1 spectrum, AGEELLK |
0.000 |
|
0.000 |
|
0.013 |
0.245 |
0.690 |
0.000 |
0.052 |
|
| 8 spectra, GAFHRPVLGGFR |
0.000 |
|
0.011 |
|
0.010 |
0.121 |
0.849 |
0.009 |
0.000 |
|
| | | Plot |
|
Lyso |
|
|
|
|
|
|
|
Other |
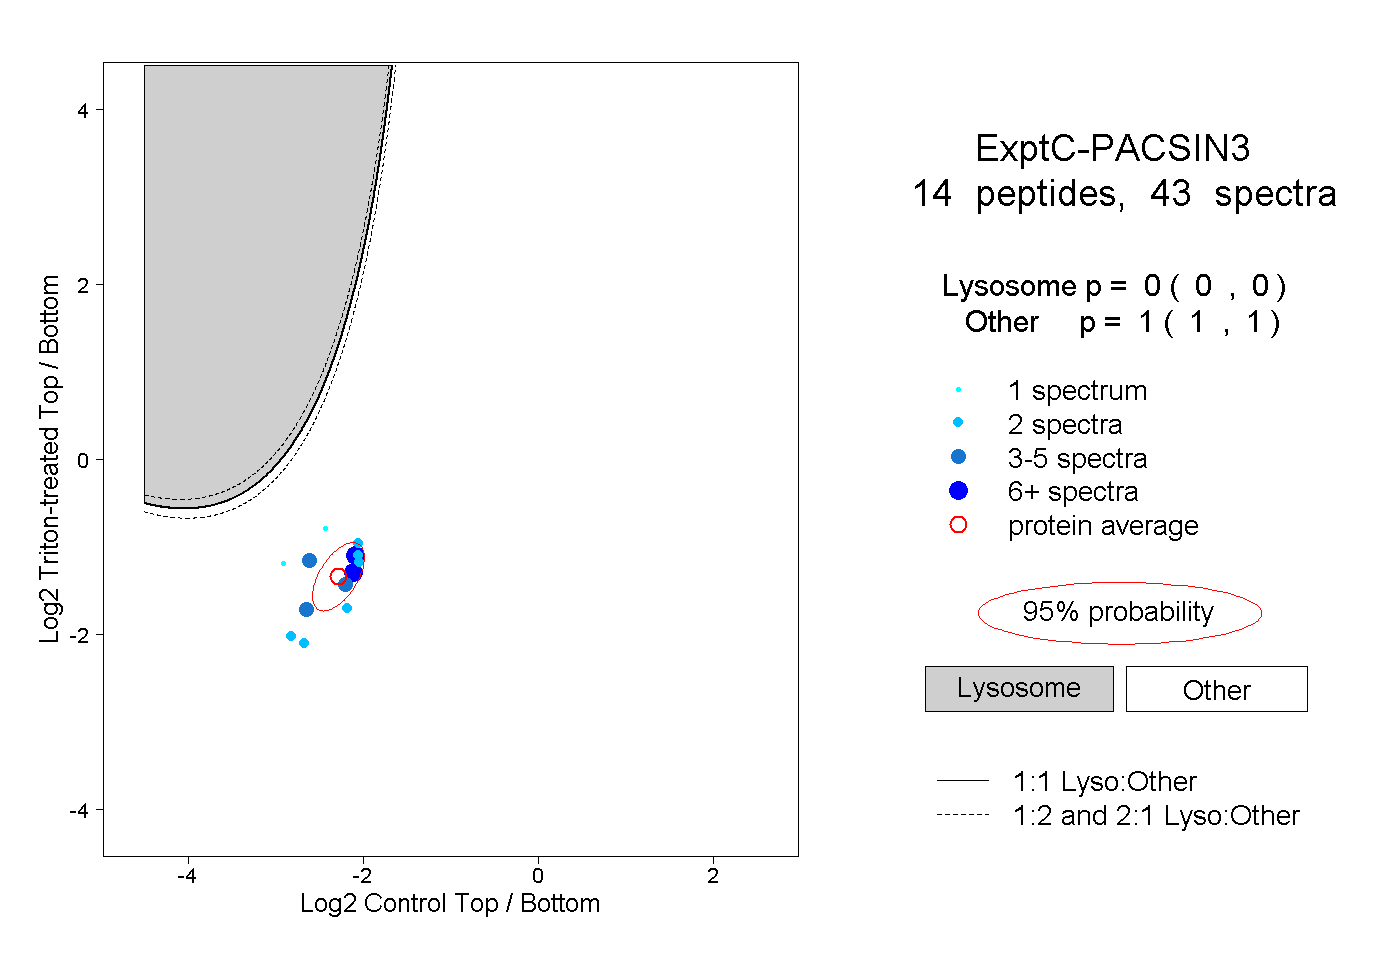
| Expt C |
14
peptides |
43
spectra |
 |
|
0.000
0.000 | 0.000 |
|
|
|
|
|
|
|
1.000
1.000 | 1.000 |
| | | Plot |
|
Lyso |
|
|
|
|
|
|
|
Other |
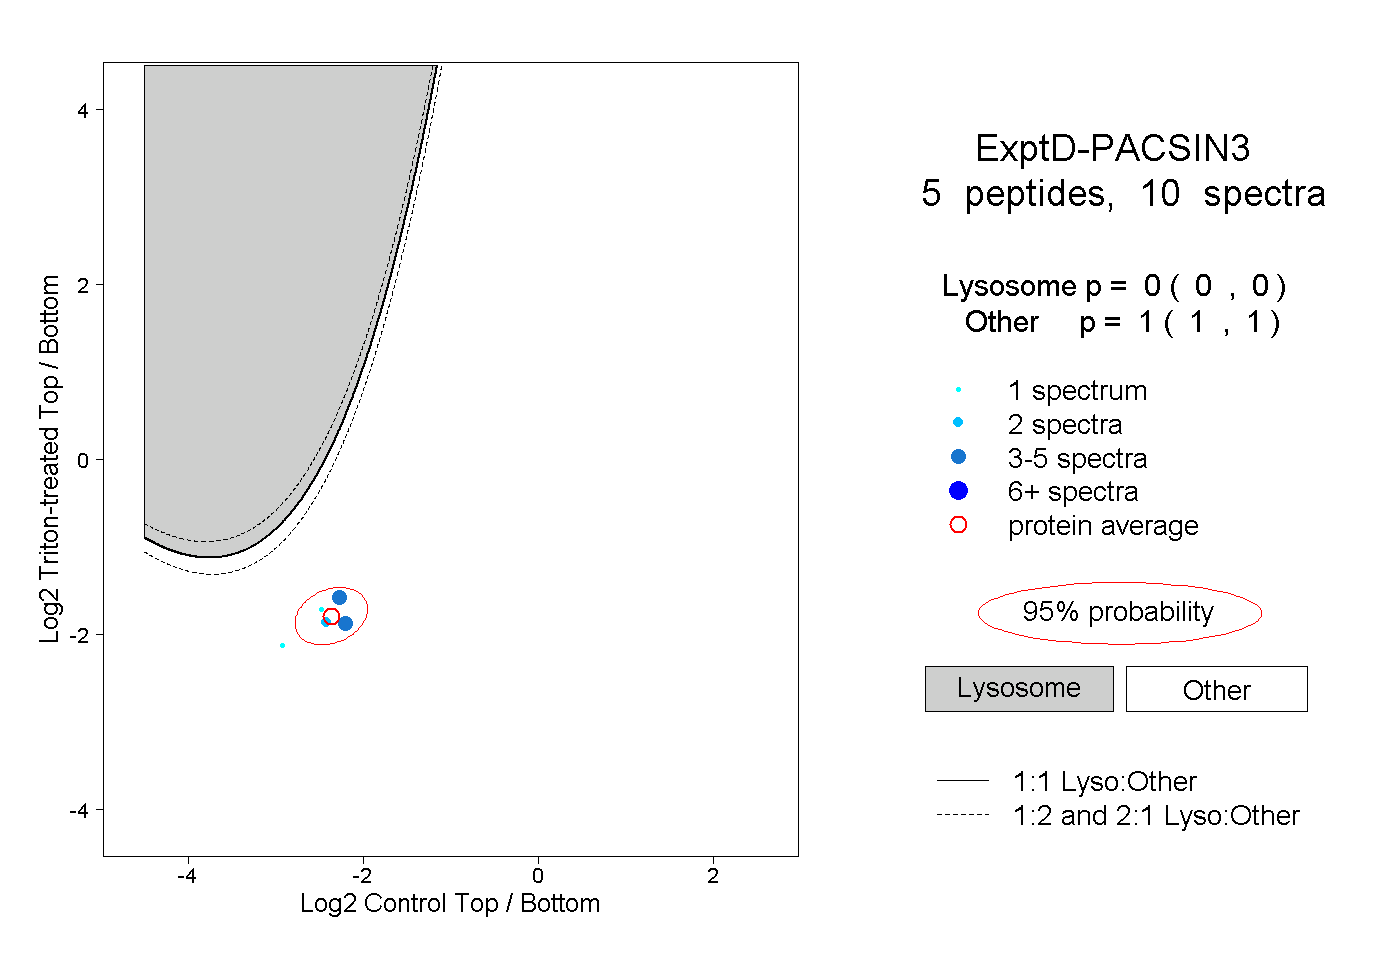
| Expt D |
5
peptides |
10
spectra |
 |
|
0.000
0.000 | 0.000 |
|
|
|
|
|
|
|
1.000
1.000 | 1.000 |