 14
14peptides
spectra
0.000 | 0.000
0.000 | 0.000
0.000 | 0.000
0.330 | 0.367
0.008 | 0.029
0.417 | 0.444
0.048 | 0.065
0.137 | 0.146
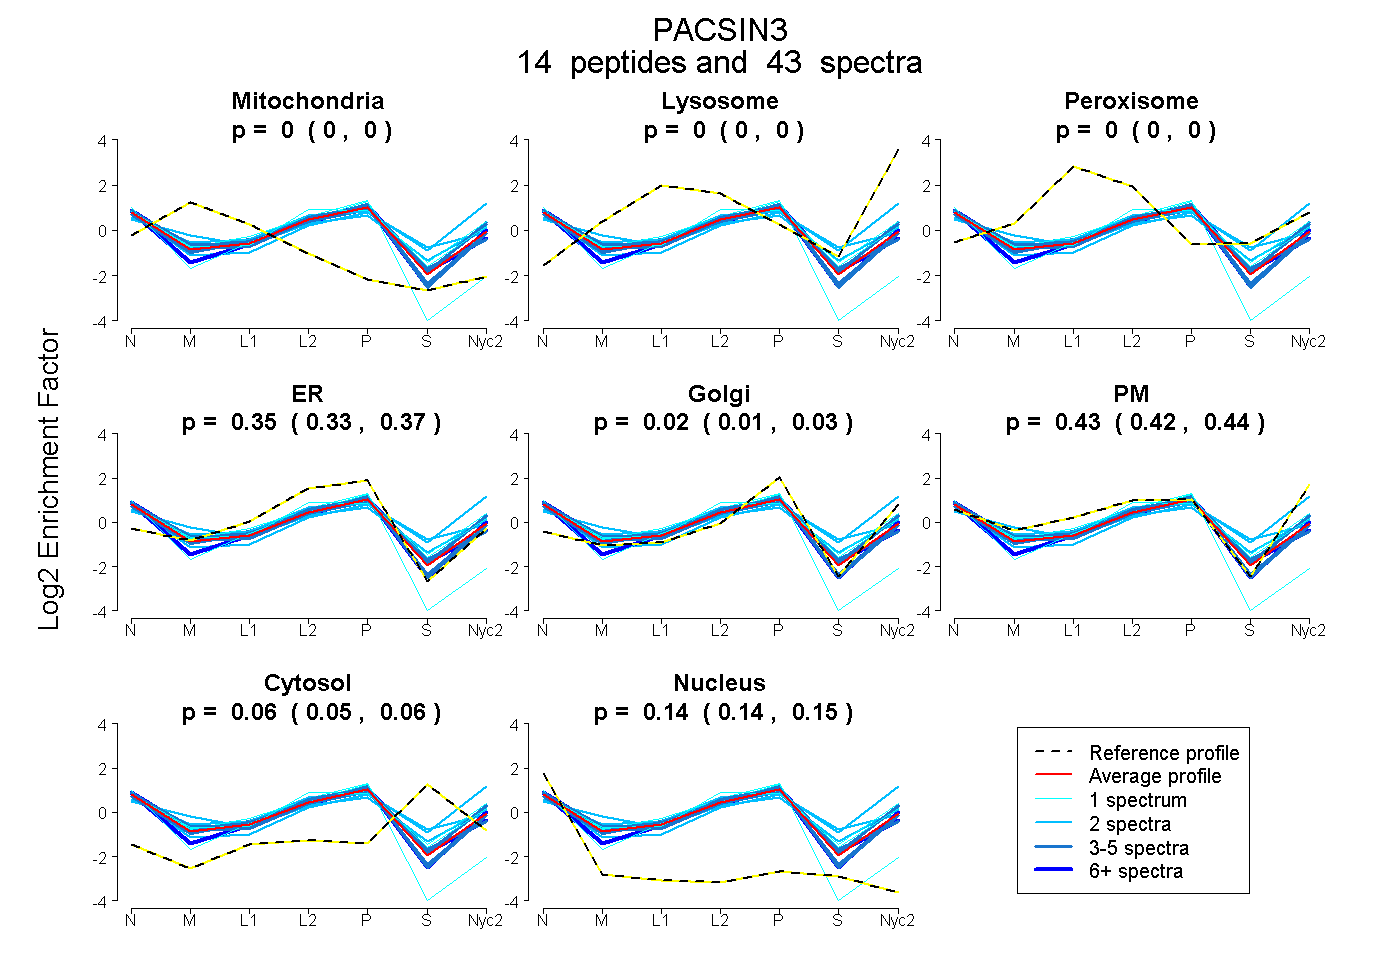
| Plot | Mito | Lyso | Perox | ER | Golgi | PM | Cytosol | Nucleus | |||||
| Expt A |
14 peptides |
43 spectra |
|
0.000 0.000 | 0.000 |
0.000 0.000 | 0.000 |
0.000 0.000 | 0.000 |
0.350 0.330 | 0.367 |
0.019 0.008 | 0.029 |
0.432 0.417 | 0.444 |
0.057 0.048 | 0.065 |
0.142 0.137 | 0.146 |
| 3 spectra, TQYEQTLAELNR | 0.000 | 0.000 | 0.000 | 0.408 | 0.000 | 0.427 | 0.000 | 0.165 | ||
| 4 spectra, LSELHLEVR | 0.000 | 0.000 | 0.000 | 0.461 | 0.000 | 0.298 | 0.112 | 0.130 | ||
| 8 spectra, ADSSMSQEQLR | 0.000 | 0.000 | 0.000 | 0.350 | 0.048 | 0.439 | 0.000 | 0.163 | ||
| 1 spectrum, SPDEVTLTSIVPTR | 0.000 | 0.000 | 0.000 | 0.393 | 0.111 | 0.322 | 0.000 | 0.174 | ||
| 1 spectrum, LCGDLISCFQER | 0.021 | 0.000 | 0.000 | 0.746 | 0.000 | 0.000 | 0.000 | 0.233 | ||
| 4 spectra, AYAQQLADWAR | 0.000 | 0.000 | 0.000 | 0.372 | 0.083 | 0.373 | 0.000 | 0.172 | ||
| 6 spectra, AGEELLK | 0.000 | 0.000 | 0.000 | 0.436 | 0.041 | 0.271 | 0.091 | 0.161 | ||
| 1 spectrum, VEDGHR | 0.000 | 0.000 | 0.000 | 0.222 | 0.000 | 0.574 | 0.147 | 0.057 | ||
| 2 spectra, AAEDGFR | 0.000 | 0.000 | 0.000 | 0.207 | 0.033 | 0.392 | 0.282 | 0.086 | ||
| 1 spectrum, SYHTAR | 0.000 | 0.000 | 0.018 | 0.288 | 0.000 | 0.497 | 0.109 | 0.087 | ||
| 2 spectra, AWHAFFTAAER | 0.107 | 0.000 | 0.000 | 0.140 | 0.072 | 0.476 | 0.175 | 0.030 | ||
| 2 spectra, LHGPDSER | 0.000 | 0.000 | 0.000 | 0.000 | 0.000 | 0.773 | 0.227 | 0.000 | ||
| 4 spectra, GPQYGTLEK | 0.000 | 0.000 | 0.000 | 0.214 | 0.000 | 0.584 | 0.083 | 0.119 | ||
| 4 spectra, GAFHRPVLGGFR | 0.000 | 0.000 | 0.000 | 0.238 | 0.037 | 0.534 | 0.088 | 0.103 |
| Plot | Mito | Lyso or Perox | ER | Golgi | PM | Cytosol | Nucleus | ||||||
| Expt B |
6 peptides |
15 spectra |
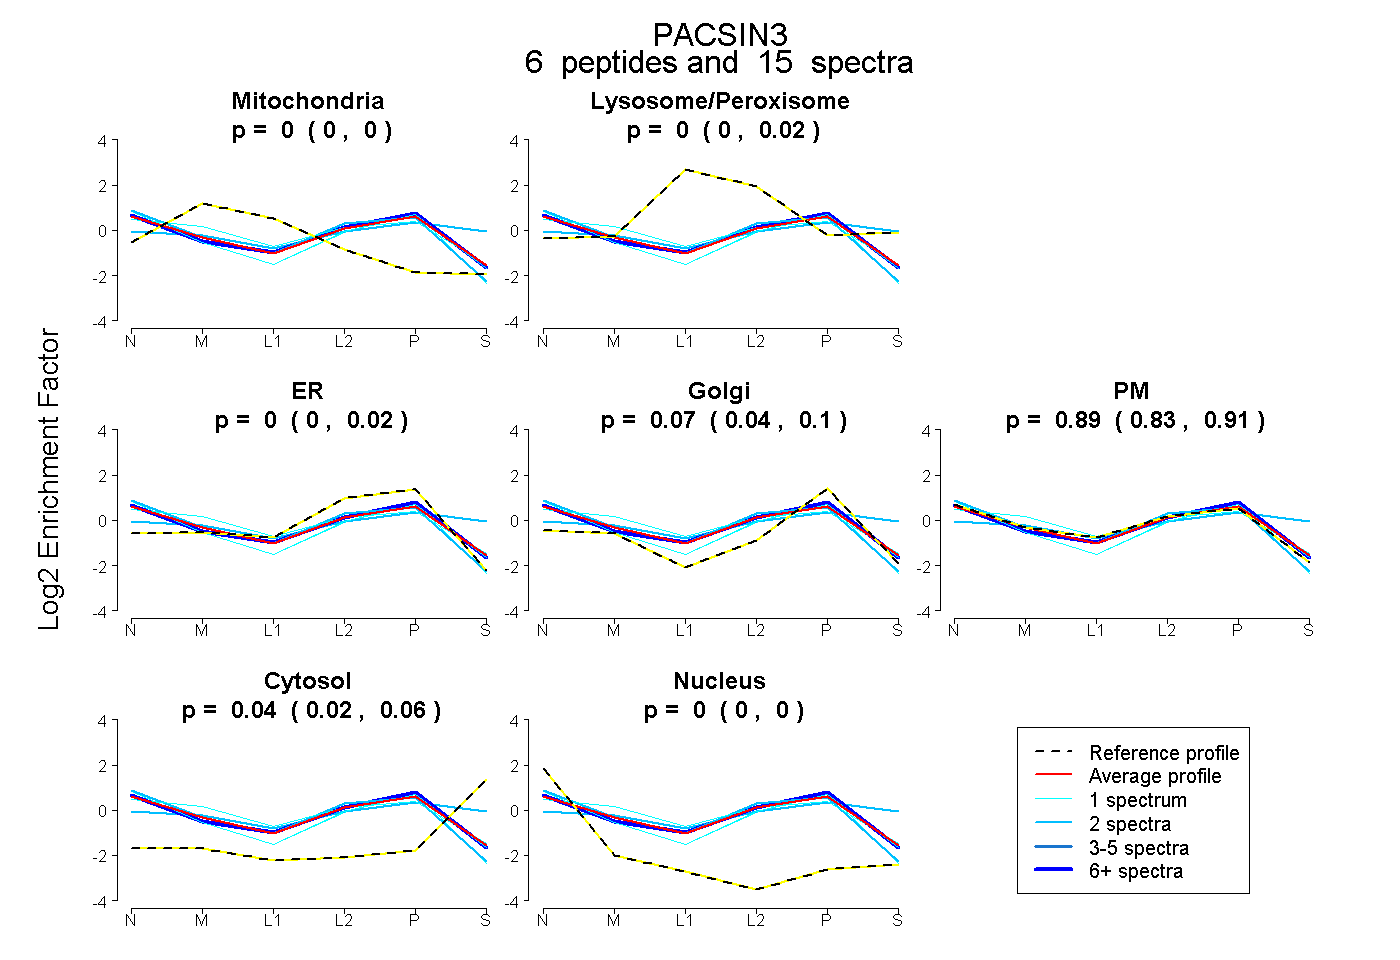 |
0.000 0.000 | 0.000 |
0.004 0.000 | 0.020 |
0.000 0.000 | 0.022 |
0.069 0.037 | 0.095 |
0.885 0.831 | 0.910 |
0.042 0.016 | 0.060 |
0.000 0.000 | 0.000 |
|||
| Plot | Lyso | Other | |||||||||||
| Expt C |
14 peptides |
43 spectra |
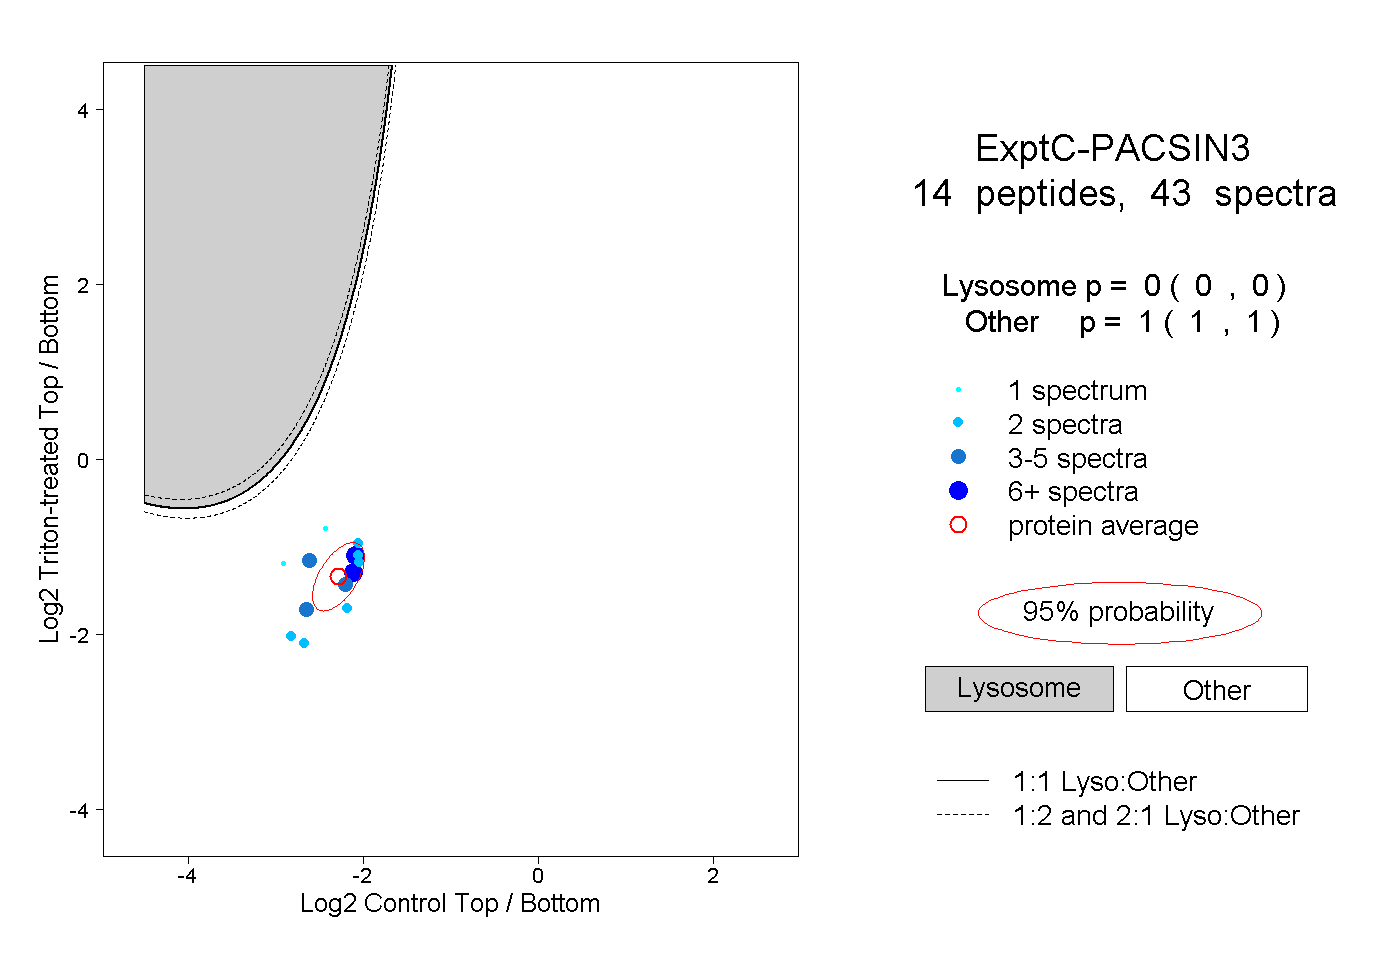 |
0.000 0.000 | 0.000 |
1.000 1.000 | 1.000 |
||||||||
| Plot | Lyso | Other | |||||||||||
| Expt D |
5 peptides |
10 spectra |
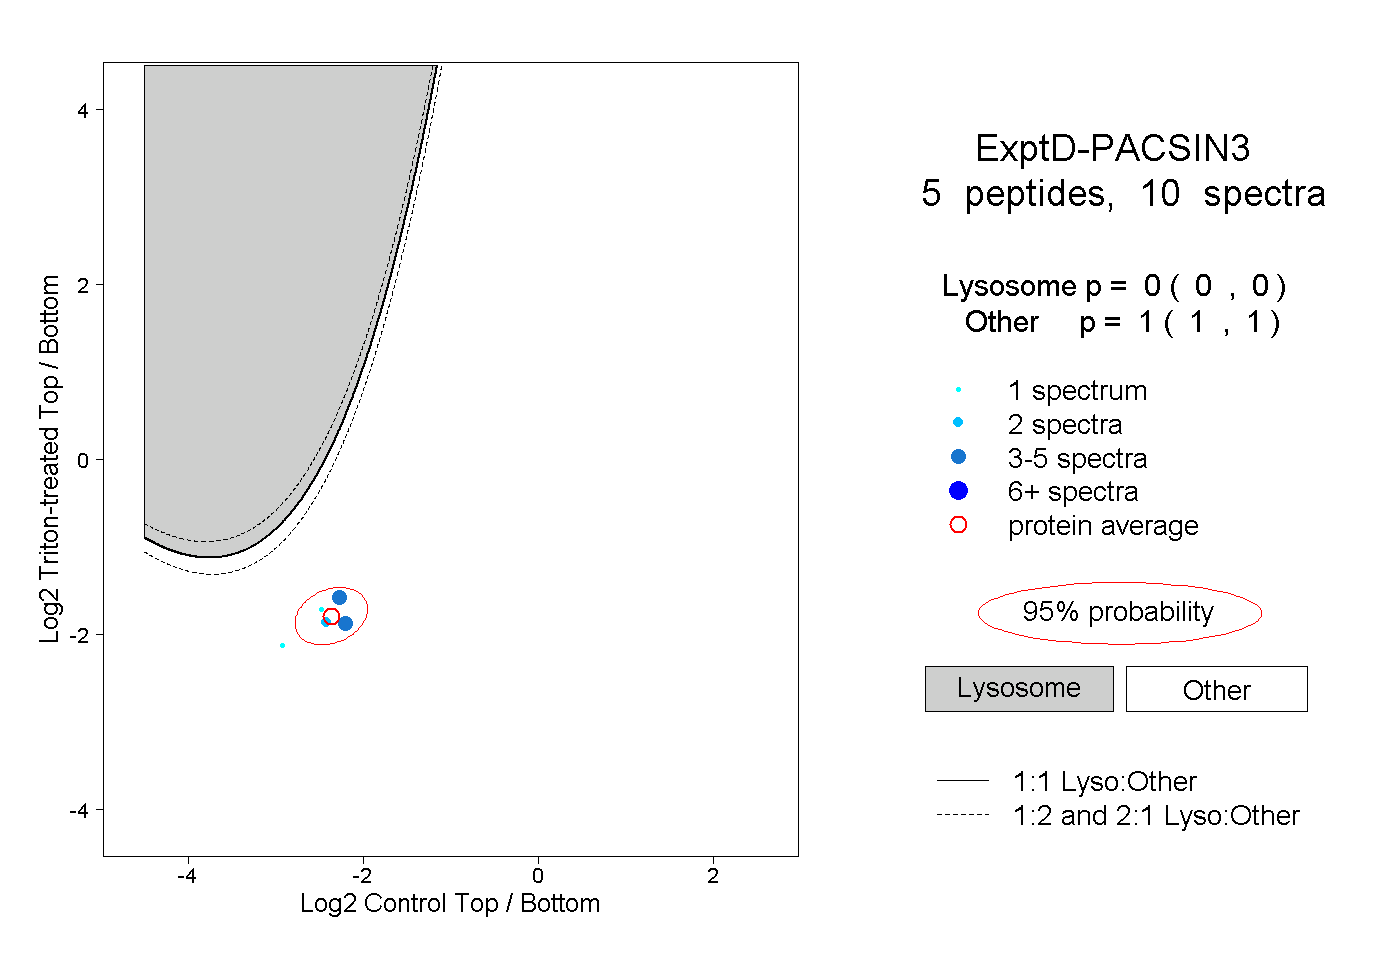 |
0.000 0.000 | 0.000 |
1.000 1.000 | 1.000 |