 5
5peptides
spectra
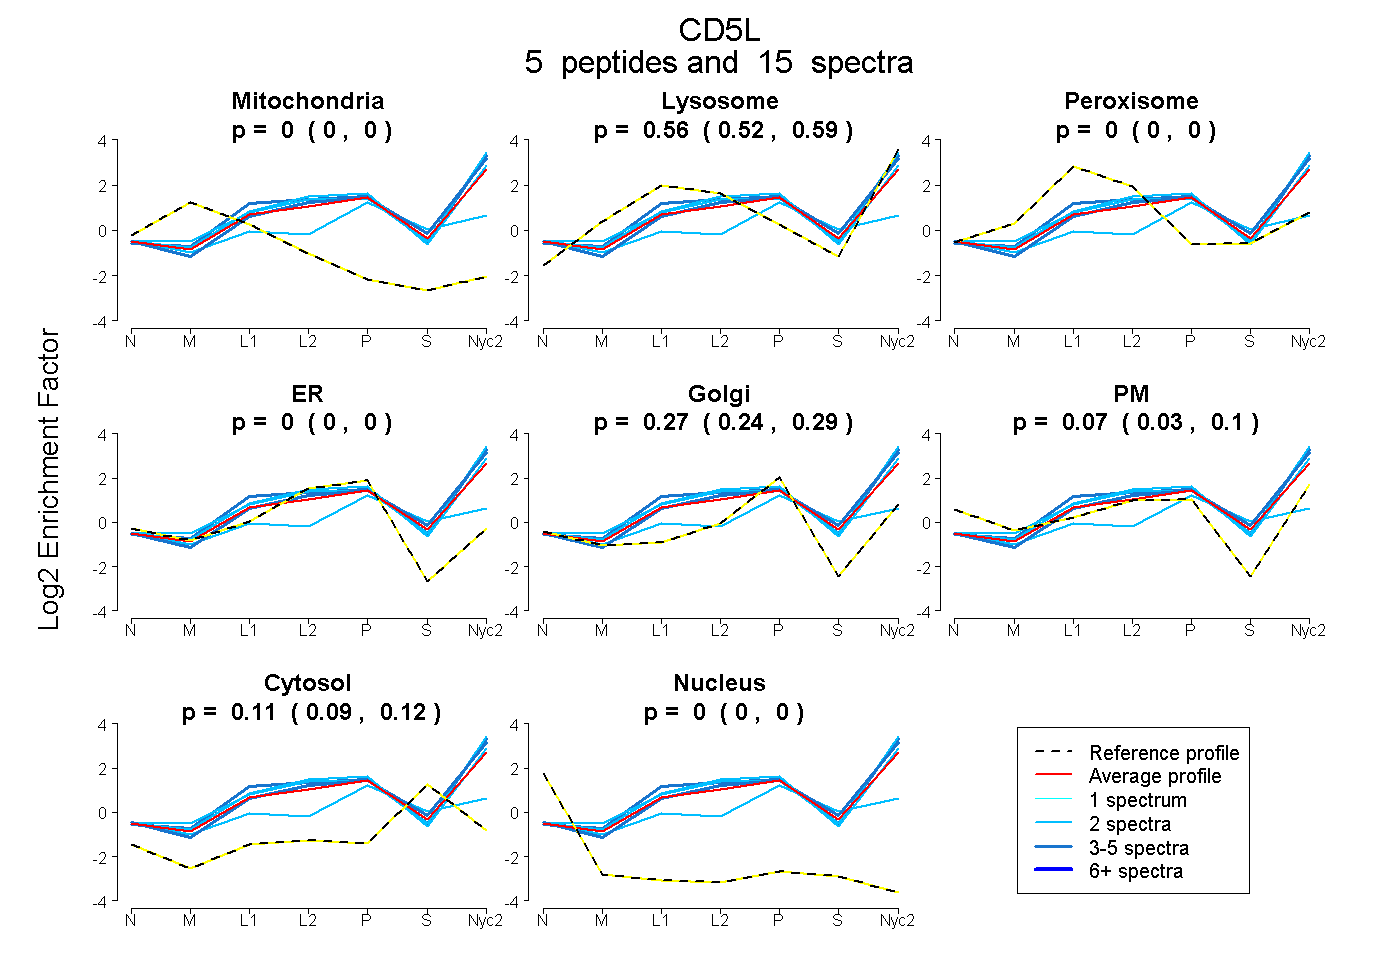
0.000 | 0.000
0.523 | 0.586
0.000 | 0.000
0.000 | 0.000
0.237 | 0.295
0.032 | 0.100
0.087 | 0.119
0.000 | 0.000
2peptides
spectra
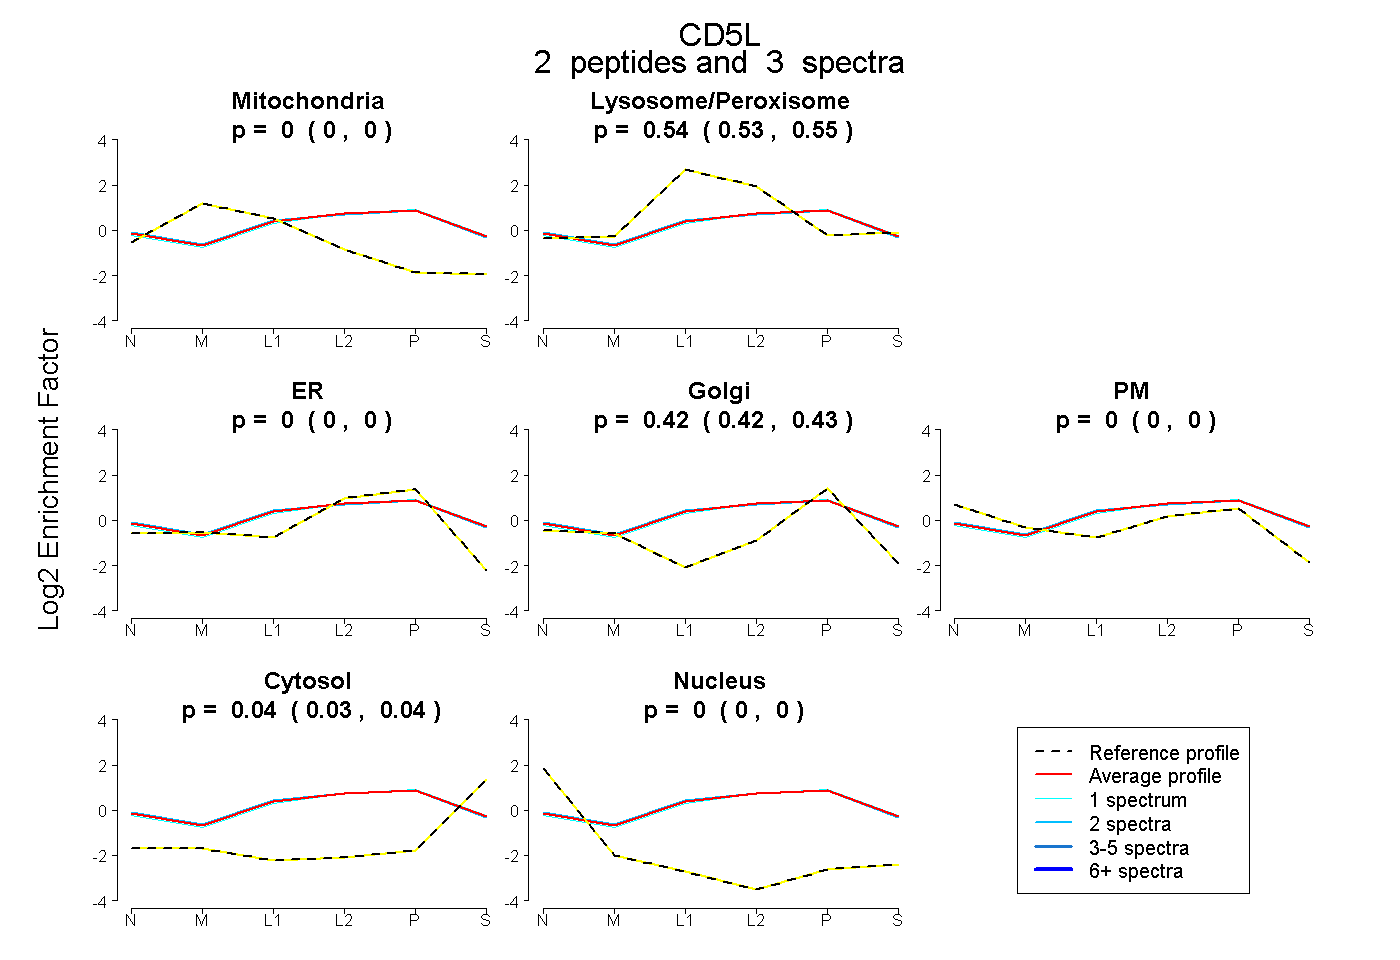
0.000 | 0.000
0.535 | 0.547
0.000 | 0.000
0.415 | 0.430
0.000 | 0.000
0.028 | 0.041
0.000 | 0.000
10peptides
spectra
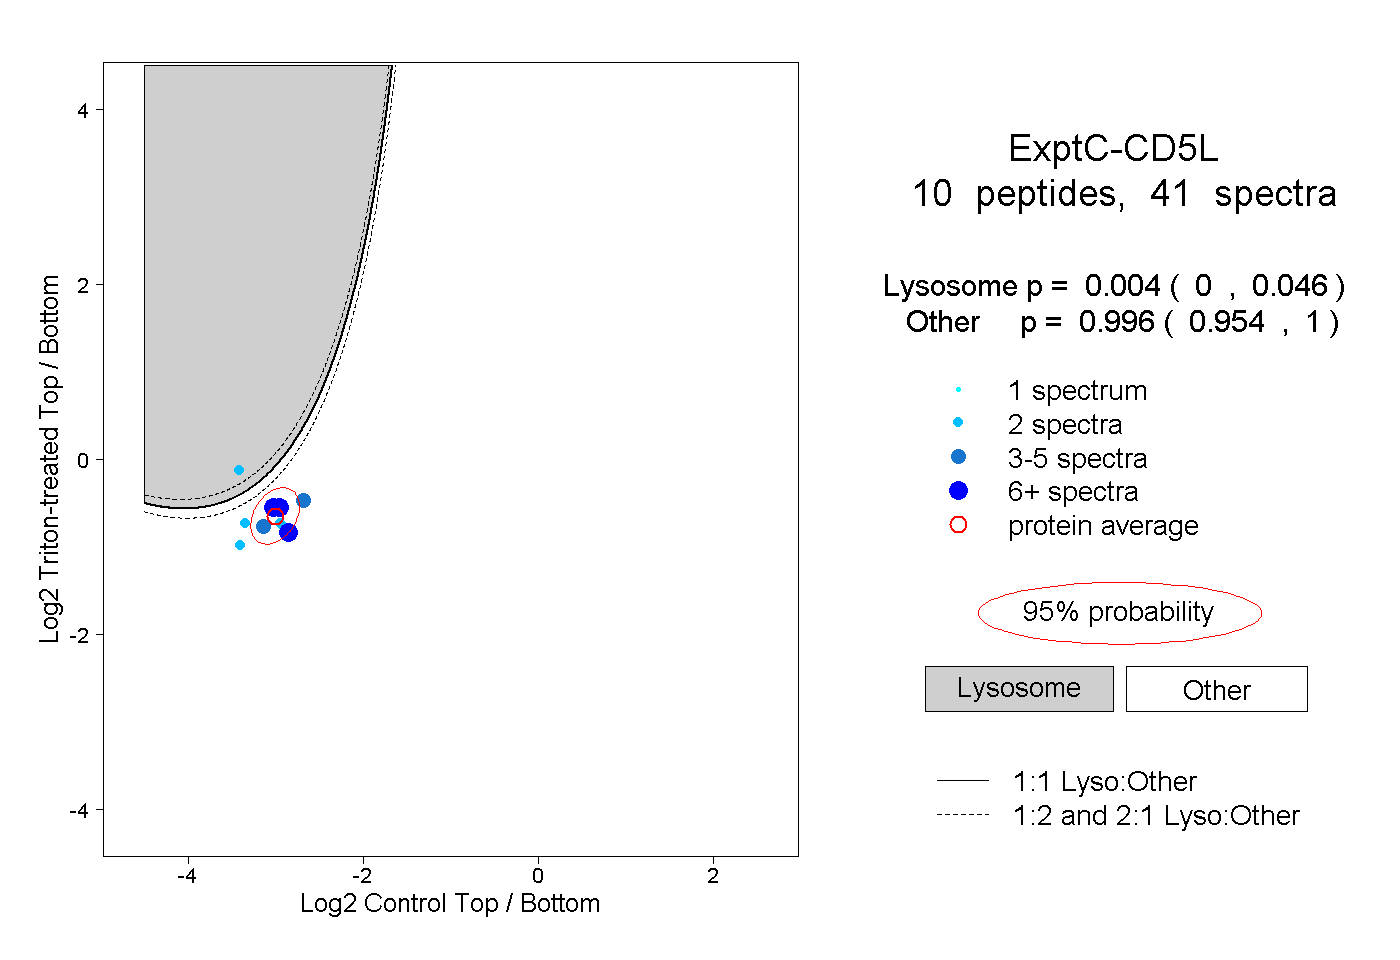
0.000 | 0.046
0.954 | 1.000
5peptides
spectra
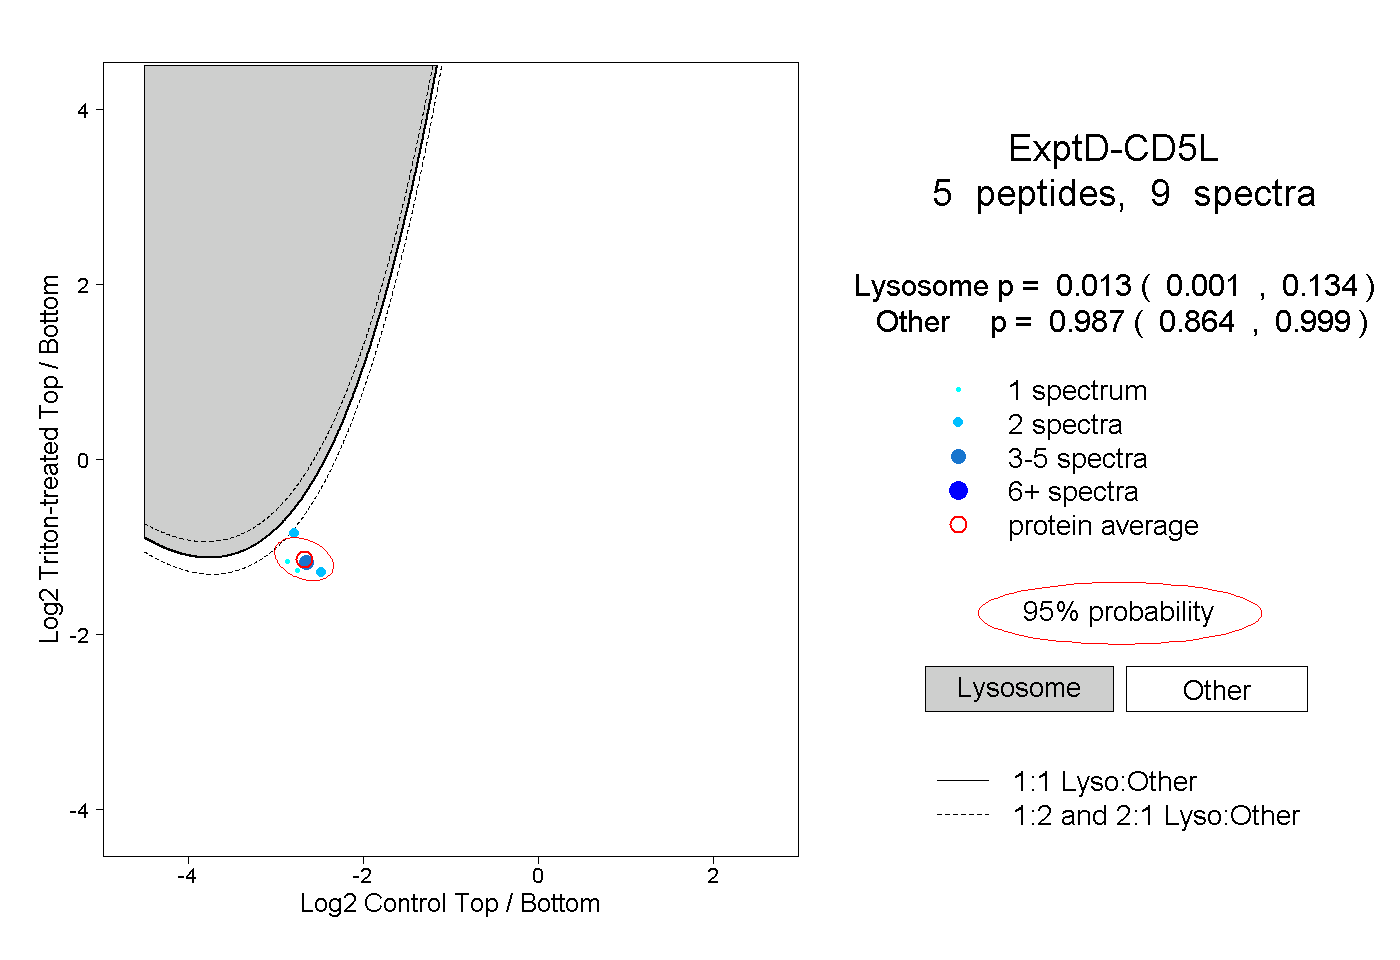
0.001 | 0.134
0.864 | 0.999