 5
5peptides
spectra
0.000 | 0.000
0.523 | 0.586
0.000 | 0.000
0.000 | 0.000
0.237 | 0.295
0.032 | 0.100
0.087 | 0.119
0.000 | 0.000
| Plot | Mito | Lyso | Perox | ER | Golgi | PM | Cytosol | Nucleus | |||||
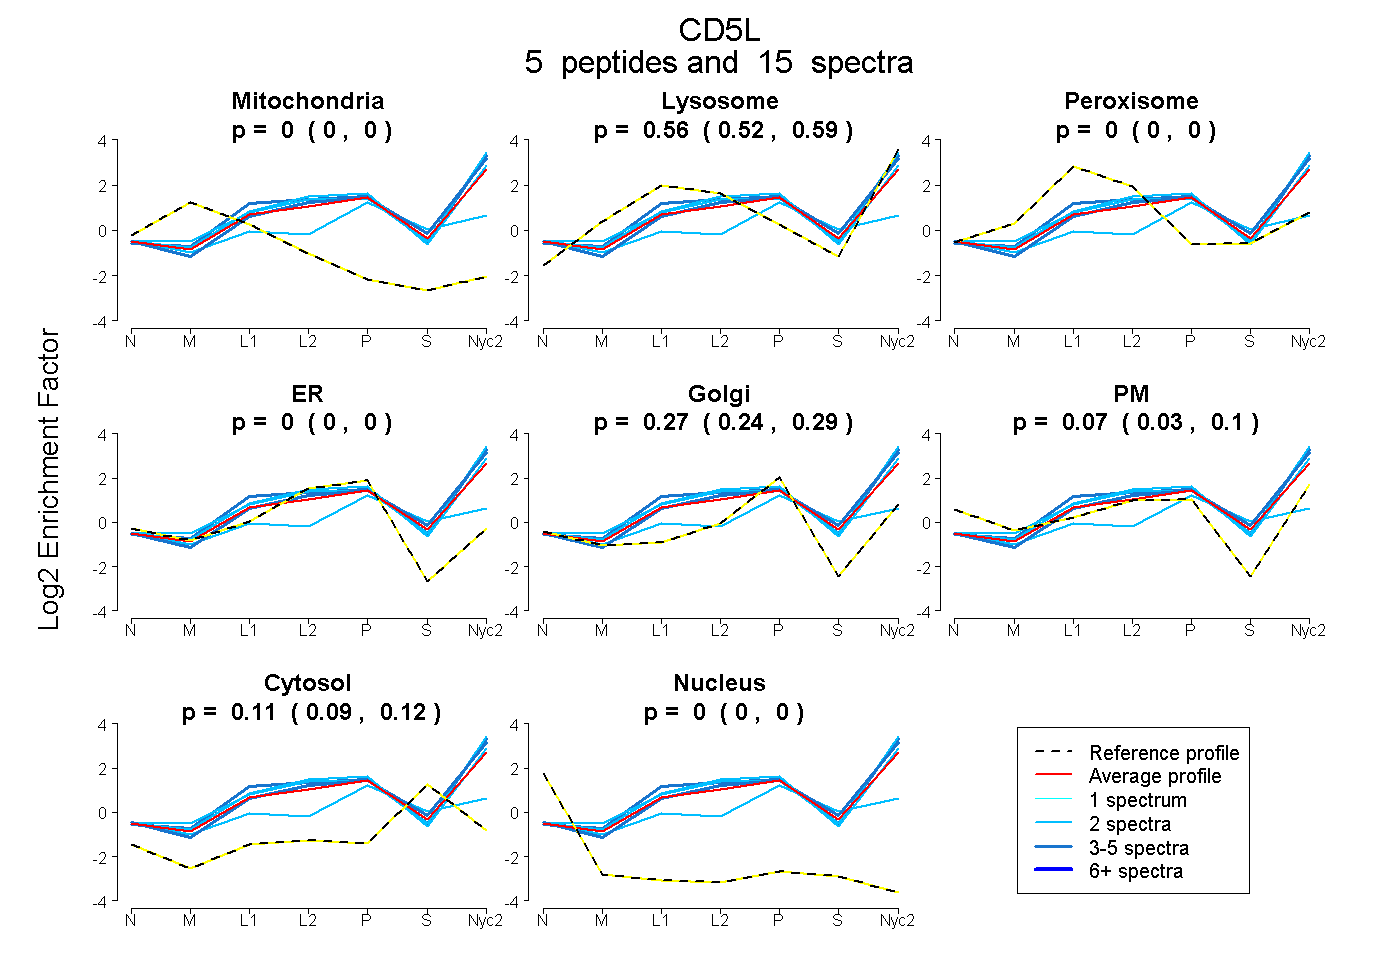
| Expt A |
5 peptides |
15 spectra |
|
0.000 0.000 | 0.000 |
0.556 0.523 | 0.586 |
0.000 0.000 | 0.000 |
0.000 0.000 | 0.000 |
0.269 0.237 | 0.295 |
0.070 0.032 | 0.100 |
0.105 0.087 | 0.119 |
0.000 0.000 | 0.000 |
| 5 spectra, ALLAHR | 0.000 | 0.698 | 0.000 | 0.000 | 0.222 | 0.058 | 0.021 | 0.000 | ||
| 2 spectra, LVGGDTTCSGR | 0.000 | 0.591 | 0.000 | 0.000 | 0.278 | 0.108 | 0.022 | 0.000 | ||
| 4 spectra, LVGGAHR | 0.000 | 0.607 | 0.000 | 0.000 | 0.229 | 0.056 | 0.109 | 0.000 | ||
| 2 spectra, LVEGLGR | 0.000 | 0.666 | 0.000 | 0.000 | 0.197 | 0.117 | 0.020 | 0.000 | ||
| 2 spectra, ELNCGAAK | 0.000 | 0.090 | 0.155 | 0.000 | 0.443 | 0.000 | 0.311 | 0.000 |
| Plot | Mito | Lyso or Perox | ER | Golgi | PM | Cytosol | Nucleus | ||||||
| Expt B |
2 peptides |
3 spectra |
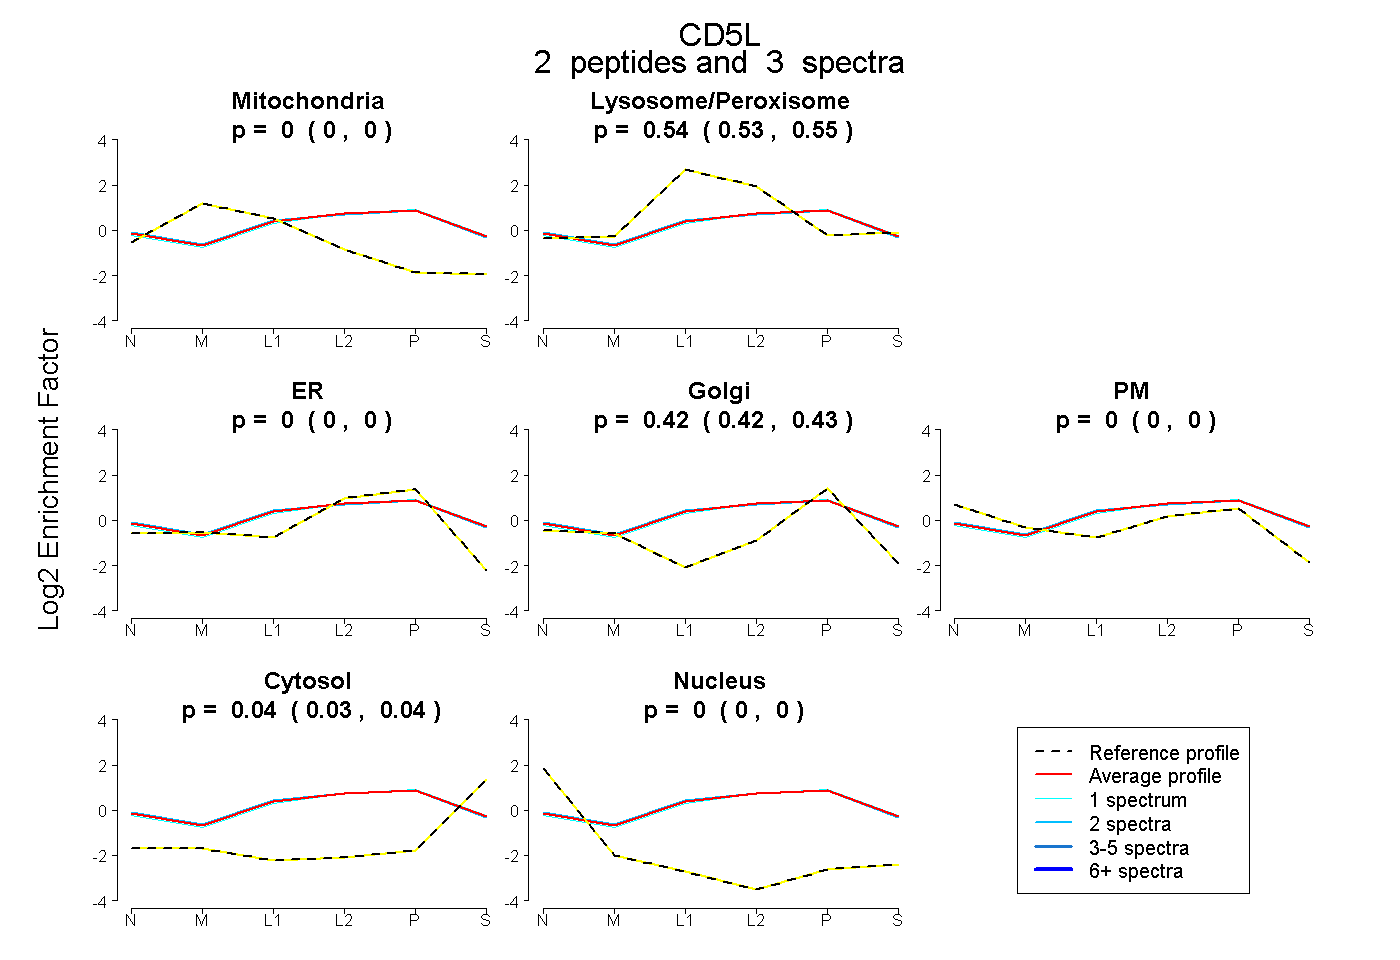 |
0.000 0.000 | 0.000 |
0.541 0.535 | 0.547 |
0.000 0.000 | 0.000 |
0.423 0.415 | 0.430 |
0.000 0.000 | 0.000 |
0.035 0.028 | 0.041 |
0.000 0.000 | 0.000 |
|||
| Plot | Lyso | Other | |||||||||||
| Expt C |
10 peptides |
41 spectra |
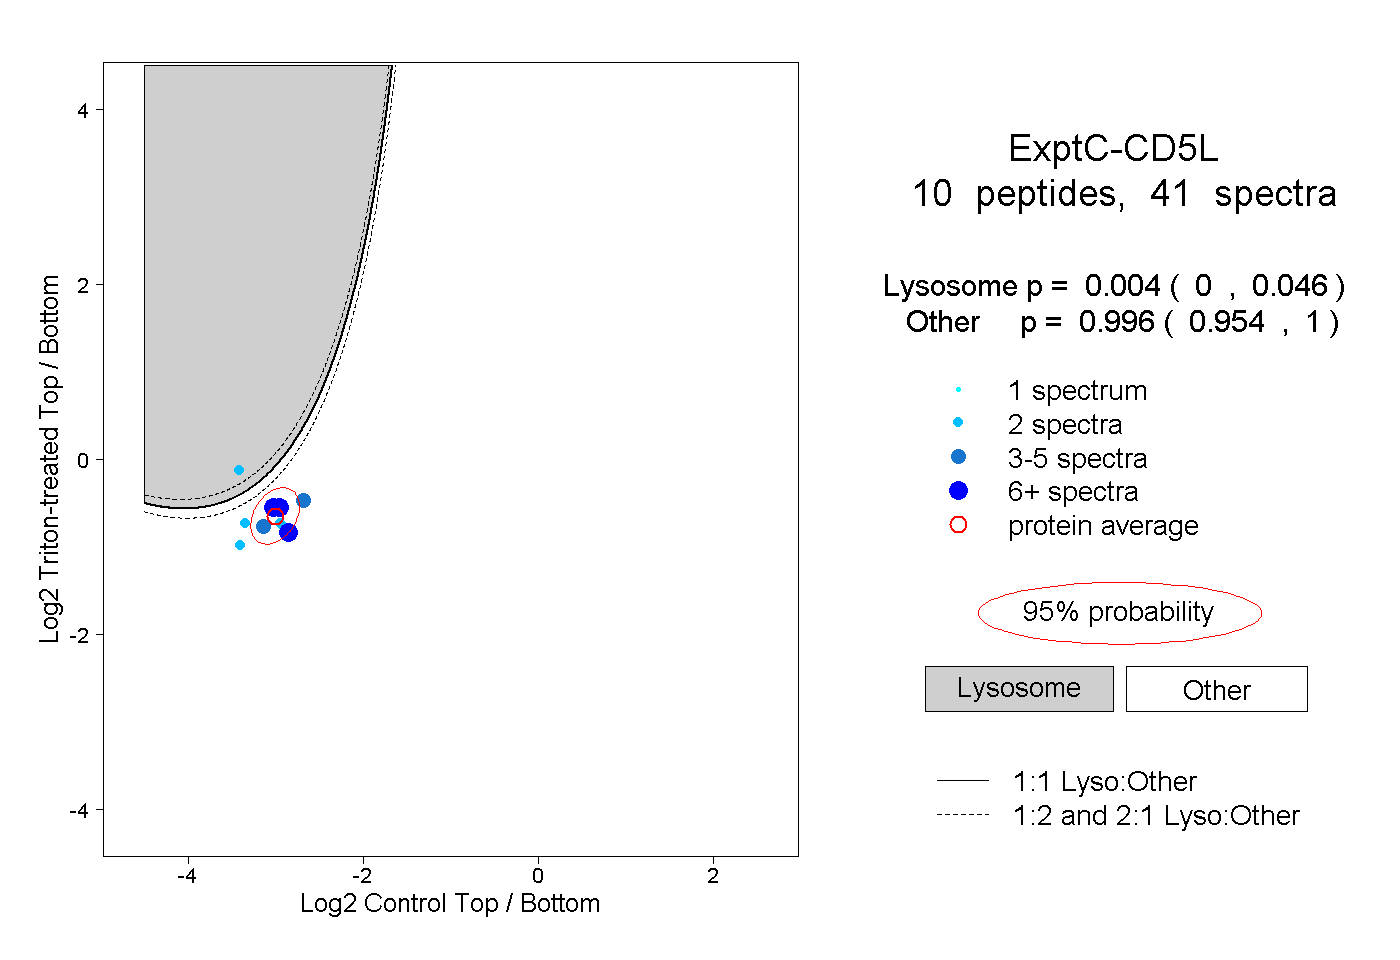 |
0.004 0.000 | 0.046 |
0.996 0.954 | 1.000 |
||||||||
| Plot | Lyso | Other | |||||||||||
| Expt D |
5 peptides |
9 spectra |
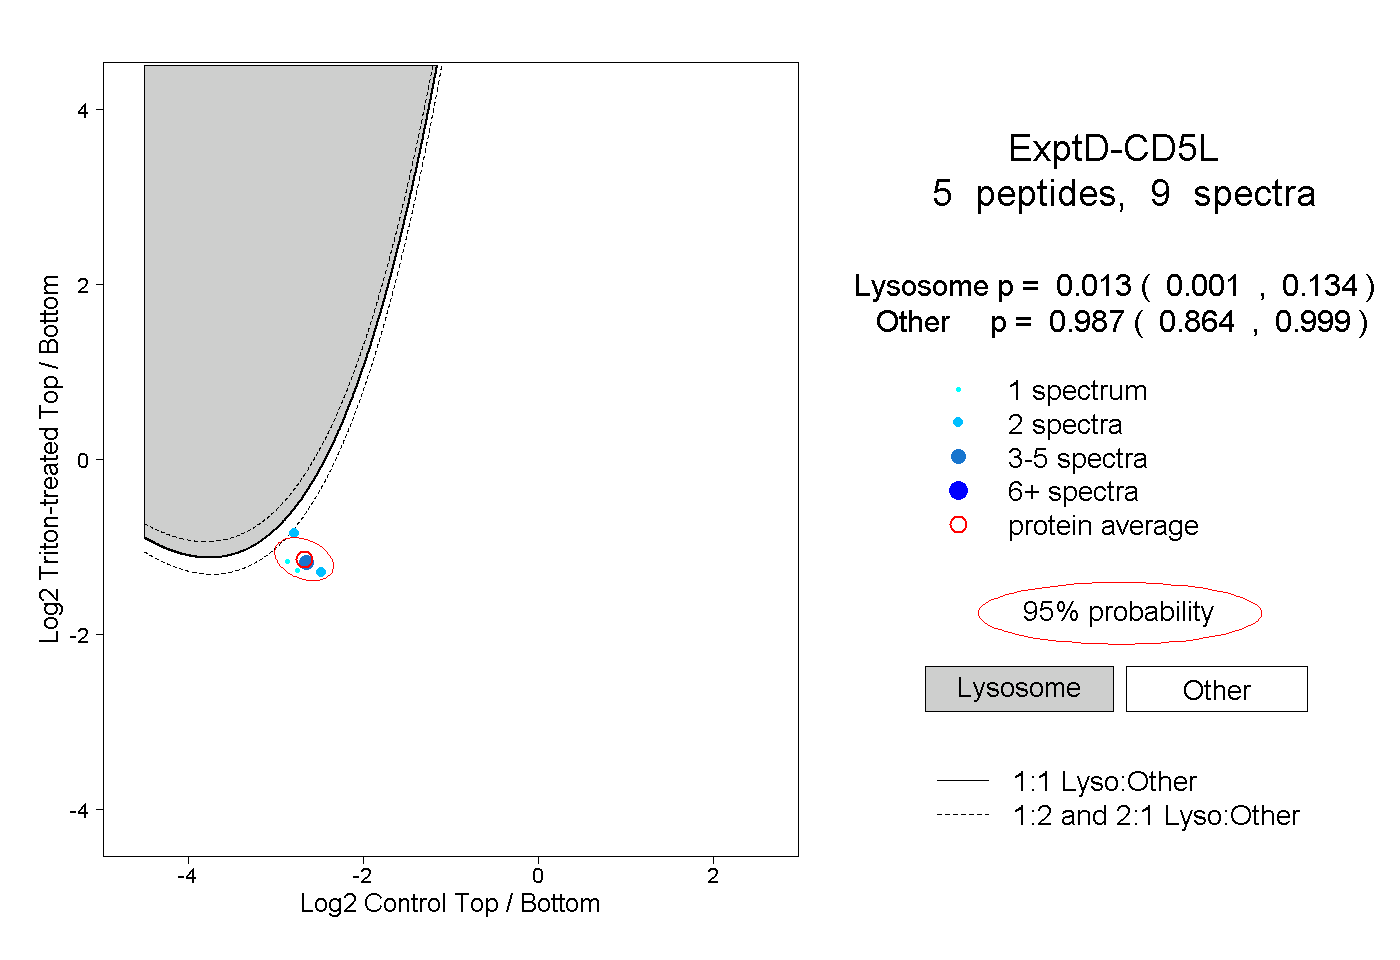 |
0.013 0.001 | 0.134 |
0.987 0.864 | 0.999 |